
William's Environmental
Executive Summary
William’s Environmental is an underground tank removal and installation business that offers its customers a complete waste control system from start to finish. Jean William is starting William’s Environmental in response to the extraordinary housing growth in Webster County over the past three years. In addition, Webster County has approved a rebate program for replacing older septic tanks.
William’s Environmental has over twenty five years of experience in the waste management field. Prior to starting William’s Environmental, Jean served as the general contractor for Hayes Honeybucket Services for ten years. The rest of her staff have over fifteen years of experience serving customers in Webster County. Jean has developed extensive contacts with property managers, home builders and home owners.
The county projects 2,000 more housing starts for this year. Currently, there are 80,000 homes in the county, outside the city of Monroe. Of these homes 50% have underground tanks to manage waste.
Webster County recently approved a program that will assist owners of underground septic tanks that are 15 years old or older to replace their old tanks. The new program will pay up to 40% of the replacement cost. The program begins in May this year. The county estimates that 40% of these older homes have underground tanks that must be replaced in order to limit the threat of ground water contamination. This represents over 20,000 homes that need new underground tanks.
William’s Environmental plans a full assault on the homes this program is targeting. A sales person has been hired by the company to pursue this opportunity full time. William’s Environmental is offering to handle all the paper work to get the home approved for assistance. This is extremely important because a large number of these home have elderly owners.
Jean will invest personal savings in William’s Environmental. A silent partner will match Jean’s investment. In addition, she will obtain a long-term loan.
1.1 Objectives
William’s Environmental has three objectives:
- Gain a significant market share of the septic tank replacement orders.
- Establish a strong relationship with the area’s home builders.
- Increase sales steadily each year for the next three years.
1.2 Mission
The mission of William’s Environmental is to exceed the customer’s expectation of service and product. When the customer calls with an emergency or request, they will get the help they need, fast.
Company Summary
William’s Environmental is a underground septic tank installation, service and removal business that offers its customers a complete waste control system from start to finish.
William’s Environmental has over twenty five years of experience in the waste management field. Jean William has assembled a team of the area’s top professionals in septic tank installation and replacement. William’s Environmental will also hire a sales person to target the older homes that are eligible for a 40% rebate on septic tank replacement that is being offered by the county.
William’s Environmental is located at 3456 Main St., Munroe, New York. The facility/storage yard is 10,000 square feet and located at the junction of Highways 55 and 102.
2.1 Company Ownership
William’s Environmental will incorporated in New York as a C Corporation. Jean William owns 70% of the company shares. The remaining 30% is owned by the silent partner.
2.2 Start-up Summary
The following is the start-up plan for William’s Environmental. Specialized hand tools will be purchased as part of expensed equipment, while excavating equipment, e.g. backhoe, trailers, dump truck, and powered hoist will be leased, with the intent/option to buy, for the initial years of the plan. These large capital purchases will be deferred until the business is profitably established.

| Start-up | |
| Requirements | |
| Start-up Expenses | |
| Legal | $1,000 |
| Stationery etc. | $200 |
| Brochures | $1,000 |
| Office Setup | $10,000 |
| Insurance | $3,000 |
| Rent | $2,000 |
| 2 Vans-used | $22,000 |
| Installation Inventory | $10,000 |
| Tank Inventory | $30,000 |
| Expensed Equipment | $20,000 |
| Other | $0 |
| Total Start-up Expenses | $99,200 |
| Start-up Assets | |
| Cash Required | $80,800 |
| Start-up Inventory | $0 |
| Other Current Assets | $0 |
| Long-term Assets | $30,000 |
| Total Assets | $110,800 |
| Total Requirements | $210,000 |
| Start-up Funding | |
| Start-up Expenses to Fund | $99,200 |
| Start-up Assets to Fund | $110,800 |
| Total Funding Required | $210,000 |
| Assets | |
| Non-cash Assets from Start-up | $30,000 |
| Cash Requirements from Start-up | $80,800 |
| Additional Cash Raised | $0 |
| Cash Balance on Starting Date | $80,800 |
| Total Assets | $110,800 |
| Liabilities and Capital | |
| Liabilities | |
| Current Borrowing | $0 |
| Long-term Liabilities | $100,000 |
| Accounts Payable (Outstanding Bills) | $0 |
| Other Current Liabilities (interest-free) | $0 |
| Total Liabilities | $100,000 |
| Capital | |
| Planned Investment | |
| Jean William | $50,000 |
| Investor 2 | $60,000 |
| Other | $0 |
| Additional Investment Requirement | $0 |
| Total Planned Investment | $110,000 |
| Loss at Start-up (Start-up Expenses) | ($99,200) |
| Total Capital | $10,800 |
| Total Capital and Liabilities | $110,800 |
| Total Funding | $210,000 |
Services
William’s Environmental installs, removes and maintains underground waste storage tanks in the Webster County area. William’s Environmental offers a 24-hour trouble shooting service that provides customers with around-the-clock coverage.
Market Analysis Summary
As the city of Monroe expands its borders, more and more city dwellers are choosing to live outside of Monroe in surrounding Webster County. Population in the county has grown by 10% over the past three years. The county projects 2,000 more rural housing starts for 2002. New home starts are on the upswing. Most of these new homes will have independent waste management systems. The area’s prominent builders have been in the county for over twenty years. Jean William has an excellent reputation with these builders. The new housing is clustered near the towns within 25 miles of Monroe (Bradford, Lincoln, Tracy, and Madison).
Currently, there are 80,000 homes in the county, outside the city of Monroe. Of these homes 50% have underground tanks to manage waste. More importantly, 40% of these homes are more than 20 years old. The county estimates that 60% of these older homes have underground tanks that must be replaced in order to limit the threat of ground water contamination. This represents over 20,000 homes that need new underground tanks. A majority of these homes are located in and around the villages of Riley, Jacksonville, Oakland, and Reed.
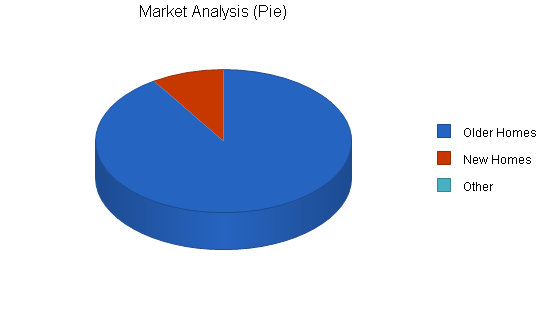
4.1 Market Segmentation
William’s Environmental will focus on the following target customers:
- Owners of older homes (20 years old or older)
- New home builders.
| Market Analysis | |||||||
| Year 1 | Year 2 | Year 3 | Year 4 | Year 5 | |||
| Potential Customers | Growth | CAGR | |||||
| Older Homes | 8% | 20,000 | 21,600 | 23,328 | 25,194 | 27,210 | 8.00% |
| New Homes | 15% | 2,000 | 2,300 | 2,645 | 3,042 | 3,498 | 15.00% |
| Other | 0% | 0 | 0 | 0 | 0 | 0 | 0.00% |
| Total | 8.69% | 22,000 | 23,900 | 25,973 | 28,236 | 30,708 | 8.69% |
Strategy and Implementation Summary
Webster County recently approved a program that will assist owners of underground septic tanks that are 15 years old or older to replace their old tanks. The new program will pay up to 40% of the replacement cost. The program will begin this May.
William’s Environmental plans a full assault on the homes this program is targeting. A sales person has been hired by the company to pursue this opportunity full time. William’s Environmental is offering to handle all the paper work to get the home approved for assistance. This is extremely important because a large number of these home have elderly owners.
Another focus of this campaign will be Jean herself. She is an active member in county activities and is well known by the county residents. She is particularly active in women’s organizations that involve many residents that are the target of the septic tank replacement program.
With new homes, Jean will sell William’s Environmental to the numerous builders that she has worked with in the past. She has an excellent reputation as a contractor and will be successful in competing for waste management tank installation contracts.

5.1 Competitive Edge
The competitive edge for William’s Environmental is its staff. Each employee has extensive experience in the septic tank installation and removal. They are customer-oriented and pride themselves on quality products and services.
The staff is a follows:
- Bill Johnson: Seven years of septic tank installation and removal.
- Roger Davidson: Five years of septic tank installation and removal.
- Rudy Willis: Six years of septic tank installation and removal.
5.2 Sales Strategy
William’s Environmental will employ a full-time sales person to sell the county septic tank replacement program to county residents. The salesperson will provide assistance to homeowners in filing for the septic tank rebate.
Jean will focus on securing installation work with new home builders.
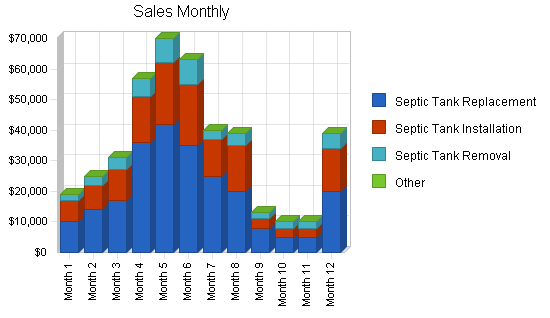
5.2.1 Sales Forecast
The following is the sales forecast for three years. Sales and work predominantly occur during the temperate months. Snow and frozen ground make excavation for tank replacement more difficult, though not impossible, in the winter months.
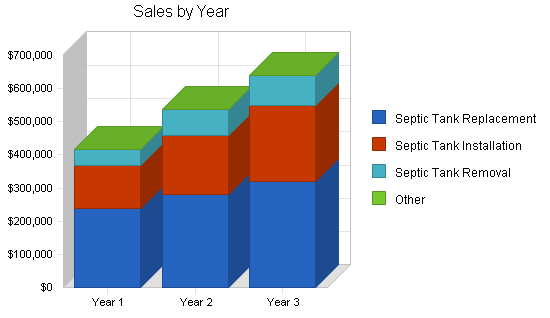
| Sales Forecast | |||
| Year 1 | Year 2 | Year 3 | |
| Sales | |||
| Septic Tank Replacement | $237,000 | $280,000 | $320,000 |
| Septic Tank Installation | $130,000 | $180,000 | $230,000 |
| Septic Tank Removal | $49,000 | $76,000 | $89,000 |
| Other | $0 | $0 | $0 |
| Total Sales | $416,000 | $536,000 | $639,000 |
| Direct Cost of Sales | Year 1 | Year 2 | Year 3 |
| Septic Tank Replacement | $118,500 | $140,000 | $160,000 |
| Septic Tank Installation | $52,500 | $62,000 | $75,000 |
| Septic Tank Removal | $12,250 | $19,000 | $22,250 |
| Other | $0 | $0 | $0 |
| Subtotal Direct Cost of Sales | $183,250 | $221,000 | $257,250 |
Management Summary
Jean William will manage William’s Environmental. She is an experienced project manager, and has many years of supervisory experience in the construction industry.
6.1 Personnel Plan
The personnel plan for William’s Environmental is as follows:
- Manager
- Salesperson
- 3 Installation/Removal Staff
| Personnel Plan | |||
| Year 1 | Year 2 | Year 3 | |
| Manager | $42,000 | $45,000 | $48,000 |
| Salesperson | $36,000 | $40,000 | $43,000 |
| 3 Installation/Removal Staff | $100,800 | $106,800 | $113,000 |
| Other | $0 | $0 | $0 |
| Total People | 3 | 3 | 3 |
| Total Payroll | $178,800 | $191,800 | $204,000 |
Financial Plan
The following is the financial plan for William’s Environmental.
7.1 Break-even Analysis
The monthly break-even point is calcualted below, based upon estimated average monthly costs and costs of sales variable percentage.

| Break-even Analysis | |
| Monthly Revenue Break-even | $40,613 |
| Assumptions: | |
| Average Percent Variable Cost | 44% |
| Estimated Monthly Fixed Cost | $22,723 |
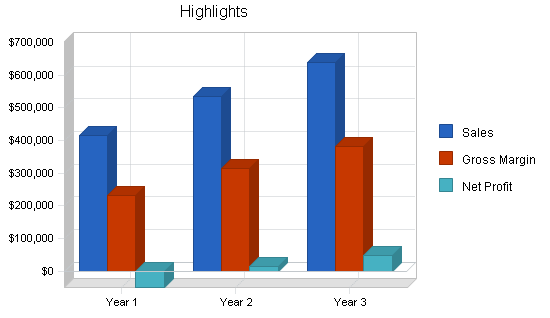
7.2 Projected Profit and Loss
The following is the projected profit and loss for three years.


| Pro Forma Profit and Loss | |||
| Year 1 | Year 2 | Year 3 | |
| Sales | $416,000 | $536,000 | $639,000 |
| Direct Cost of Sales | $183,250 | $221,000 | $257,250 |
| Other Production Expenses | $0 | $0 | $0 |
| Total Cost of Sales | $183,250 | $221,000 | $257,250 |
| Gross Margin | $232,750 | $315,000 | $381,750 |
| Gross Margin % | 55.95% | 58.77% | 59.74% |
| Expenses | |||
| Payroll | $178,800 | $191,800 | $204,000 |
| Sales and Marketing and Other Expenses | $12,000 | $13,500 | $16,500 |
| Depreciation | $8,856 | $8,856 | $8,856 |
| Leased Equipment | $30,000 | $30,000 | $30,000 |
| Utilities | $1,800 | $0 | $0 |
| Insurance | $2,400 | $2,700 | $3,000 |
| Rent | $12,000 | $11,000 | $11,000 |
| Payroll Taxes | $26,820 | $28,770 | $30,600 |
| Other | $0 | $0 | $0 |
| Total Operating Expenses | $272,676 | $286,626 | $303,956 |
| Profit Before Interest and Taxes | ($39,926) | $28,374 | $77,794 |
| EBITDA | ($31,070) | $37,230 | $86,650 |
| Interest Expense | $9,459 | $8,501 | $7,501 |
| Taxes Incurred | $0 | $5,962 | $21,088 |
| Net Profit | ($49,385) | $13,911 | $49,205 |
| Net Profit/Sales | -11.87% | 2.60% | 7.70% |
7.3 Projected Cash Flow
The following is the projected cash flow for three years.

| Pro Forma Cash Flow | |||
| Year 1 | Year 2 | Year 3 | |
| Cash Received | |||
| Cash from Operations | |||
| Cash Sales | $208,000 | $268,000 | $319,500 |
| Cash from Receivables | $183,667 | $260,981 | $313,475 |
| Subtotal Cash from Operations | $391,667 | $528,981 | $632,975 |
| Additional Cash Received | |||
| Sales Tax, VAT, HST/GST Received | $0 | $0 | $0 |
| New Current Borrowing | $0 | $0 | $0 |
| New Other Liabilities (interest-free) | $0 | $0 | $0 |
| New Long-term Liabilities | $0 | $0 | $0 |
| Sales of Other Current Assets | $0 | $0 | $0 |
| Sales of Long-term Assets | $0 | $0 | $0 |
| New Investment Received | $0 | $0 | $0 |
| Subtotal Cash Received | $391,667 | $528,981 | $632,975 |
| Expenditures | Year 1 | Year 2 | Year 3 |
| Expenditures from Operations | |||
| Cash Spending | $178,800 | $191,800 | $204,000 |
| Bill Payments | $260,746 | $333,251 | $375,925 |
| Subtotal Spent on Operations | $439,546 | $525,051 | $579,925 |
| Additional Cash Spent | |||
| Sales Tax, VAT, HST/GST Paid Out | $0 | $0 | $0 |
| Principal Repayment of Current Borrowing | $0 | $0 | $0 |
| Other Liabilities Principal Repayment | $0 | $0 | $0 |
| Long-term Liabilities Principal Repayment | $9,996 | $9,996 | $9,996 |
| Purchase Other Current Assets | $0 | $0 | $0 |
| Purchase Long-term Assets | $0 | $0 | $0 |
| Dividends | $0 | $0 | $0 |
| Subtotal Cash Spent | $449,542 | $535,047 | $589,921 |
| Net Cash Flow | ($57,875) | ($6,066) | $43,054 |
| Cash Balance | $22,925 | $16,859 | $59,913 |
7.4 Projected Balance Sheet
The following is the projected balance sheet for three years.
| Pro Forma Balance Sheet | |||
| Year 1 | Year 2 | Year 3 | |
| Assets | |||
| Current Assets | |||
| Cash | $22,925 | $16,859 | $59,913 |
| Accounts Receivable | $24,333 | $31,353 | $37,377 |
| Inventory | $17,875 | $21,557 | $25,093 |
| Other Current Assets | $0 | $0 | $0 |
| Total Current Assets | $65,133 | $69,769 | $122,384 |
| Long-term Assets | |||
| Long-term Assets | $30,000 | $30,000 | $30,000 |
| Accumulated Depreciation | $8,856 | $17,712 | $26,568 |
| Total Long-term Assets | $21,144 | $12,288 | $3,432 |
| Total Assets | $86,277 | $82,057 | $125,816 |
| Liabilities and Capital | Year 1 | Year 2 | Year 3 |
| Current Liabilities | |||
| Accounts Payable | $34,858 | $26,722 | $31,272 |
| Current Borrowing | $0 | $0 | $0 |
| Other Current Liabilities | $0 | $0 | $0 |
| Subtotal Current Liabilities | $34,858 | $26,722 | $31,272 |
| Long-term Liabilities | $90,004 | $80,008 | $70,012 |
| Total Liabilities | $124,862 | $106,730 | $101,284 |
| Paid-in Capital | $110,000 | $110,000 | $110,000 |
| Retained Earnings | ($99,200) | ($148,585) | ($134,673) |
| Earnings | ($49,385) | $13,911 | $49,205 |
| Total Capital | ($38,585) | ($24,673) | $24,532 |
| Total Liabilities and Capital | $86,277 | $82,057 | $125,816 |
| Net Worth | ($38,585) | ($24,673) | $24,532 |
7.5 Business Ratios
Business ratios for the years of this plan are shown below. Industry profile ratios based on the Standard Industrial Classification (SIC) code 1711, Plumbing, Heating and Air Conditioning (which includes septic tank installation contractors), are shown for comparison.
| Ratio Analysis | ||||
| Year 1 | Year 2 | Year 3 | Industry Profile | |
| Sales Growth | 0.00% | 28.85% | 19.22% | 6.60% |
| Percent of Total Assets | ||||
| Accounts Receivable | 28.20% | 38.21% | 29.71% | 46.40% |
| Inventory | 20.72% | 26.27% | 19.94% | 8.70% |
| Other Current Assets | 0.00% | 0.00% | 0.00% | 29.30% |
| Total Current Assets | 75.49% | 85.02% | 97.27% | 84.40% |
| Long-term Assets | 24.51% | 14.98% | 2.73% | 15.60% |
| Total Assets | 100.00% | 100.00% | 100.00% | 100.00% |
| Current Liabilities | 40.40% | 32.57% | 24.86% | 47.20% |
| Long-term Liabilities | 104.32% | 97.50% | 55.65% | 9.10% |
| Total Liabilities | 144.72% | 130.07% | 80.50% | 56.30% |
| Net Worth | -44.72% | -30.07% | 19.50% | 43.70% |
| Percent of Sales | ||||
| Sales | 100.00% | 100.00% | 100.00% | 100.00% |
| Gross Margin | 55.95% | 58.77% | 59.74% | 26.50% |
| Selling, General & Administrative Expenses | 67.82% | 56.17% | 52.04% | 14.60% |
| Advertising Expenses | 1.73% | 1.49% | 1.56% | 0.40% |
| Profit Before Interest and Taxes | -9.60% | 5.29% | 12.17% | 2.20% |
| Main Ratios | ||||
| Current | 1.87 | 2.61 | 3.91 | 1.87 |
| Quick | 1.36 | 1.80 | 3.11 | 1.47 |
| Total Debt to Total Assets | 144.72% | 130.07% | 80.50% | 56.30% |
| Pre-tax Return on Net Worth | 127.99% | -80.55% | 286.54% | 6.80% |
| Pre-tax Return on Assets | -57.24% | 24.22% | 55.87% | 15.50% |
| Additional Ratios | Year 1 | Year 2 | Year 3 | |
| Net Profit Margin | -11.87% | 2.60% | 7.70% | n.a |
| Return on Equity | 0.00% | 0.00% | 200.58% | n.a |
| Activity Ratios | ||||
| Accounts Receivable Turnover | 8.55 | 8.55 | 8.55 | n.a |
| Collection Days | 57 | 38 | 39 | n.a |
| Inventory Turnover | 10.18 | 11.21 | 11.03 | n.a |
| Accounts Payable Turnover | 8.48 | 12.17 | 12.17 | n.a |
| Payment Days | 27 | 35 | 28 | n.a |
| Total Asset Turnover | 4.82 | 6.53 | 5.08 | n.a |
| Debt Ratios | ||||
| Debt to Net Worth | 0.00 | 0.00 | 4.13 | n.a |
| Current Liab. to Liab. | 0.28 | 0.25 | 0.31 | n.a |
| Liquidity Ratios | ||||
| Net Working Capital | $30,275 | $43,047 | $91,112 | n.a |
| Interest Coverage | -4.22 | 3.34 | 10.37 | n.a |
| Additional Ratios | ||||
| Assets to Sales | 0.21 | 0.15 | 0.20 | n.a |
| Current Debt/Total Assets | 40% | 33% | 25% | n.a |
| Acid Test | 0.66 | 0.63 | 1.92 | n.a |
| Sales/Net Worth | 0.00 | 0.00 | 26.05 | n.a |
| Dividend Payout | 0.00 | 0.00 | 0.00 | n.a |
Appendix
| Sales Forecast | |||||||||||||
| Month 1 | Month 2 | Month 3 | Month 4 | Month 5 | Month 6 | Month 7 | Month 8 | Month 9 | Month 10 | Month 11 | Month 12 | ||
| Sales | |||||||||||||
| Septic Tank Replacement | 0% | $10,000 | $14,000 | $17,000 | $36,000 | $42,000 | $35,000 | $25,000 | $20,000 | $8,000 | $5,000 | $5,000 | $20,000 |
| Septic Tank Installation | 0% | $7,000 | $8,000 | $10,000 | $15,000 | $20,000 | $20,000 | $12,000 | $15,000 | $3,000 | $3,000 | $3,000 | $14,000 |
| Septic Tank Removal | 0% | $2,000 | $3,000 | $4,000 | $6,000 | $8,000 | $8,000 | $3,000 | $4,000 | $2,000 | $2,000 | $2,000 | $5,000 |
| Other | 0% | $0 | $0 | $0 | $0 | $0 | $0 | $0 | $0 | $0 | $0 | $0 | $0 |
| Total Sales | $19,000 | $25,000 | $31,000 | $57,000 | $70,000 | $63,000 | $40,000 | $39,000 | $13,000 | $10,000 | $10,000 | $39,000 | |
| Direct Cost of Sales | Month 1 | Month 2 | Month 3 | Month 4 | Month 5 | Month 6 | Month 7 | Month 8 | Month 9 | Month 10 | Month 11 | Month 12 | |
| Septic Tank Replacement | $5,000 | $7,000 | $8,500 | $18,000 | $21,000 | $17,500 | $12,500 | $10,000 | $4,000 | $2,500 | $2,500 | $10,000 | |
| Septic Tank Installation | $3,000 | $3,500 | $4,000 | $6,500 | $8,000 | $8,000 | $5,000 | $6,500 | $1,000 | $1,000 | $1,000 | $5,000 | |
| Septic Tank Removal | $500 | $750 | $1,000 | $1,500 | $2,000 | $2,000 | $750 | $1,000 | $500 | $500 | $500 | $1,250 | |
| Other | $0 | $0 | $0 | $0 | $0 | $0 | $0 | $0 | $0 | $0 | $0 | $0 | |
| Subtotal Direct Cost of Sales | $8,500 | $11,250 | $13,500 | $26,000 | $31,000 | $27,500 | $18,250 | $17,500 | $5,500 | $4,000 | $4,000 | $16,250 | |
| Personnel Plan | |||||||||||||
| Month 1 | Month 2 | Month 3 | Month 4 | Month 5 | Month 6 | Month 7 | Month 8 | Month 9 | Month 10 | Month 11 | Month 12 | ||
| Manager | 0% | $3,500 | $3,500 | $3,500 | $3,500 | $3,500 | $3,500 | $3,500 | $3,500 | $3,500 | $3,500 | $3,500 | $3,500 |
| Salesperson | 0% | $3,000 | $3,000 | $3,000 | $3,000 | $3,000 | $3,000 | $3,000 | $3,000 | $3,000 | $3,000 | $3,000 | $3,000 |
| 3 Installation/Removal Staff | 0% | $8,400 | $8,400 | $8,400 | $8,400 | $8,400 | $8,400 | $8,400 | $8,400 | $8,400 | $8,400 | $8,400 | $8,400 |
| Other | 0% | $0 | $0 | $0 | $0 | $0 | $0 | $0 | $0 | $0 | $0 | $0 | $0 |
| Total People | 3 | 3 | 3 | 3 | 3 | 3 | 3 | 3 | 3 | 3 | 3 | 3 | |
| Total Payroll | $14,900 | $14,900 | $14,900 | $14,900 | $14,900 | $14,900 | $14,900 | $14,900 | $14,900 | $14,900 | $14,900 | $14,900 | |
| General Assumptions | |||||||||||||
| Month 1 | Month 2 | Month 3 | Month 4 | Month 5 | Month 6 | Month 7 | Month 8 | Month 9 | Month 10 | Month 11 | Month 12 | ||
| Plan Month | 1 | 2 | 3 | 4 | 5 | 6 | 7 | 8 | 9 | 10 | 11 | 12 | |
| Current Interest Rate | 10.00% | 10.00% | 10.00% | 10.00% | 10.00% | 10.00% | 10.00% | 10.00% | 10.00% | 10.00% | 10.00% | 10.00% | |
| Long-term Interest Rate | 10.00% | 10.00% | 10.00% | 10.00% | 10.00% | 10.00% | 10.00% | 10.00% | 10.00% | 10.00% | 10.00% | 10.00% | |
| Tax Rate | 30.00% | 30.00% | 30.00% | 30.00% | 30.00% | 30.00% | 30.00% | 30.00% | 30.00% | 30.00% | 30.00% | 30.00% | |
| Other | 0 | 0 | 0 | 0 | 0 | 0 | 0 | 0 | 0 | 0 | 0 | 0 | |
| Pro Forma Profit and Loss | |||||||||||||
| Month 1 | Month 2 | Month 3 | Month 4 | Month 5 | Month 6 | Month 7 | Month 8 | Month 9 | Month 10 | Month 11 | Month 12 | ||
| Sales | $19,000 | $25,000 | $31,000 | $57,000 | $70,000 | $63,000 | $40,000 | $39,000 | $13,000 | $10,000 | $10,000 | $39,000 | |
| Direct Cost of Sales | $8,500 | $11,250 | $13,500 | $26,000 | $31,000 | $27,500 | $18,250 | $17,500 | $5,500 | $4,000 | $4,000 | $16,250 | |
| Other Production Expenses | $0 | $0 | $0 | $0 | $0 | $0 | $0 | $0 | $0 | $0 | $0 | $0 | |
| Total Cost of Sales | $8,500 | $11,250 | $13,500 | $26,000 | $31,000 | $27,500 | $18,250 | $17,500 | $5,500 | $4,000 | $4,000 | $16,250 | |
| Gross Margin | $10,500 | $13,750 | $17,500 | $31,000 | $39,000 | $35,500 | $21,750 | $21,500 | $7,500 | $6,000 | $6,000 | $22,750 | |
| Gross Margin % | 55.26% | 55.00% | 56.45% | 54.39% | 55.71% | 56.35% | 54.37% | 55.13% | 57.69% | 60.00% | 60.00% | 58.33% | |
| Expenses | |||||||||||||
| Payroll | $14,900 | $14,900 | $14,900 | $14,900 | $14,900 | $14,900 | $14,900 | $14,900 | $14,900 | $14,900 | $14,900 | $14,900 | |
| Sales and Marketing and Other Expenses | $1,000 | $1,000 | $1,000 | $1,000 | $1,000 | $1,000 | $1,000 | $1,000 | $1,000 | $1,000 | $1,000 | $1,000 | |
| Depreciation | $738 | $738 | $738 | $738 | $738 | $738 | $738 | $738 | $738 | $738 | $738 | $738 | |
| Leased Equipment | $2,500 | $2,500 | $2,500 | $2,500 | $2,500 | $2,500 | $2,500 | $2,500 | $2,500 | $2,500 | $2,500 | $2,500 | |
| Utilities | $200 | $200 | $200 | $200 | $200 | $200 | $200 | $200 | $200 | $0 | $0 | $0 | |
| Insurance | $200 | $200 | $200 | $200 | $200 | $200 | $200 | $200 | $200 | $200 | $200 | $200 | |
| Rent | $1,000 | $1,000 | $1,000 | $1,000 | $1,000 | $1,000 | $1,000 | $1,000 | $1,000 | $1,000 | $1,000 | $1,000 | |
| Payroll Taxes | 15% | $2,235 | $2,235 | $2,235 | $2,235 | $2,235 | $2,235 | $2,235 | $2,235 | $2,235 | $2,235 | $2,235 | $2,235 |
| Other | $0 | $0 | $0 | $0 | $0 | $0 | $0 | $0 | $0 | $0 | $0 | $0 | |
| Total Operating Expenses | $22,773 | $22,773 | $22,773 | $22,773 | $22,773 | $22,773 | $22,773 | $22,773 | $22,773 | $22,573 | $22,573 | $22,573 | |
| Profit Before Interest and Taxes | ($12,273) | ($9,023) | ($5,273) | $8,227 | $16,227 | $12,727 | ($1,023) | ($1,273) | ($15,273) | ($16,573) | ($16,573) | $177 | |
| EBITDA | ($11,535) | ($8,285) | ($4,535) | $8,965 | $16,965 | $13,465 | ($285) | ($535) | ($14,535) | ($15,835) | ($15,835) | $915 | |
| Interest Expense | $826 | $819 | $813 | $806 | $799 | $792 | $785 | $778 | $771 | $764 | $757 | $750 | |
| Taxes Incurred | $0 | $0 | $0 | $0 | $0 | $0 | $0 | $0 | $0 | $0 | $0 | $0 | |
| Net Profit | ($13,099) | ($9,842) | ($6,086) | $7,421 | $15,428 | $11,935 | ($1,808) | ($2,051) | ($16,044) | ($17,337) | ($17,330) | ($573) | |
| Net Profit/Sales | -68.94% | -39.37% | -19.63% | 13.02% | 22.04% | 18.94% | -4.52% | -5.26% | -123.41% | -173.37% | -173.30% | -1.47% | |
| Pro Forma Cash Flow | |||||||||||||
| Month 1 | Month 2 | Month 3 | Month 4 | Month 5 | Month 6 | Month 7 | Month 8 | Month 9 | Month 10 | Month 11 | Month 12 | ||
| Cash Received | |||||||||||||
| Cash from Operations | |||||||||||||
| Cash Sales | $9,500 | $12,500 | $15,500 | $28,500 | $35,000 | $31,500 | $20,000 | $19,500 | $6,500 | $5,000 | $5,000 | $19,500 | |
| Cash from Receivables | $0 | $317 | $9,600 | $12,600 | $15,933 | $28,717 | $34,883 | $31,117 | $19,983 | $19,067 | $6,450 | $5,000 | |
| Subtotal Cash from Operations | $9,500 | $12,817 | $25,100 | $41,100 | $50,933 | $60,217 | $54,883 | $50,617 | $26,483 | $24,067 | $11,450 | $24,500 | |
| Additional Cash Received | |||||||||||||
| Sales Tax, VAT, HST/GST Received | 0.00% | $0 | $0 | $0 | $0 | $0 | $0 | $0 | $0 | $0 | $0 | $0 | $0 |
| New Current Borrowing | $0 | $0 | $0 | $0 | $0 | $0 | $0 | $0 | $0 | $0 | $0 | $0 | |
| New Other Liabilities (interest-free) | $0 | $0 | $0 | $0 | $0 | $0 | $0 | $0 | $0 | $0 | $0 | $0 | |
| New Long-term Liabilities | $0 | $0 | $0 | $0 | $0 | $0 | $0 | $0 | $0 | $0 | $0 | $0 | |
| Sales of Other Current Assets | $0 | $0 | $0 | $0 | $0 | $0 | $0 | $0 | $0 | $0 | $0 | $0 | |
| Sales of Long-term Assets | $0 | $0 | $0 | $0 | $0 | $0 | $0 | $0 | $0 | $0 | $0 | $0 | |
| New Investment Received | $0 | $0 | $0 | $0 | $0 | $0 | $0 | $0 | $0 | $0 | $0 | $0 | |
| Subtotal Cash Received | $9,500 | $12,817 | $25,100 | $41,100 | $50,933 | $60,217 | $54,883 | $50,617 | $26,483 | $24,067 | $11,450 | $24,500 | |
| Expenditures | Month 1 | Month 2 | Month 3 | Month 4 | Month 5 | Month 6 | Month 7 | Month 8 | Month 9 | Month 10 | Month 11 | Month 12 | |
| Expenditures from Operations | |||||||||||||
| Cash Spending | $14,900 | $14,900 | $14,900 | $14,900 | $14,900 | $14,900 | $14,900 | $14,900 | $14,900 | $14,900 | $14,900 | $14,900 | |
| Bill Payments | $860 | $25,692 | $22,286 | $24,715 | $47,582 | $44,005 | $31,057 | $16,281 | $24,032 | $7,899 | $7,699 | $8,638 | |
| Subtotal Spent on Operations | $15,760 | $40,592 | $37,186 | $39,615 | $62,482 | $58,905 | $45,957 | $31,181 | $38,932 | $22,799 | $22,599 | $23,538 | |
| Additional Cash Spent | |||||||||||||
| Sales Tax, VAT, HST/GST Paid Out | $0 | $0 | $0 | $0 | $0 | $0 | $0 | $0 | $0 | $0 | $0 | $0 | |
| Principal Repayment of Current Borrowing | $0 | $0 | $0 | $0 | $0 | $0 | $0 | $0 | $0 | $0 | $0 | $0 | |
| Other Liabilities Principal Repayment | $0 | $0 | $0 | $0 | $0 | $0 | $0 | $0 | $0 | $0 | $0 | $0 | |
| Long-term Liabilities Principal Repayment | $833 | $833 | $833 | $833 | $833 | $833 | $833 | $833 | $833 | $833 | $833 | $833 | |
| Purchase Other Current Assets | $0 | $0 | $0 | $0 | $0 | $0 | $0 | $0 | $0 | $0 | $0 | $0 | |
| Purchase Long-term Assets | $0 | $0 | $0 | $0 | $0 | $0 | $0 | $0 | $0 | $0 | $0 | $0 | |
| Dividends | $0 | $0 | $0 | $0 | $0 | $0 | $0 | $0 | $0 | $0 | $0 | $0 | |
| Subtotal Cash Spent | $16,593 | $41,425 | $38,019 | $40,448 | $63,315 | $59,738 | $46,790 | $32,014 | $39,765 | $23,632 | $23,432 | $24,371 | |
| Net Cash Flow | ($7,093) | ($28,608) | ($12,919) | $652 | ($12,382) | $479 | $8,093 | $18,602 | ($13,281) | $435 | ($11,982) | $129 | |
| Cash Balance | $73,707 | $45,098 | $32,179 | $32,832 | $20,450 | $20,929 | $29,022 | $47,624 | $34,343 | $34,777 | $22,796 | $22,925 | |
| Pro Forma Balance Sheet | |||||||||||||
| Month 1 | Month 2 | Month 3 | Month 4 | Month 5 | Month 6 | Month 7 | Month 8 | Month 9 | Month 10 | Month 11 | Month 12 | ||
| Assets | Starting Balances | ||||||||||||
| Current Assets | |||||||||||||
| Cash | $80,800 | $73,707 | $45,098 | $32,179 | $32,832 | $20,450 | $20,929 | $29,022 | $47,624 | $34,343 | $34,777 | $22,796 | $22,925 |
| Accounts Receivable | $0 | $9,500 | $21,683 | $27,583 | $43,483 | $62,550 | $65,333 | $50,450 | $38,833 | $25,350 | $11,283 | $9,833 | $24,333 |
| Inventory | $0 | $9,350 | $12,375 | $14,850 | $28,600 | $34,100 | $30,250 | $20,075 | $19,250 | $13,750 | $9,750 | $5,750 | $17,875 |
| Other Current Assets | $0 | $0 | $0 | $0 | $0 | $0 | $0 | $0 | $0 | $0 | $0 | $0 | $0 |
| Total Current Assets | $80,800 | $92,557 | $79,157 | $74,613 | $104,915 | $117,100 | $116,512 | $99,547 | $105,707 | $73,443 | $55,811 | $38,379 | $65,133 |
| Long-term Assets | |||||||||||||
| Long-term Assets | $30,000 | $30,000 | $30,000 | $30,000 | $30,000 | $30,000 | $30,000 | $30,000 | $30,000 | $30,000 | $30,000 | $30,000 | $30,000 |
| Accumulated Depreciation | $0 | $738 | $1,476 | $2,214 | $2,952 | $3,690 | $4,428 | $5,166 | $5,904 | $6,642 | $7,380 | $8,118 | $8,856 |
| Total Long-term Assets | $30,000 | $29,262 | $28,524 | $27,786 | $27,048 | $26,310 | $25,572 | $24,834 | $24,096 | $23,358 | $22,620 | $21,882 | $21,144 |
| Total Assets | $110,800 | $121,819 | $107,681 | $102,399 | $131,963 | $143,410 | $142,084 | $124,381 | $129,803 | $96,801 | $78,431 | $60,261 | $86,277 |
| Liabilities and Capital | Month 1 | Month 2 | Month 3 | Month 4 | Month 5 | Month 6 | Month 7 | Month 8 | Month 9 | Month 10 | Month 11 | Month 12 | |
| Current Liabilities | |||||||||||||
| Accounts Payable | $0 | $24,951 | $21,488 | $23,125 | $46,101 | $42,953 | $30,524 | $15,462 | $23,768 | $7,642 | $7,442 | $7,436 | $34,858 |
| Current Borrowing | $0 | $0 | $0 | $0 | $0 | $0 | $0 | $0 | $0 | $0 | $0 | $0 | $0 |
| Other Current Liabilities | $0 | $0 | $0 | $0 | $0 | $0 | $0 | $0 | $0 | $0 | $0 | $0 | $0 |
| Subtotal Current Liabilities | $0 | $24,951 | $21,488 | $23,125 | $46,101 | $42,953 | $30,524 | $15,462 | $23,768 | $7,642 | $7,442 | $7,436 | $34,858 |
| Long-term Liabilities | $100,000 | $99,167 | $98,334 | $97,501 | $96,668 | $95,835 | $95,002 | $94,169 | $93,336 | $92,503 | $91,670 | $90,837 | $90,004 |
| Total Liabilities | $100,000 | $124,118 | $119,822 | $120,626 | $142,769 | $138,788 | $125,526 | $109,631 | $117,104 | $100,145 | $99,112 | $98,273 | $124,862 |
| Paid-in Capital | $110,000 | $110,000 | $110,000 | $110,000 | $110,000 | $110,000 | $110,000 | $110,000 | $110,000 | $110,000 | $110,000 | $110,000 | $110,000 |
| Retained Earnings | ($99,200) | ($99,200) | ($99,200) | ($99,200) | ($99,200) | ($99,200) | ($99,200) | ($99,200) | ($99,200) | ($99,200) | ($99,200) | ($99,200) | ($99,200) |
| Earnings | $0 | ($13,099) | ($22,942) | ($29,027) | ($21,606) | ($6,178) | $5,758 | $3,950 | $1,899 | ($14,145) | ($31,482) | ($48,812) | ($49,385) |
| Total Capital | $10,800 | ($2,299) | ($12,142) | ($18,227) | ($10,806) | $4,622 | $16,558 | $14,750 | $12,699 | ($3,345) | ($20,682) | ($38,012) | ($38,585) |
| Total Liabilities and Capital | $110,800 | $121,819 | $107,681 | $102,399 | $131,963 | $143,410 | $142,084 | $124,381 | $129,803 | $96,801 | $78,431 | $60,261 | $86,277 |
| Net Worth | $10,800 | ($2,299) | ($12,142) | ($18,227) | ($10,806) | $4,622 | $16,558 | $14,750 | $12,699 | ($3,345) | ($20,682) | ($38,012) | ($38,585) |

