
Advanced Linguistic Pontificators
Executive Summary
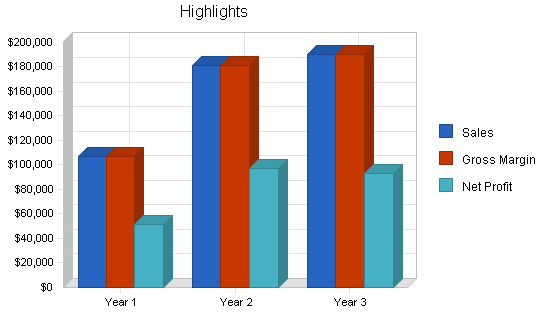
Advanced Linguistic Pontificators is a leading seminar and training program company led by best-selling author Daug Matisim. Advanced Linguistic Pontificators will be targeting medium- and large-size companies/corporations. Pontificators will quickly reach profitability and achieve $79,000 of net profit by year two.
Services
Advanced Linguistic Pontificators will provide medium- to large-size companies with training programs and seminars covering the subjects of advanced reading, stress management, and time management. The advanced reading course will teach speed reading with increased comprehension and memory. Stress management will teach techniques to better deal with stress, and time management will teach methods to become more efficient with the limited amount of time that we all have. The subjects will be taught in either seminar format or training program format. The seminar format is a presentation that concentrates on a specific topic. For the seminars, the audience just observes. A training program is like a seminar except the attendees participate in the entire process.
Marketing
Advanced Linguistic Pontificators will utilize a three-prong strategy to generate a 15% increase in clients each year. The first prong is the use of free public seminars. The public seminars are an excellent method of bringing together a diverse crowd of people that would not have otherwise heard of Pontificators before. The second prong is the dissemination of printed material and the promotion of Daug’s published books. The last prong is the use of networking and word of mouth advertising. Daug recognizes the “small universe” of seminars and training programs and will leverage this element to generate significant business from network contacts.
Management
Daug Matism is the organization and an expert in the field he teaches. He has written two best-selling topical books, “Read Fast, Comprehend More, Remember Lots, and Ignore the Fluff,” and Efficiency Gains in Time and Stress Management: Why the Snail is Faster than the Hare.” Having published in the area that he teaches gives Daug instant respect and notoriety. This expert level of knowledge is based on a foundation of a communications degree as well as a Master in Education. In addition to this incredible C.V., Daug is bubbling with enthusiasm that is contagious to the various seminar participants.
Advanced Linguistic Pontificators will fully utilize Daug’s expert knowledge and notoriety to take the seminar company to profitability. Pontificators has conservatively forecasted sales of $181,000 by year two.
1.1 Objectives
The objectives for the first three years of operation include:
- To create a service-based company whose primary goal is to exceed customer’s expectations.
- The utilization of Advanced Linguistic Pontificators in at least five of the top 100 companies as ranked by Forbes Magazine.
- To increase the number of clients by 15% per year.
- To develop a sustainable home business, surviving off of its own cash flow.
1.2 Mission
Advanced Linguistic Pontificators’ mission is to provide companies with high-quality training seminars. We exist to attract and maintain customers. When we adhere to this maxim, everything else will fall into place. Our services will exceed the expectations of our customers.
Company Summary
Advanced Linguistic Pontificators, based in Portland, OR, offers training programs and seminars for medium to large corporations. The programs are based on advanced reading, stress management, and time management. All programs are presented by Daug Matisim, an expert in those fields. While the office of Advanced Linguistic Pontificators will be located in Daug’s home, the seminars and programs will take place around the country.
The business is expected to reach profitability early on.
2.1 Company Ownership
Advanced Linguistic Pontificators will be an Oregon corporation owned by Daug Matisim.
2.2 Start-up Summary
Advanced Linguistic Pontificators will incur the following start-up costs:
- Desk, chair, filing cabinet.
- Computer (including printer, and CD-RW) with Internet access.
- Fax machine, copier.
- Pager and cell phone.
- Laptop computer.
- LCD computer projector.
- Microsoft Office Suite and QuickBooks Pro.
- Additional land phone line.
Please note that all items that are assets to be used for more than one year will be considered a long-term asset and will be depreciated using the straight-line method.

| Start-up | |
| Requirements | |
| Start-up Expenses | |
| Legal | $500 |
| Stationery etc. | $300 |
| Brochures | $300 |
| Consultants | $500 |
| Web development costs | $1,000 |
| Rent | $0 |
| Research and development | $0 |
| Expensed equipment | $0 |
| Other | $0 |
| Total Start-up Expenses | $2,600 |
| Start-up Assets | |
| Cash Required | $7,900 |
| Other Current Assets | $0 |
| Long-term Assets | $11,500 |
| Total Assets | $19,400 |
| Total Requirements | $22,000 |
| Start-up Funding | |
| Start-up Expenses to Fund | $2,600 |
| Start-up Assets to Fund | $19,400 |
| Total Funding Required | $22,000 |
| Assets | |
| Non-cash Assets from Start-up | $11,500 |
| Cash Requirements from Start-up | $7,900 |
| Additional Cash Raised | $0 |
| Cash Balance on Starting Date | $7,900 |
| Total Assets | $19,400 |
| Liabilities and Capital | |
| Liabilities | |
| Current Borrowing | $0 |
| Long-term Liabilities | $0 |
| Accounts Payable (Outstanding Bills) | $0 |
| Other Current Liabilities (interest-free) | $0 |
| Total Liabilities | $0 |
| Capital | |
| Planned Investment | |
| Daug | $22,000 |
| Investor 2 | $0 |
| Other | $0 |
| Additional Investment Requirement | $0 |
| Total Planned Investment | $22,000 |
| Loss at Start-up (Start-up Expenses) | ($2,600) |
| Total Capital | $19,400 |
| Total Capital and Liabilities | $19,400 |
| Total Funding | $22,000 |
Services
Advanced Linguistic Pontificators will provide medium- to large-size companies with training programs and seminars covering the subjects of advanced reading, stress management, and time management. The advanced reading course will teach speed reading with increased comprehension and memory. Stress management will teach techniques to better deal with stress, and time management will teach methods to become more efficient with the limited amount of time that we all have.
The subjects will be taught in either seminar format or training program format. The seminar format is a presentation that concentrates on a specific topic. For the seminars, the audience just observe. A training program is like a seminar except the attendees participate in the entire process.
Additionally, Daug will offer seminars to the public. This will not be a targeted segment, but will be used to increase awareness of Advanced Linguistic Pontificators to drum up future business.
Market Analysis Summary
Advanced Linguistic Pontificators’ market is Corporate America. The Pontificators will be targeting medium- and large-size companies who typically have a steady need for seminars and training programs. Advanced Linguistic Pontificators will reach these customers through public seminars, word-of-mouth referrals, and through recognition of expertise because of publications on the subject.
4.1 Market Segmentation
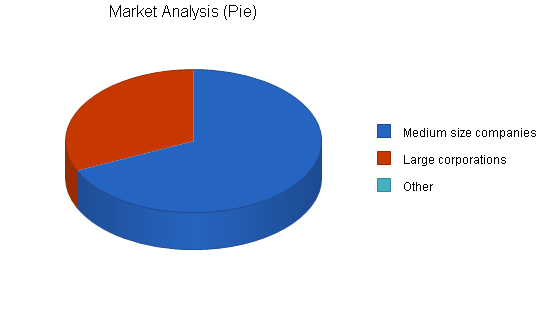
Advanced Linguistic Pontificators is targeting two separate segments:
- Large corporations (100< employees): typically purchases training seminars through specific divisions in the company. Usually a specific manager will have money in their budget and they will choose to have their department trained.
- Medium size companies (100> employees): typically purchases the training seminars through the HR manager or the training manager. Medium-size companies will often have the training applied to the entire organization, not just a certain section of the company.
These segments are good customers because companies of these sizes to have earmarked money for training. These companies recognize the value that they hold in intellectual capital and the need for future investments to maintain the intellectual equity. This recognition of value in training makes them ideal customers. Economic downturns do not seem to effect business from these sources because of the recognition that it is more cost effective to have training done by a third party then to try to have a solution crafted in-house.
| Market Analysis | |||||||
| Year 1 | Year 2 | Year 3 | Year 4 | Year 5 | |||
| Potential Customers | Growth | CAGR | |||||
| Medium size companies | 10% | 5,687 | 6,256 | 6,882 | 7,570 | 8,327 | 10.00% |
| Large corporations | 9% | 2,654 | 2,893 | 3,153 | 3,437 | 3,746 | 9.00% |
| Other | 0% | 0 | 0 | 0 | 0 | 0 | 0.00% |
| Total | 9.69% | 8,341 | 9,149 | 10,035 | 11,007 | 12,073 | 9.69% |
4.2 Target Market Segment Strategy
Advanced Linguistic Pontificators has a three part strategy for targeting the two chosen segments. The first part is through public seminars. A public seminar is a presentation on a subject that is offered to the public. They are typically held in a library or some other public building. While public seminars are not big money makers (and sometimes you will lose money), they bring together a diverse audience to view the seminar. This is quite valuable because within the diverse crowd are people that work in companies that would would otherwise have never heard about Advanced Linguistic Pontificators. It becomes a wonderful advertising tool.

The second way the Pontificators will reach their target market is through visibility of printed material, specifically books. Daug has published two books, one on advanced reading, the other on stress and time management. Having the speaker published adds invaluable amounts of credibility and authenticity. These books are typically toward managers so it is not unusual that a manager will have read the book and then become inspired into having the author come and provide a training session for the the company.
The last method of reaching the target market is word of mouth. Although the industry of training programs and seminars is large, those that are good and concentrate on certain areas form a group of well known service providers. This is quite intuitive. The experts in the field rise to the top and people that are in the “know” are familiar with these people. Word of mouth marketing is incredibly efficient once you have established yourself as one of the best.
4.3 Service Business Analysis
There are many different competitors in this space:
- Seminar production companies that act only as producers of the events, they do not make the actual presentation. These companies typically have a list of different presenters that they use.
- Independent seminar presenters.
- Independent training program presenters.
- Both presenter and promoter–just like Advanced Linguistic Pontificators.
The competition is on a national scale. Being local is insignificant in this industry. Companies will fly in the speaker from wherever they are in the country.
Buying habits are based on word-of-mouth referrals, reputation, topic/skill needed, availability, etc.
Strategy and Implementation Summary
Advanced Linguistic Pontificators will win sales by virtue of their service/product, in essence the product will speak for itself. Daug Matisim is an expert in the field of advanced reading and time and stress management. This expertise provides Pontificators a competitive advantage. Prospective customers will be able to get a sampling of Daug’s work from him book, from excerpts of his writing, or excerpts of his presentations via streaming media from his website.
5.1 Sales Strategy
Advanced Linguistic Pontificators’ sales strategy is relatively straight forward. Let the customer see part of a presentation in addition to the information contained in Daug’s book and the product/service will sell it self. The customer will see examples of Daug’s work through three avenues.
- Purchase a copy of Daug’s book.
- Receive an excerpt of the book from Advanced Linguistic Pontificators office.
- View an example of one of Daug’s presentations via streaming media from the Pontificators’ website.
These examples of Daug’s work will speak for themselves. Once the customer is interested they would only need to contact the office and determine availability, and set up an event.
5.1.1 Sales Forecast
The first month will be used to set up the office and schedule public seminars for month two. There will be some sales activity during months three through seven. Starting with month eight, things will begin to pick up nicely as word gets out that Daug is on the circuit.

| Sales Forecast | |||
| Year 1 | Year 2 | Year 3 | |
| Sales | |||
| Medium-size companies | $49,925 | $84,000 | $90,000 |
| Large corporations | $57,200 | $97,000 | $100,000 |
| Total Sales | $107,125 | $181,000 | $190,000 |
| Direct Cost of Sales | Year 1 | Year 2 | Year 3 |
| Medium-size companies | $0 | $0 | $0 |
| Large corporations | $0 | $0 | $0 |
| Subtotal Direct Cost of Sales | $0 | $0 | $0 |
5.2 Competitive Edge
Advanced Linguistic Pontificators’ competitive edge is simply expertise. Daug is a nationally recognized expert in the fields that he presents. Much of the recognition was derived through the publication of his books. As an expert and an engaging presenter/trainer, Daug is able to offer presentations and training sessions that leave customers with the feeling that they’ve learned a tremendous amount of information and they cannot wait to sign up for another one.
5.3 Milestones
Advanced Linguistic Pontificators will have several milestones early on:
- Business plan completion. This will be done as a road map for the organization. While we do not need a business plan to raise capital, it will be an indispensable tool for the ongoing performance and improvement of the company.
- Set up office.
- Finish the fifth public seminar.
- Finish the tenth seminar/training program.
- Profit exceeding $50,000.
| Milestones | |||||
| Milestone | Start Date | End Date | Budget | Manager | Department |
| Business plan completion | 1/1/2001 | 2/1/2001 | $0 | ABC | Marketing |
| Set up office | 3/1/1999 | 2/1/2001 | $0 | ABC | Department |
| Finish the fifth public seminar | 2/1/2001 | 3/1/2001 | $0 | ABC | Department |
| Finish the tenth seminar/ training program | 2/1/2001 | 5/1/2001 | $0 | ABC | Department |
| Profit exceeding $50,000 | 1/1/2001 | 3/1/2002 | $0 | ABC | Department |
| Totals | $0 | ||||
Management Summary
Advanced Linguistic Pontificators is owned and operated by Daug Matisim. Daug was a degree in communications from Reed College. Following college, Daug pursued his Master’s in Education from the University of California, Berkeley. Following graduate school Daug moved back to Oregon to begin working on his first of two books. The first book, “Read Fast, Comprehend More, Remember Lots, and Ignore the Fluff” was a top seller in the market of advanced reading for eleven straight months. This book brought Daug notoriety and was the catalyst for his second book “Efficiency Gains in Time and Stress Management: Why the Snail is Faster Than the Hare.”
After completing the books and spending five months on the road promoting them, Daug decided he needed a change in his life. He moved down to Costa Rica for two months to develop a comprehensive seminar and training program offering. Once completed, he began Advanced Linguistic Pontificators.
6.1 Personnel Plan
Advanced Linguistic Pontificators will be a one man show. Daug will be responsible for arranging and performing all seminars. Things such as PowerPoint presentations and travel arrangements will be outsourced and the client will cover the costs of all travel arrangements.
| Personnel Plan | |||
| Year 1 | Year 2 | Year 3 | |
| Daug Matism | $24,000 | $36,000 | $50,000 |
| Other | $0 | $0 | $0 |
| Total People | 0 | 0 | 0 |
| Total Payroll | $24,000 | $36,000 | $50,000 |
Financial Plan
The following sections will outline the important financial data.
7.1 Important Assumptions
The following table details important financial assumptions for Advanced Linguistic Pontificators.
| General Assumptions | |||
| Year 1 | Year 2 | Year 3 | |
| Plan Month | 1 | 2 | 3 |
| Current Interest Rate | 10.00% | 10.00% | 10.00% |
| Long-term Interest Rate | 10.00% | 10.00% | 10.00% |
| Tax Rate | 25.42% | 25.00% | 25.42% |
| Other | 0 | 0 | 0 |
7.2 Projected Cash Flow
The following chart and table will indicate projected cash flow.

| Pro Forma Cash Flow | |||
| Year 1 | Year 2 | Year 3 | |
| Cash Received | |||
| Cash from Operations | |||
| Cash Sales | $107,125 | $181,000 | $190,000 |
| Subtotal Cash from Operations | $107,125 | $181,000 | $190,000 |
| Additional Cash Received | |||
| Sales Tax, VAT, HST/GST Received | $0 | $0 | $0 |
| New Current Borrowing | $0 | $0 | $0 |
| New Other Liabilities (interest-free) | $0 | $0 | $0 |
| New Long-term Liabilities | $0 | $0 | $0 |
| Sales of Other Current Assets | $0 | $0 | $0 |
| Sales of Long-term Assets | $0 | $0 | $0 |
| New Investment Received | $0 | $0 | $0 |
| Subtotal Cash Received | $107,125 | $181,000 | $190,000 |
| Expenditures | Year 1 | Year 2 | Year 3 |
| Expenditures from Operations | |||
| Cash Spending | $24,000 | $36,000 | $50,000 |
| Bill Payments | $23,153 | $45,002 | $43,397 |
| Subtotal Spent on Operations | $47,153 | $81,002 | $93,397 |
| Additional Cash Spent | |||
| Sales Tax, VAT, HST/GST Paid Out | $0 | $0 | $0 |
| Principal Repayment of Current Borrowing | $0 | $0 | $0 |
| Other Liabilities Principal Repayment | $0 | $0 | $0 |
| Long-term Liabilities Principal Repayment | $0 | $0 | $0 |
| Purchase Other Current Assets | $0 | $0 | $0 |
| Purchase Long-term Assets | $0 | $0 | $0 |
| Dividends | $0 | $0 | $0 |
| Subtotal Cash Spent | $47,153 | $81,002 | $93,397 |
| Net Cash Flow | $59,972 | $99,998 | $96,603 |
| Cash Balance | $67,872 | $167,869 | $264,473 |
7.3 Break-even Analysis
The Break-even Analysis is shown below.

| Break-even Analysis | |
| Monthly Revenue Break-even | $3,211 |
| Assumptions: | |
| Average Percent Variable Cost | 0% |
| Estimated Monthly Fixed Cost | $3,211 |
7.4 Projected Profit and Loss
The following table will indicate projected profit and loss.


| Pro Forma Profit and Loss | |||
| Year 1 | Year 2 | Year 3 | |
| Sales | $107,125 | $181,000 | $190,000 |
| Direct Cost of Sales | $0 | $0 | $0 |
| Other | $0 | $0 | $0 |
| Total Cost of Sales | $0 | $0 | $0 |
| Gross Margin | $107,125 | $181,000 | $190,000 |
| Gross Margin % | 100.00% | 100.00% | 100.00% |
| Expenses | |||
| Payroll | $24,000 | $36,000 | $50,000 |
| Sales and Marketing and Other Expenses | $6,800 | $7,800 | $7,800 |
| Depreciation | $3,828 | $3,828 | $3,828 |
| Leased Equipment | $0 | $0 | $0 |
| Utilities | $2,400 | $2,400 | $2,400 |
| Insurance | $1,500 | $1,500 | $1,500 |
| Rent | $0 | $0 | $0 |
| Payroll Taxes | $0 | $0 | $0 |
| Other | $0 | $0 | $0 |
| Total Operating Expenses | $38,528 | $51,528 | $65,528 |
| Profit Before Interest and Taxes | $68,597 | $129,472 | $124,472 |
| EBITDA | $72,425 | $133,300 | $128,300 |
| Interest Expense | $0 | $0 | $0 |
| Taxes Incurred | $17,010 | $32,368 | $31,637 |
| Net Profit | $51,587 | $97,104 | $92,835 |
| Net Profit/Sales | 48.16% | 53.65% | 48.86% |
7.5 Projected Balance Sheet
The following table will indicate the projected balance sheet.
| Pro Forma Balance Sheet | |||
| Year 1 | Year 2 | Year 3 | |
| Assets | |||
| Current Assets | |||
| Cash | $67,872 | $167,869 | $264,473 |
| Other Current Assets | $0 | $0 | $0 |
| Total Current Assets | $67,872 | $167,869 | $264,473 |
| Long-term Assets | |||
| Long-term Assets | $11,500 | $11,500 | $11,500 |
| Accumulated Depreciation | $3,828 | $7,656 | $11,484 |
| Total Long-term Assets | $7,672 | $3,844 | $16 |
| Total Assets | $75,544 | $171,713 | $264,489 |
| Liabilities and Capital | Year 1 | Year 2 | Year 3 |
| Current Liabilities | |||
| Accounts Payable | $4,556 | $3,622 | $3,562 |
| Current Borrowing | $0 | $0 | $0 |
| Other Current Liabilities | $0 | $0 | $0 |
| Subtotal Current Liabilities | $4,556 | $3,622 | $3,562 |
| Long-term Liabilities | $0 | $0 | $0 |
| Total Liabilities | $4,556 | $3,622 | $3,562 |
| Paid-in Capital | $22,000 | $22,000 | $22,000 |
| Retained Earnings | ($2,600) | $48,987 | $146,091 |
| Earnings | $51,587 | $97,104 | $92,835 |
| Total Capital | $70,987 | $168,091 | $260,927 |
| Total Liabilities and Capital | $75,544 | $171,713 | $264,489 |
| Net Worth | $70,987 | $168,091 | $260,927 |
7.6 Business Ratios
The following table outlines some of the more important ratios from the Professional and Management Development Training industry. The final column, Industry Profile, details specific ratios based on the industry as it is classified by the NAICS code, 611430.
| Ratio Analysis | ||||
| Year 1 | Year 2 | Year 3 | Industry Profile | |
| Sales Growth | 0.00% | 68.96% | 4.97% | 9.50% |
| Percent of Total Assets | ||||
| Other Current Assets | 0.00% | 0.00% | 0.00% | 45.60% |
| Total Current Assets | 89.84% | 97.76% | 99.99% | 62.40% |
| Long-term Assets | 10.16% | 2.24% | 0.01% | 37.60% |
| Total Assets | 100.00% | 100.00% | 100.00% | 100.00% |
| Current Liabilities | 6.03% | 2.11% | 1.35% | 43.30% |
| Long-term Liabilities | 0.00% | 0.00% | 0.00% | 17.30% |
| Total Liabilities | 6.03% | 2.11% | 1.35% | 60.60% |
| Net Worth | 93.97% | 97.89% | 98.65% | 39.40% |
| Percent of Sales | ||||
| Sales | 100.00% | 100.00% | 100.00% | 100.00% |
| Gross Margin | 100.00% | 100.00% | 100.00% | 0.00% |
| Selling, General & Administrative Expenses | 68.78% | 56.30% | 62.71% | 73.80% |
| Advertising Expenses | 1.68% | 0.99% | 0.95% | 5.00% |
| Profit Before Interest and Taxes | 64.03% | 71.53% | 65.51% | 3.20% |
| Main Ratios | ||||
| Current | 14.90 | 46.35 | 74.25 | 1.33 |
| Quick | 14.90 | 46.35 | 74.25 | 1.11 |
| Total Debt to Total Assets | 6.03% | 2.11% | 1.35% | 60.60% |
| Pre-tax Return on Net Worth | 96.63% | 77.02% | 47.70% | 5.50% |
| Pre-tax Return on Assets | 90.80% | 75.40% | 47.06% | 14.00% |
| Additional Ratios | Year 1 | Year 2 | Year 3 | |
| Net Profit Margin | 48.16% | 53.65% | 48.86% | n.a |
| Return on Equity | 72.67% | 57.77% | 35.58% | n.a |
| Activity Ratios | ||||
| Accounts Payable Turnover | 6.08 | 12.17 | 12.17 | n.a |
| Payment Days | 34 | 34 | 30 | n.a |
| Total Asset Turnover | 1.42 | 1.05 | 0.72 | n.a |
| Debt Ratios | ||||
| Debt to Net Worth | 0.06 | 0.02 | 0.01 | n.a |
| Current Liab. to Liab. | 1.00 | 1.00 | 1.00 | n.a |
| Liquidity Ratios | ||||
| Net Working Capital | $63,315 | $164,247 | $260,911 | n.a |
| Interest Coverage | 0.00 | 0.00 | 0.00 | n.a |
| Additional Ratios | ||||
| Assets to Sales | 0.71 | 0.95 | 1.39 | n.a |
| Current Debt/Total Assets | 6% | 2% | 1% | n.a |
| Acid Test | 14.90 | 46.35 | 74.25 | n.a |
| Sales/Net Worth | 1.51 | 1.08 | 0.73 | n.a |
| Dividend Payout | 0.00 | 0.00 | 0.00 | n.a |
Appendix
| Sales Forecast | |||||||||||||
| Month 1 | Month 2 | Month 3 | Month 4 | Month 5 | Month 6 | Month 7 | Month 8 | Month 9 | Month 10 | Month 11 | Month 12 | ||
| Sales | |||||||||||||
| Medium-size companies | 0% | $0 | $0 | $2,000 | $3,500 | $4,000 | $4,100 | $4,200 | $5,200 | $6,000 | $6,500 | $7,025 | $7,400 |
| Large corporations | 0% | $0 | $0 | $2,000 | $4,000 | $5,000 | $4,500 | $4,700 | $6,000 | $7,000 | $7,500 | $8,000 | $8,500 |
| Total Sales | $0 | $0 | $4,000 | $7,500 | $9,000 | $8,600 | $8,900 | $11,200 | $13,000 | $14,000 | $15,025 | $15,900 | |
| Direct Cost of Sales | Month 1 | Month 2 | Month 3 | Month 4 | Month 5 | Month 6 | Month 7 | Month 8 | Month 9 | Month 10 | Month 11 | Month 12 | |
| Medium-size companies | $0 | $0 | $0 | $0 | $0 | $0 | $0 | $0 | $0 | $0 | $0 | $0 | |
| Large corporations | $0 | $0 | $0 | $0 | $0 | $0 | $0 | $0 | $0 | $0 | $0 | $0 | |
| Subtotal Direct Cost of Sales | $0 | $0 | $0 | $0 | $0 | $0 | $0 | $0 | $0 | $0 | $0 | $0 | |
| Personnel Plan | |||||||||||||
| Month 1 | Month 2 | Month 3 | Month 4 | Month 5 | Month 6 | Month 7 | Month 8 | Month 9 | Month 10 | Month 11 | Month 12 | ||
| Daug Matism | 0% | $2,000 | $2,000 | $2,000 | $2,000 | $2,000 | $2,000 | $2,000 | $2,000 | $2,000 | $2,000 | $2,000 | $2,000 |
| Other | 0% | $0 | $0 | $0 | $0 | $0 | $0 | $0 | $0 | $0 | $0 | $0 | $0 |
| Total People | 0 | 0 | 0 | 0 | 0 | 0 | 0 | 0 | 0 | 0 | 0 | 0 | |
| Total Payroll | $2,000 | $2,000 | $2,000 | $2,000 | $2,000 | $2,000 | $2,000 | $2,000 | $2,000 | $2,000 | $2,000 | $2,000 | |
| General Assumptions | |||||||||||||
| Month 1 | Month 2 | Month 3 | Month 4 | Month 5 | Month 6 | Month 7 | Month 8 | Month 9 | Month 10 | Month 11 | Month 12 | ||
| Plan Month | 1 | 2 | 3 | 4 | 5 | 6 | 7 | 8 | 9 | 10 | 11 | 12 | |
| Current Interest Rate | 10.00% | 10.00% | 10.00% | 10.00% | 10.00% | 10.00% | 10.00% | 10.00% | 10.00% | 10.00% | 10.00% | 10.00% | |
| Long-term Interest Rate | 10.00% | 10.00% | 10.00% | 10.00% | 10.00% | 10.00% | 10.00% | 10.00% | 10.00% | 10.00% | 10.00% | 10.00% | |
| Tax Rate | 30.00% | 25.00% | 25.00% | 25.00% | 25.00% | 25.00% | 25.00% | 25.00% | 25.00% | 25.00% | 25.00% | 25.00% | |
| Other | 0 | 0 | 0 | 0 | 0 | 0 | 0 | 0 | 0 | 0 | 0 | 0 | |
| Pro Forma Profit and Loss | |||||||||||||
| Month 1 | Month 2 | Month 3 | Month 4 | Month 5 | Month 6 | Month 7 | Month 8 | Month 9 | Month 10 | Month 11 | Month 12 | ||
| Sales | $0 | $0 | $4,000 | $7,500 | $9,000 | $8,600 | $8,900 | $11,200 | $13,000 | $14,000 | $15,025 | $15,900 | |
| Direct Cost of Sales | $0 | $0 | $0 | $0 | $0 | $0 | $0 | $0 | $0 | $0 | $0 | $0 | |
| Other | $0 | $0 | $0 | $0 | $0 | $0 | $0 | $0 | $0 | $0 | $0 | $0 | |
| Total Cost of Sales | $0 | $0 | $0 | $0 | $0 | $0 | $0 | $0 | $0 | $0 | $0 | $0 | |
| Gross Margin | $0 | $0 | $4,000 | $7,500 | $9,000 | $8,600 | $8,900 | $11,200 | $13,000 | $14,000 | $15,025 | $15,900 | |
| Gross Margin % | 0.00% | 0.00% | 100.00% | 100.00% | 100.00% | 100.00% | 100.00% | 100.00% | 100.00% | 100.00% | 100.00% | 100.00% | |
| Expenses | |||||||||||||
| Payroll | $2,000 | $2,000 | $2,000 | $2,000 | $2,000 | $2,000 | $2,000 | $2,000 | $2,000 | $2,000 | $2,000 | $2,000 | |
| Sales and Marketing and Other Expenses | $150 | $150 | $650 | $650 | $650 | $650 | $650 | $650 | $650 | $650 | $650 | $650 | |
| Depreciation | $319 | $319 | $319 | $319 | $319 | $319 | $319 | $319 | $319 | $319 | $319 | $319 | |
| Leased Equipment | $0 | $0 | $0 | $0 | $0 | $0 | $0 | $0 | $0 | $0 | $0 | $0 | |
| Utilities | $200 | $200 | $200 | $200 | $200 | $200 | $200 | $200 | $200 | $200 | $200 | $200 | |
| Insurance | $125 | $125 | $125 | $125 | $125 | $125 | $125 | $125 | $125 | $125 | $125 | $125 | |
| Rent | $0 | $0 | $0 | $0 | $0 | $0 | $0 | $0 | $0 | $0 | $0 | $0 | |
| Payroll Taxes | 15% | $0 | $0 | $0 | $0 | $0 | $0 | $0 | $0 | $0 | $0 | $0 | $0 |
| Other | $0 | $0 | $0 | $0 | $0 | $0 | $0 | $0 | $0 | $0 | $0 | $0 | |
| Total Operating Expenses | $2,794 | $2,794 | $3,294 | $3,294 | $3,294 | $3,294 | $3,294 | $3,294 | $3,294 | $3,294 | $3,294 | $3,294 | |
| Profit Before Interest and Taxes | ($2,794) | ($2,794) | $706 | $4,206 | $5,706 | $5,306 | $5,606 | $7,906 | $9,706 | $10,706 | $11,731 | $12,606 | |
| EBITDA | ($2,475) | ($2,475) | $1,025 | $4,525 | $6,025 | $5,625 | $5,925 | $8,225 | $10,025 | $11,025 | $12,050 | $12,925 | |
| Interest Expense | $0 | $0 | $0 | $0 | $0 | $0 | $0 | $0 | $0 | $0 | $0 | $0 | |
| Taxes Incurred | ($838) | ($699) | $177 | $1,052 | $1,427 | $1,327 | $1,402 | $1,977 | $2,427 | $2,677 | $2,933 | $3,152 | |
| Net Profit | ($1,956) | ($2,096) | $530 | $3,155 | $4,280 | $3,980 | $4,205 | $5,930 | $7,280 | $8,030 | $8,798 | $9,455 | |
| Net Profit/Sales | 0.00% | 0.00% | 13.24% | 42.06% | 47.55% | 46.27% | 47.24% | 52.94% | 56.00% | 57.35% | 58.56% | 59.46% | |
| Pro Forma Cash Flow | |||||||||||||
| Month 1 | Month 2 | Month 3 | Month 4 | Month 5 | Month 6 | Month 7 | Month 8 | Month 9 | Month 10 | Month 11 | Month 12 | ||
| Cash Received | |||||||||||||
| Cash from Operations | |||||||||||||
| Cash Sales | $0 | $0 | $4,000 | $7,500 | $9,000 | $8,600 | $8,900 | $11,200 | $13,000 | $14,000 | $15,025 | $15,900 | |
| Subtotal Cash from Operations | $0 | $0 | $4,000 | $7,500 | $9,000 | $8,600 | $8,900 | $11,200 | $13,000 | $14,000 | $15,025 | $15,900 | |
| Additional Cash Received | |||||||||||||
| Sales Tax, VAT, HST/GST Received | 0.00% | $0 | $0 | $0 | $0 | $0 | $0 | $0 | $0 | $0 | $0 | $0 | $0 |
| New Current Borrowing | $0 | $0 | $0 | $0 | $0 | $0 | $0 | $0 | $0 | $0 | $0 | $0 | |
| New Other Liabilities (interest-free) | $0 | $0 | $0 | $0 | $0 | $0 | $0 | $0 | $0 | $0 | $0 | $0 | |
| New Long-term Liabilities | $0 | $0 | $0 | $0 | $0 | $0 | $0 | $0 | $0 | $0 | $0 | $0 | |
| Sales of Other Current Assets | $0 | $0 | $0 | $0 | $0 | $0 | $0 | $0 | $0 | $0 | $0 | $0 | |
| Sales of Long-term Assets | $0 | $0 | $0 | $0 | $0 | $0 | $0 | $0 | $0 | $0 | $0 | $0 | |
| New Investment Received | $0 | $0 | $0 | $0 | $0 | $0 | $0 | $0 | $0 | $0 | $0 | $0 | |
| Subtotal Cash Received | $0 | $0 | $4,000 | $7,500 | $9,000 | $8,600 | $8,900 | $11,200 | $13,000 | $14,000 | $15,025 | $15,900 | |
| Expenditures | Month 1 | Month 2 | Month 3 | Month 4 | Month 5 | Month 6 | Month 7 | Month 8 | Month 9 | Month 10 | Month 11 | Month 12 | |
| Expenditures from Operations | |||||||||||||
| Cash Spending | $2,000 | $2,000 | $2,000 | $2,000 | $2,000 | $2,000 | $2,000 | $2,000 | $2,000 | $2,000 | $2,000 | $2,000 | |
| Bill Payments | ($363) | ($575) | ($178) | $1,181 | $2,039 | $2,398 | $2,304 | $2,396 | $2,967 | $3,410 | $3,660 | $3,915 | |
| Subtotal Spent on Operations | $1,637 | $1,425 | $1,822 | $3,181 | $4,039 | $4,398 | $4,304 | $4,396 | $4,967 | $5,410 | $5,660 | $5,915 | |
| Additional Cash Spent | |||||||||||||
| Sales Tax, VAT, HST/GST Paid Out | $0 | $0 | $0 | $0 | $0 | $0 | $0 | $0 | $0 | $0 | $0 | $0 | |
| Principal Repayment of Current Borrowing | $0 | $0 | $0 | $0 | $0 | $0 | $0 | $0 | $0 | $0 | $0 | $0 | |
| Other Liabilities Principal Repayment | $0 | $0 | $0 | $0 | $0 | $0 | $0 | $0 | $0 | $0 | $0 | $0 | |
| Long-term Liabilities Principal Repayment | $0 | $0 | $0 | $0 | $0 | $0 | $0 | $0 | $0 | $0 | $0 | $0 | |
| Purchase Other Current Assets | $0 | $0 | $0 | $0 | $0 | $0 | $0 | $0 | $0 | $0 | $0 | $0 | |
| Purchase Long-term Assets | $0 | $0 | $0 | $0 | $0 | $0 | $0 | $0 | $0 | $0 | $0 | $0 | |
| Dividends | $0 | $0 | $0 | $0 | $0 | $0 | $0 | $0 | $0 | $0 | $0 | $0 | |
| Subtotal Cash Spent | $1,637 | $1,425 | $1,822 | $3,181 | $4,039 | $4,398 | $4,304 | $4,396 | $4,967 | $5,410 | $5,660 | $5,915 | |
| Net Cash Flow | ($1,637) | ($1,425) | $2,178 | $4,319 | $4,961 | $4,202 | $4,596 | $6,804 | $8,034 | $8,590 | $9,365 | $9,985 | |
| Cash Balance | $6,263 | $4,838 | $7,015 | $11,335 | $16,296 | $20,498 | $25,094 | $31,898 | $39,931 | $48,522 | $57,887 | $67,872 | |
| Pro Forma Balance Sheet | |||||||||||||
| Month 1 | Month 2 | Month 3 | Month 4 | Month 5 | Month 6 | Month 7 | Month 8 | Month 9 | Month 10 | Month 11 | Month 12 | ||
| Assets | Starting Balances | ||||||||||||
| Current Assets | |||||||||||||
| Cash | $7,900 | $6,263 | $4,838 | $7,015 | $11,335 | $16,296 | $20,498 | $25,094 | $31,898 | $39,931 | $48,522 | $57,887 | $67,872 |
| Other Current Assets | $0 | $0 | $0 | $0 | $0 | $0 | $0 | $0 | $0 | $0 | $0 | $0 | $0 |
| Total Current Assets | $7,900 | $6,263 | $4,838 | $7,015 | $11,335 | $16,296 | $20,498 | $25,094 | $31,898 | $39,931 | $48,522 | $57,887 | $67,872 |
| Long-term Assets | |||||||||||||
| Long-term Assets | $11,500 | $11,500 | $11,500 | $11,500 | $11,500 | $11,500 | $11,500 | $11,500 | $11,500 | $11,500 | $11,500 | $11,500 | $11,500 |
| Accumulated Depreciation | $0 | $319 | $638 | $957 | $1,276 | $1,595 | $1,914 | $2,233 | $2,552 | $2,871 | $3,190 | $3,509 | $3,828 |
| Total Long-term Assets | $11,500 | $11,181 | $10,862 | $10,543 | $10,224 | $9,905 | $9,586 | $9,267 | $8,948 | $8,629 | $8,310 | $7,991 | $7,672 |
| Total Assets | $19,400 | $17,444 | $15,700 | $17,558 | $21,559 | $26,201 | $30,084 | $34,361 | $40,846 | $48,560 | $56,832 | $65,878 | $75,544 |
| Liabilities and Capital | Month 1 | Month 2 | Month 3 | Month 4 | Month 5 | Month 6 | Month 7 | Month 8 | Month 9 | Month 10 | Month 11 | Month 12 | |
| Current Liabilities | |||||||||||||
| Accounts Payable | $0 | $0 | $351 | $1,680 | $2,526 | $2,889 | $2,792 | $2,864 | $3,420 | $3,855 | $4,097 | $4,345 | $4,556 |
| Current Borrowing | $0 | $0 | $0 | $0 | $0 | $0 | $0 | $0 | $0 | $0 | $0 | $0 | $0 |
| Other Current Liabilities | $0 | $0 | $0 | $0 | $0 | $0 | $0 | $0 | $0 | $0 | $0 | $0 | $0 |
| Subtotal Current Liabilities | $0 | $0 | $351 | $1,680 | $2,526 | $2,889 | $2,792 | $2,864 | $3,420 | $3,855 | $4,097 | $4,345 | $4,556 |
| Long-term Liabilities | $0 | $0 | $0 | $0 | $0 | $0 | $0 | $0 | $0 | $0 | $0 | $0 | $0 |
| Total Liabilities | $0 | $0 | $351 | $1,680 | $2,526 | $2,889 | $2,792 | $2,864 | $3,420 | $3,855 | $4,097 | $4,345 | $4,556 |
| Paid-in Capital | $22,000 | $22,000 | $22,000 | $22,000 | $22,000 | $22,000 | $22,000 | $22,000 | $22,000 | $22,000 | $22,000 | $22,000 | $22,000 |
| Retained Earnings | ($2,600) | ($2,600) | ($2,600) | ($2,600) | ($2,600) | ($2,600) | ($2,600) | ($2,600) | ($2,600) | ($2,600) | ($2,600) | ($2,600) | ($2,600) |
| Earnings | $0 | ($1,956) | ($4,051) | ($3,522) | ($367) | $3,912 | $7,892 | $12,096 | $18,026 | $25,305 | $33,335 | $42,133 | $51,587 |
| Total Capital | $19,400 | $17,444 | $15,349 | $15,878 | $19,033 | $23,312 | $27,292 | $31,496 | $37,426 | $44,705 | $52,735 | $61,533 | $70,987 |
| Total Liabilities and Capital | $19,400 | $17,444 | $15,700 | $17,558 | $21,559 | $26,201 | $30,084 | $34,361 | $40,846 | $48,560 | $56,832 | $65,878 | $75,544 |
| Net Worth | $19,400 | $17,444 | $15,349 | $15,878 | $19,033 | $23,312 | $27,292 | $31,496 | $37,426 | $44,705 | $52,735 | $61,533 | $70,987 |


