
It's Scrappy!
Executive Summary
Storing pictures in a scrapbook–the idea has been around for a long time. Unfortunately, acid and wood by-products used in paper can damage photographs (ever noticed an older photograph that has yellowed and faded?). In recent years new technology in acid-free and lignin-free paper has revolutionized this method of preserving photographs and has made “scrap booking” even more popular as a hobby. Today’s scrap books are creative, colorful, decorated with everything imaginable, and really tell a story…your story. It is an amazing way of preserving and displaying the precious memories that otherwise might fade away in that dusty box of photos under the bed.
The rising interest in scrap books as a hobby can also bring frustration when supplies are not readily available. Local craft stores who don’t specialize in the field may only carry limited inventory. Additionally, store clerks may not have the knowledge or experience to answer questions or explain the different techniques about scrap books.
It’s Scrappy! will focus on providing a wide variety of scrap books supplies at competitive prices. The goal of the owner and her employees will be to stay informed and up to date on the products, tools and techniques used in creating scrap books and to establish in their surrounding community as the one and only stop for scrapper’s needs.

1.1 Keys to Success
Supply Availability: Offering to the customer those supplies which they currently cannot obtain anywhere else locally will make It’s Scrappy! the number one place to purchase or order all of their scrap books supplies.
- Prices: It’s Scrappy! will have competitive prices and will strive to have the lowest pricing for most of the scrap books categories in the local area. We have created method to track pricing of our competitors and compare it to the prices of our suppliers. This will be constantly reviewed and updated to help us achieve our lowest price goal.
- Classes: It’s Scrappy! will offer a wide range of classes to teach customers of all ages and skill levels in the art of scrap books. The staff will stay abreast of the newest scrap books techniques to help customers create memorable scrapbook pages that they can be proud of.
- Page Design: For the customers that don’t have the time to make their own scrap books, It’s Scrappy! will offer special one-on-one consultations to design and produce scrapbook pages especially for them.
- Location: Our store is located in a fast-growing area that will continue grow, with more new businesses opening up on a regular basis. The building is well located, spacious, easily accessible, has ample parking and is very convenient for not only the local community but also for the surrounding areas.
1.2 Mission
The mission of It’s Scrappy! is to to create a pleasant, fun environment to help our customers create scrap books that will solidify their photo memories and preserve them for lifetimes to come.
1.3 Objectives
Focus on customer satisfaction by stocking our store with items they cannot find anywhere in our area along with the items that they can.
- Tracking competitor prices along with our supplier’s prices will allow us to keep our prices slightly lower than the competitors on most of our supplies and draw more customers to our store.
- Keeping on top of the newest trends and techniques in the scrap books world by attending classes and subscribing to magazines.
Company Summary
It’s Scrappy! is a scrapbook supply store that will stock hundreds of different types of products used for this hobby along with the knowledge of where to obtain those hard-to-find items a customer may want that are not part of our regular stock.
It’s Scrappy! will offer weekly classes to our customers to teach them the ongoing techniques used in creating beautiful scrapbook pages to preserve and protect their photographs.
In addition, It’s Scrappy! will provide design and implementation of original scrapbook pages.
2.1 Company Ownership
It’s Scrappy! is a Sole Proprietorship. The owner is investing $20,000 of their own money to start the business.
2.2 Start-up Summary
The primary start-up costs will be for inventory, shelving and Point-of-Sale equipment as well as initial advertising. The owner will invest $20,000.
The following table shows a breakdown of the expected start-up expenses.

| Start-up Funding | |
| Start-up Expenses to Fund | $9,000 |
| Start-up Assets to Fund | $10,000 |
| Total Funding Required | $19,000 |
| Assets | |
| Non-cash Assets from Start-up | $9,500 |
| Cash Requirements from Start-up | $500 |
| Additional Cash Raised | $1,000 |
| Cash Balance on Starting Date | $1,500 |
| Total Assets | $11,000 |
| Liabilities and Capital | |
| Liabilities | |
| Current Borrowing | $0 |
| Long-term Liabilities | $0 |
| Accounts Payable (Outstanding Bills) | $0 |
| Other Current Liabilities (interest-free) | $0 |
| Total Liabilities | $0 |
| Capital | |
| Planned Investment | |
| Owner | $20,000 |
| Other | $0 |
| Additional Investment Requirement | $0 |
| Total Planned Investment | $20,000 |
| Loss at Start-up (Start-up Expenses) | ($9,000) |
| Total Capital | $11,000 |
| Total Capital and Liabilities | $11,000 |
| Total Funding | $20,000 |
| Start-up | |
| Requirements | |
| Start-up Expenses | |
| RENT – TWO MONTHS | $3,000 |
| SHELVING | $2,000 |
| ADVERTISING | $1,500 |
| CASH REGISTER/CREDIT CARD TERMINAL | $900 |
| LEGAL FEES | $300 |
| STAFF TRAINING | $1,000 |
| INSURANCE | $300 |
| OTHER | $0 |
| Total Start-up Expenses | $9,000 |
| Start-up Assets | |
| Cash Required | $500 |
| Start-up Inventory | $7,000 |
| Other Current Assets | $0 |
| Long-term Assets | $2,500 |
| Total Assets | $10,000 |
| Total Requirements | $19,000 |
Products and Services
It’s Scrappy! will continually strive to offer the largest variety of scrap books supplies available to achieve virtually any scrapbook design that the customer has envisioned.
Products
The following is a list of some of the supply categories that will be stocked:
- Photo albums (Post type or three-ring).
- Acid-free and lignin-free papers in many colors, brands and sizes.
- Stickers from various designers and manufacturers.
- Embellishments, including but not limited to brads, snaps, eyelets, fibers, charms, tags and wire products.
- Assorted adhesives, including glue sticks/pens and mounting tapes/squares.
- Appliques such as chalk and walnut stain.
- Books and magazines (for ideas and techniques).
- Cutting tools such as scissors, precision knives, trimmers, circle cutters and scoring blades.
- Die cuts of all shapes and colors (to match many themes).
- Embossing equipment, such as thin metals and tools.
- Organizers, to hold everything from papers to pens and punches to stickers.
- Templates (to help achieve many different kinds of writing fonts).
- Punches in many brands and shapes.
- Pens, pencils and markers of various brands, sizes, and colors.
Services:
It’s Scrappy! will offer these additional services to further complement our products:
- Classes that range from teaching introductory level skills to teaching the newest techniques and showing how to implement them in easy ways.
- Customized page design for the very busy scrapbookers.
Market Analysis Summary
Statistics show that this hobby is primarily enjoyed by women. With the surrounding population totaling 139,750, 71,607 are women. This gives our business an estimated 51% of the total potential market.
The average “scrappers” are women from the age of 20-45. Along with this group, It’s Scrappy! will target the teen and pre-teen market (ages 10-19). With special classes and special discounts on supplies that they can afford, It’s Scrappy! hopes to draw this group into scrapbookers as a hobby. It’s Scrappy! believes this will also service the community by teaching them a craft and showing them how to be proud of what they accomplish. The above-45 age group will also be targeted urging them to pull out those boxes of photos that are never looked at and display them in a manner that they can be cherished and remembered the way they deserve to be. We will use special mailings and class offers to promote our services.

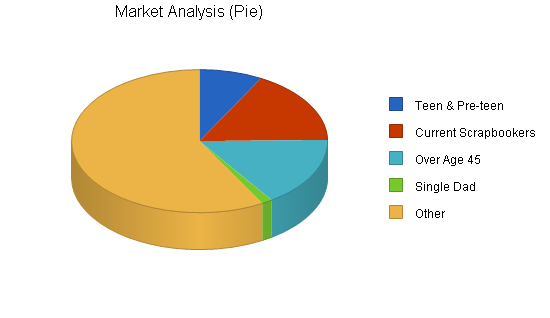
4.1 Market Segmentation
The following groups are most likely to offer the best opportunity for current and new market segmentation:
- Teen and Pre-Teen (ages 10-19)
- Avid scrapbookers (20-45 yr.)
- Over 45 years of age
- Single dads
- Internet customers
The only group currently targeted are the avid scrapbookers. This group already knows the basics of the hobby and what most of the products are used for. However, they are also most likely to want to learn new techniques and to be aware of the latest trends.
| Market Analysis | |||||||
| Year 1 | Year 2 | Year 3 | Year 4 | Year 5 | |||
| Potential Customers | Growth | CAGR | |||||
| Teen & Pre-teen | 10% | 11,030 | 13,236 | 15,883 | 19,060 | 22,872 | 20.00% |
| Current Scrapbookers | 15% | 23,513 | 27,040 | 31,096 | 35,760 | 41,124 | 15.00% |
| Over Age 45 | 20% | 22,072 | 25,383 | 29,190 | 33,569 | 38,604 | 15.00% |
| Single Dad | 5% | 1,943 | 2,040 | 2,142 | 2,249 | 2,361 | 4.99% |
| Other | 2% | 81,192 | 82,816 | 84,472 | 86,161 | 87,884 | 2.00% |
| Total | 8.38% | 139,750 | 150,515 | 162,783 | 176,799 | 192,845 | 8.38% |
4.2 Target Market Segment Strategy
It’s Scrappy! will focus on these significant customer groups:
- Teen and Pre-Teen customers: We plan on staying in touch with this age group on a regular basis by keeping up to date on teen activities going on in the community such as dances and sports activities so we can use this information in special mailings and classes geared for their specific age group. In addition, to help them with their small cash allowances, we will be starting a membership only “Teen Scrappers” club which will give them discounts on supplies.
- Current scrapbookers: We will target these customers by staying up to date on newest scrapbookers trends and techniques to keep these customers informed and to offer classes to demonstrate new techniques and materials.
- Ages 45 and up: This group will be targeted by mailings as well as our special “50+” age discounts for seniors. Many potential customers in this age group have their photographs and memories stored somewhere in a box, or in the “old type” albums that deteriorate photos making them yellow and unrecognizable. Our mailings will bring to their attention how they are currently storing and displaying their photographs, how those methods ruin their photographs over time and what they can do instead to preserve, showcase and enjoy them in a manner that will last a lifetime. Classes and time schedules for classes will be tailored for this group.
- The Single Dad: The single Dad is increasing, and more children are living with their father only on a regular basis. Because photos of our children are a huge part of scrapbookers, we will target these customers with the basics of acid-free albums/glues and papers instead of all the supplies used to create the “storybook” scrapbookers.
- Internet customers: It’s Scrappy! will have a website with information about our location and contact information, with a brief description of our store and the types of supplies we carry. Later we hope to expand this into an online store to make it convenient for customers outside the immediate area to purchase the same supplies we carry in the store.
4.3 Consumer Market Research
THE FOLLOWING SECTION IS INCLUDED AS STATISTICAL BACKGROUND FOR MARKET RESEARCH. THIS INFORMATION WAS NOT INCLUDED WITH THE ORIGINAL SAMPLE PLAN AND IS NOT REFERENCED ANYWHERE ELSE IN THE PLAN.
_______________________________________
The following statistics came from the U.S. Census Bureau and American Demographics:
- Seniors are responsible for 14% of total spending power (approximately $588 billion) with average spending per household of $26,533. Average age is 75.
- Empty Nesters are responsible for 13% of total spending power (approximately $557 billion) with average spending per household of $39,340. Average age is 59.
- Old Baby Boomers are responsible for 24% of total spending power (approximately $1 trillion) with average spending per household of $46,160. Average age is 49.
- Younger Baby Boomers are responsible for 26% of total spending power (approximately $1.1 trillion) with average spending of $45,149. Average age is 40.
- Gen Xers are responsible for 18% of total spending power (approximately 736 billion) with average spending per household of $38,945. Average age is 30.
- Gen Yers are responsible for 5% total spending (approximately $187 billion) with average spending per household of $22,543. Average age is 21.
Strategy and Implementation Summary
The main financial goal for It’s Scrappy! is to increase sales by 5% for years one and two. This will be accomplished through regular advertising and mailings to our target markets, plus monitoring of our competitor’s pricing and our supplier’s costs to help maintain a competitive edge.
5.1 Competitive Edge
Stock all standard exempt supplies in store and provide reasonable pricing for special order items through our catalog.
- Have our supplies priced at or lower than competitors in our area.
- Take special interest in the children of our community by offering special classes and a membership plan tailored to their age group and interests.
- Keep our employees up to date on new exempt ideas and techniques, and teaching them to our customers
- Maintain a website that supports our store to help generate more customers in the long term. Our specially-designed “Tips” web page will make it easy for potential customers from all over to learn more about this hobby.
5.2 Sales Strategy
We will track our local competitor’s prices and compare their prices to our supplier’s prices. This will help us achieve our lowest price goals and still stay within our target markup.
5.2.1 Sales Forecast
The following is our projected sales forecast. We project a 5% increase in sales for each of the first two years, so that our third year of sales will be 10% above year one. These are estimated figures using the monthly costs of our overhead and supplies along with our percent markup and the prices we will charge for classes and page design.


| Sales Forecast | |||
| Year 1 | Year 2 | Year 3 | |
| Sales | |||
| SCRAPBOOK SUPPLIES | $50,000 | $52,500 | $55,000 |
| CLASSES | $26,400 | $27,720 | $29,040 |
| PAGE DESIGN | $10,750 | $11,288 | $11,825 |
| Other | $0 | $0 | $0 |
| Total Sales | $87,150 | $91,508 | $95,865 |
| Direct Cost of Sales | Year 1 | Year 2 | Year 3 |
| SCRAPBOOK SUPPLIES | $12,500 | $13,125 | $13,781 |
| CLASSES | $6,600 | $6,930 | $7,277 |
| PAGE DESIGN | $2,688 | $2,822 | $2,963 |
| Other | $0 | $0 | $0 |
| Subtotal Direct Cost of Sales | $21,788 | $22,877 | $24,021 |
5.3 Milestones
The following milestones outline the main tasks for the first year of operation.
| Milestones | |||||
| Milestone | Start Date | End Date | Budget | Manager | Department |
| Open business account | 11/1/2004 | 11/1/2004 | $500 | Owner | Department |
| Class Schedule Design | 12/15/2004 | 12/20/2004 | $0 | Owner | Department |
| Class Handouts Design/Print | 11/30/2004 | 12/15/2004 | $100 | Owner | Department |
| Mailing list (purchase) | 11/1/2004 | 12/1/2004 | $250 | Owner | Department |
| Ads for Part-time hires | 11/1/2004 | 11/8/2004 | $50 | Owner | Department |
| Training part-time hires | 11/29/2004 | 11/30/2004 | $1,000 | Owner | Department |
| Newspaper ad–Grand Opening | 12/26/2004 | 1/1/2005 | $500 | Owner | Department |
| Order-G. Opening Refreshments | 12/10/2004 | 12/10/2004 | $300 | Owner | Department |
| Class Mailing (first) | 1/10/2005 | 1/10/2005 | $250 | Owner | Department |
| Misc. | 1/1/2005 | 1/1/2005 | $0 | ABC | Department |
| Totals | $2,950 | ||||
5.4 Marketing Strategy
We will be promoting the store via the local newspaper. We will also have a grand opening “Get to Know Us” scrapbook party where we will offer refreshments, introduction to our staff, and tours of our store as well as sale pricing on many basic exempt supplies.
In the future, we will be pursuing mailings to regular customers and special mailings to potential customers in our target market areas as well as looking into billboard advertising.
Management Summary
It’s Scrappy! will initially consist of the Owner/Manager and two part-time clerks. We hope to be able to increase staffing as the store becomes more established.
6.1 Personnel Plan
The following table shows the expected employees needed to run It’s Scrappy! along with the payroll each will be given. The owner feels it is important to have herself and two part-time employees in order to effectively manage the store hours. Although this makes personnel one of the largest expenses, it is necessary in order to provide the personalized customer service and to cover the regular class schedule.
| Personnel Plan | |||
| Year 1 | Year 2 | Year 3 | |
| Owner/Manager | $14,400 | $14,400 | $14,400 |
| PART-TIME HELP | $8,400 | $8,400 | $8,400 |
| PART-TIME HELP | $8,400 | $8,400 | $8,400 |
| Other | $0 | $0 | $0 |
| Total People | 0 | 0 | 0 |
| Total Payroll | $31,200 | $31,200 | $31,200 |
Financial Plan
The following financial plan includes our projected Break Even Analysis, Profit and Loss, Cash Flow and Balance Sheet.
7.1 Break-even Analysis
Our break-even analysis table shows that we will need $7,667 per month to meet our regular expenses and salary costs.

| Break-even Analysis | |
| Monthly Revenue Break-even | $7,667 |
| Assumptions: | |
| Average Percent Variable Cost | 25% |
| Estimated Monthly Fixed Cost | $5,750 |
7.2 Projected Profit and Loss
As the following table describes, it will take several months before the store can realistically turn a profit. This is in part due to the time it takes to get the word out that the store is open for business and that what it offers for local scrappers is more than what our competition offers.
Although the winter time frame can be the best for class participation, these first monthly estimates were set conservatively, when, in fact, it is hoped that the initial advertising campaign will stimulate more sales and class sign-ups than what has been projected.
Although payroll costs are high for a start-up, the owner feels it is essential to have two part-time employees to help cover the store during its open hours. If necessary, the owner is prepared to reduce her monthly salary to ease the cash flow throughout the first year of operation.


| Pro Forma Profit and Loss | |||
| Year 1 | Year 2 | Year 3 | |
| Sales | $87,150 | $91,508 | $95,865 |
| Direct Cost of Sales | $21,788 | $22,877 | $24,021 |
| Other Costs of Goods | $0 | $0 | $0 |
| Total Cost of Sales | $21,788 | $22,877 | $24,021 |
| Gross Margin | $65,363 | $68,631 | $71,844 |
| Gross Margin % | 75.00% | 75.00% | 74.94% |
| Expenses | |||
| Payroll | $31,200 | $31,200 | $31,200 |
| Sales and Marketing and Other Expenses | $6,000 | $6,500 | $6,500 |
| Depreciation | $0 | $0 | $0 |
| Rent | $18,000 | $18,000 | $18,000 |
| Utilities | $6,000 | $6,000 | $6,000 |
| Insurance | $1,800 | $1,800 | $1,800 |
| Payroll Taxes | $6,000 | $6,000 | $6,000 |
| Other | $0 | $0 | $0 |
| Total Operating Expenses | $69,000 | $69,500 | $69,500 |
| Profit Before Interest and Taxes | ($3,638) | ($869) | $2,344 |
| EBITDA | ($3,638) | ($869) | $2,344 |
| Interest Expense | $644 | $0 | $0 |
| Taxes Incurred | $0 | $0 | $0 |
| Net Profit | ($4,282) | ($869) | $2,344 |
| Net Profit/Sales | -4.91% | -0.95% | 2.45% |
7.3 Projected Cash Flow
Although the initial profit margins are small, the cash flow is sufficient to cover estimated monthly expenses and inventory purchases. As additional back-up, a personal loan equal to the initial cost of inventory will be secured so It’s Scrappy! can adapt to changes in supply costs over the first year and be more able to make special-order purchases of new supplies and materials.
Estimated sales are expected to increase during the Fall and into the second winter of operation, while costs will be held as close to the same levels as possible.

| Pro Forma Cash Flow | |||
| Year 1 | Year 2 | Year 3 | |
| Cash Received | |||
| Cash from Operations | |||
| Cash Sales | $87,150 | $91,508 | $95,865 |
| Subtotal Cash from Operations | $87,150 | $91,508 | $95,865 |
| Additional Cash Received | |||
| Sales Tax, VAT, HST/GST Received | $0 | $0 | $0 |
| New Current Borrowing | $7,000 | $0 | $0 |
| New Other Liabilities (interest-free) | $0 | $0 | $0 |
| New Long-term Liabilities | $0 | $0 | $0 |
| Sales of Other Current Assets | $0 | $0 | $0 |
| Sales of Long-term Assets | $0 | $0 | $0 |
| New Investment Received | $0 | $0 | $0 |
| Subtotal Cash Received | $94,150 | $91,508 | $95,865 |
| Expenditures | Year 1 | Year 2 | Year 3 |
| Expenditures from Operations | |||
| Cash Spending | $31,200 | $31,200 | $31,200 |
| Bill Payments | $50,455 | $61,657 | $62,363 |
| Subtotal Spent on Operations | $81,655 | $92,857 | $93,563 |
| Additional Cash Spent | |||
| Sales Tax, VAT, HST/GST Paid Out | $0 | $0 | $0 |
| Principal Repayment of Current Borrowing | $1,029 | $1,029 | $1,029 |
| Other Liabilities Principal Repayment | $0 | $0 | $0 |
| Long-term Liabilities Principal Repayment | $0 | $0 | $0 |
| Purchase Other Current Assets | $0 | $0 | $0 |
| Purchase Long-term Assets | $0 | $0 | $0 |
| Dividends | $0 | $0 | $0 |
| Subtotal Cash Spent | $82,684 | $93,886 | $94,592 |
| Net Cash Flow | $11,466 | ($2,379) | $1,273 |
| Cash Balance | $12,966 | $10,587 | $11,860 |
7.4 Projected Balance Sheet
The balance sheet shows are estimated assets and liabilities.
| Pro Forma Balance Sheet | |||
| Year 1 | Year 2 | Year 3 | |
| Assets | |||
| Current Assets | |||
| Cash | $12,966 | $10,587 | $11,860 |
| Inventory | $2,613 | $2,743 | $2,880 |
| Other Current Assets | $0 | $0 | $0 |
| Total Current Assets | $15,579 | $13,330 | $14,740 |
| Long-term Assets | |||
| Long-term Assets | $2,500 | $2,500 | $2,500 |
| Accumulated Depreciation | $0 | $0 | $0 |
| Total Long-term Assets | $2,500 | $2,500 | $2,500 |
| Total Assets | $18,079 | $15,830 | $17,240 |
| Liabilities and Capital | Year 1 | Year 2 | Year 3 |
| Current Liabilities | |||
| Accounts Payable | $5,389 | $5,039 | $5,134 |
| Current Borrowing | $5,971 | $4,942 | $3,913 |
| Other Current Liabilities | $0 | $0 | $0 |
| Subtotal Current Liabilities | $11,360 | $9,981 | $9,047 |
| Long-term Liabilities | $0 | $0 | $0 |
| Total Liabilities | $11,360 | $9,981 | $9,047 |
| Paid-in Capital | $20,000 | $20,000 | $20,000 |
| Retained Earnings | ($9,000) | ($13,282) | ($14,151) |
| Earnings | ($4,282) | ($869) | $2,344 |
| Total Capital | $6,718 | $5,849 | $8,193 |
| Total Liabilities and Capital | $18,079 | $15,830 | $17,240 |
| Net Worth | $6,718 | $5,849 | $8,193 |
7.5 Business Ratios
The following comparison Ratios are taken from the Standard Industry Code for “Hobby and Craft Supplies,” Standard Industrial Classification (SIC) code 5945. As the following tables shows, are estimates are within the standard ratios for this industry.
| Ratio Analysis | ||||
| Year 1 | Year 2 | Year 3 | Industry Profile | |
| Sales Growth | 0.00% | 5.00% | 4.76% | -2.50% |
| Percent of Total Assets | ||||
| Inventory | 14.45% | 17.33% | 16.71% | 36.25% |
| Other Current Assets | 0.00% | 0.00% | 0.00% | 25.68% |
| Total Current Assets | 86.17% | 84.21% | 85.50% | 77.69% |
| Long-term Assets | 13.83% | 15.79% | 14.50% | 22.31% |
| Total Assets | 100.00% | 100.00% | 100.00% | 100.00% |
| Current Liabilities | 62.84% | 63.05% | 52.48% | 31.11% |
| Long-term Liabilities | 0.00% | 0.00% | 0.00% | 18.08% |
| Total Liabilities | 62.84% | 63.05% | 52.48% | 49.19% |
| Net Worth | 37.16% | 36.95% | 47.52% | 50.81% |
| Percent of Sales | ||||
| Sales | 100.00% | 100.00% | 100.00% | 100.00% |
| Gross Margin | 75.00% | 75.00% | 74.94% | 32.08% |
| Selling, General & Administrative Expenses | 54.65% | 0.00% | 0.00% | 20.20% |
| Advertising Expenses | 0.00% | 0.00% | 0.00% | 1.61% |
| Profit Before Interest and Taxes | -4.17% | -0.95% | 2.45% | 0.60% |
| Main Ratios | ||||
| Current | 1.37 | 1.34 | 1.63 | 2.17 |
| Quick | 1.14 | 1.06 | 1.31 | 0.83 |
| Total Debt to Total Assets | 62.84% | 63.05% | 52.48% | 58.38% |
| Pre-tax Return on Net Worth | -63.73% | -14.86% | 28.61% | 0.96% |
| Pre-tax Return on Assets | -23.68% | -5.49% | 13.60% | 2.30% |
| Additional Ratios | Year 1 | Year 2 | Year 3 | |
| Net Profit Margin | -4.91% | -0.95% | 2.45% | n.a |
| Return on Equity | -63.73% | -14.86% | 28.61% | n.a |
| Activity Ratios | ||||
| Inventory Turnover | 7.45 | 8.54 | 8.54 | n.a |
| Accounts Payable Turnover | 10.36 | 12.17 | 12.17 | n.a |
| Payment Days | 27 | 31 | 30 | n.a |
| Total Asset Turnover | 4.82 | 5.78 | 5.56 | n.a |
| Debt Ratios | ||||
| Debt to Net Worth | 1.69 | 1.71 | 1.10 | n.a |
| Current Liab. to Liab. | 1.00 | 1.00 | 1.00 | n.a |
| Liquidity Ratios | ||||
| Net Working Capital | $4,218 | $3,349 | $5,693 | n.a |
| Interest Coverage | -5.65 | 0.00 | 0.00 | n.a |
| Additional Ratios | ||||
| Assets to Sales | 0.21 | 0.17 | 0.18 | n.a |
| Current Debt/Total Assets | 63% | 63% | 52% | n.a |
| Acid Test | 1.14 | 1.06 | 1.31 | n.a |
| Sales/Net Worth | 12.97 | 15.65 | 11.70 | n.a |
| Dividend Payout | 0.00 | 0.00 | 0.00 | n.a |
Appendix
| Sales Forecast | |||||||||||||
| Month 1 | Month 2 | Month 3 | Month 4 | Month 5 | Month 6 | Month 7 | Month 8 | Month 9 | Month 10 | Month 11 | Month 12 | ||
| Sales | |||||||||||||
| SCRAPBOOK SUPPLIES | 0% | $3,000 | $3,000 | $3,000 | $4,000 | $4,000 | $4,500 | $4,500 | $4,500 | $4,500 | $5,000 | $5,000 | $5,000 |
| CLASSES | 0% | $1,000 | $1,500 | $1,500 | $1,500 | $1,500 | $2,600 | $2,600 | $2,600 | $2,600 | $3,000 | $3,000 | $3,000 |
| PAGE DESIGN | 0% | $250 | $500 | $500 | $500 | $500 | $1,000 | $1,000 | $1,000 | $1,000 | $1,500 | $1,500 | $1,500 |
| Other | 0% | $0 | $0 | $0 | $0 | $0 | $0 | $0 | $0 | $0 | $0 | $0 | $0 |
| Total Sales | $4,250 | $5,000 | $5,000 | $6,000 | $6,000 | $8,100 | $8,100 | $8,100 | $8,100 | $9,500 | $9,500 | $9,500 | |
| Direct Cost of Sales | Month 1 | Month 2 | Month 3 | Month 4 | Month 5 | Month 6 | Month 7 | Month 8 | Month 9 | Month 10 | Month 11 | Month 12 | |
| SCRAPBOOK SUPPLIES | $750 | $750 | $750 | $1,000 | $1,000 | $1,125 | $1,125 | $1,125 | $1,125 | $1,250 | $1,250 | $1,250 | |
| CLASSES | $250 | $375 | $375 | $375 | $375 | $650 | $650 | $650 | $650 | $750 | $750 | $750 | |
| PAGE DESIGN | $63 | $125 | $125 | $125 | $125 | $250 | $250 | $250 | $250 | $375 | $375 | $375 | |
| Other | $0 | $0 | $0 | $0 | $0 | $0 | $0 | $0 | $0 | $0 | $0 | $0 | |
| Subtotal Direct Cost of Sales | $1,063 | $1,250 | $1,250 | $1,500 | $1,500 | $2,025 | $2,025 | $2,025 | $2,025 | $2,375 | $2,375 | $2,375 | |
| Personnel Plan | |||||||||||||
| Month 1 | Month 2 | Month 3 | Month 4 | Month 5 | Month 6 | Month 7 | Month 8 | Month 9 | Month 10 | Month 11 | Month 12 | ||
| Owner/Manager | 0% | $1,200 | $1,200 | $1,200 | $1,200 | $1,200 | $1,200 | $1,200 | $1,200 | $1,200 | $1,200 | $1,200 | $1,200 |
| PART-TIME HELP | 0% | $700 | $700 | $700 | $700 | $700 | $700 | $700 | $700 | $700 | $700 | $700 | $700 |
| PART-TIME HELP | 0% | $700 | $700 | $700 | $700 | $700 | $700 | $700 | $700 | $700 | $700 | $700 | $700 |
| Other | 0% | $0 | $0 | $0 | $0 | $0 | $0 | $0 | $0 | $0 | $0 | $0 | $0 |
| Total People | 0 | 0 | 0 | 0 | 0 | 0 | 0 | 0 | 0 | 0 | 0 | 0 | |
| Total Payroll | $2,600 | $2,600 | $2,600 | $2,600 | $2,600 | $2,600 | $2,600 | $2,600 | $2,600 | $2,600 | $2,600 | $2,600 | |
| General Assumptions | |||||||||||||
| Month 1 | Month 2 | Month 3 | Month 4 | Month 5 | Month 6 | Month 7 | Month 8 | Month 9 | Month 10 | Month 11 | Month 12 | ||
| Plan Month | 1 | 2 | 3 | 4 | 5 | 6 | 7 | 8 | 9 | 10 | 11 | 12 | |
| Current Interest Rate | 10.00% | 10.00% | 10.00% | 10.00% | 10.00% | 10.00% | 10.00% | 10.00% | 10.00% | 10.00% | 10.00% | 10.00% | |
| Long-term Interest Rate | 0.00% | 0.00% | 0.00% | 0.00% | 0.00% | 0.00% | 0.00% | 0.00% | 0.00% | 0.00% | 0.00% | 0.00% | |
| Tax Rate | 0.00% | 0.00% | 0.00% | 0.00% | 0.00% | 0.00% | 0.00% | 0.00% | 0.00% | 0.00% | 0.00% | 0.00% | |
| Other | 0 | 0 | 0 | 0 | 0 | 0 | 0 | 0 | 0 | 0 | 0 | 0 | |
| Pro Forma Profit and Loss | |||||||||||||
| Month 1 | Month 2 | Month 3 | Month 4 | Month 5 | Month 6 | Month 7 | Month 8 | Month 9 | Month 10 | Month 11 | Month 12 | ||
| Sales | $4,250 | $5,000 | $5,000 | $6,000 | $6,000 | $8,100 | $8,100 | $8,100 | $8,100 | $9,500 | $9,500 | $9,500 | |
| Direct Cost of Sales | $1,063 | $1,250 | $1,250 | $1,500 | $1,500 | $2,025 | $2,025 | $2,025 | $2,025 | $2,375 | $2,375 | $2,375 | |
| Other Costs of Goods | $0 | $0 | $0 | $0 | $0 | $0 | $0 | $0 | $0 | $0 | $0 | $0 | |
| Total Cost of Sales | $1,063 | $1,250 | $1,250 | $1,500 | $1,500 | $2,025 | $2,025 | $2,025 | $2,025 | $2,375 | $2,375 | $2,375 | |
| Gross Margin | $3,188 | $3,750 | $3,750 | $4,500 | $4,500 | $6,075 | $6,075 | $6,075 | $6,075 | $7,125 | $7,125 | $7,125 | |
| Gross Margin % | 75.00% | 75.00% | 75.00% | 75.00% | 75.00% | 75.00% | 75.00% | 75.00% | 75.00% | 75.00% | 75.00% | 75.00% | |
| Expenses | |||||||||||||
| Payroll | $2,600 | $2,600 | $2,600 | $2,600 | $2,600 | $2,600 | $2,600 | $2,600 | $2,600 | $2,600 | $2,600 | $2,600 | |
| Sales and Marketing and Other Expenses | $500 | $500 | $500 | $500 | $500 | $500 | $500 | $500 | $500 | $500 | $500 | $500 | |
| Depreciation | $0 | $0 | $0 | $0 | $0 | $0 | $0 | $0 | $0 | $0 | $0 | $0 | |
| Rent | $1,500 | $1,500 | $1,500 | $1,500 | $1,500 | $1,500 | $1,500 | $1,500 | $1,500 | $1,500 | $1,500 | $1,500 | |
| Utilities | $500 | $500 | $500 | $500 | $500 | $500 | $500 | $500 | $500 | $500 | $500 | $500 | |
| Insurance | $150 | $150 | $150 | $150 | $150 | $150 | $150 | $150 | $150 | $150 | $150 | $150 | |
| Payroll Taxes | 15% | $500 | $500 | $500 | $500 | $500 | $500 | $500 | $500 | $500 | $500 | $500 | $500 |
| Other | $0 | $0 | $0 | $0 | $0 | $0 | $0 | $0 | $0 | $0 | $0 | $0 | |
| Total Operating Expenses | $5,750 | $5,750 | $5,750 | $5,750 | $5,750 | $5,750 | $5,750 | $5,750 | $5,750 | $5,750 | $5,750 | $5,750 | |
| Profit Before Interest and Taxes | ($2,563) | ($2,000) | ($2,000) | ($1,250) | ($1,250) | $325 | $325 | $325 | $325 | $1,375 | $1,375 | $1,375 | |
| EBITDA | ($2,563) | ($2,000) | ($2,000) | ($1,250) | ($1,250) | $325 | $325 | $325 | $325 | $1,375 | $1,375 | $1,375 | |
| Interest Expense | $58 | $57 | $56 | $55 | $55 | $54 | $53 | $53 | $52 | $51 | $50 | $50 | |
| Taxes Incurred | $0 | $0 | $0 | $0 | $0 | $0 | $0 | $0 | $0 | $0 | $0 | $0 | |
| Net Profit | ($2,620) | ($2,057) | ($2,056) | ($1,305) | ($1,305) | $271 | $272 | $272 | $273 | $1,324 | $1,325 | $1,325 | |
| Net Profit/Sales | -61.65% | -41.14% | -41.12% | -21.76% | -21.75% | 3.35% | 3.35% | 3.36% | 3.37% | 13.93% | 13.94% | 13.95% | |
| Pro Forma Cash Flow | |||||||||||||
| Month 1 | Month 2 | Month 3 | Month 4 | Month 5 | Month 6 | Month 7 | Month 8 | Month 9 | Month 10 | Month 11 | Month 12 | ||
| Cash Received | |||||||||||||
| Cash from Operations | |||||||||||||
| Cash Sales | $4,250 | $5,000 | $5,000 | $6,000 | $6,000 | $8,100 | $8,100 | $8,100 | $8,100 | $9,500 | $9,500 | $9,500 | |
| Subtotal Cash from Operations | $4,250 | $5,000 | $5,000 | $6,000 | $6,000 | $8,100 | $8,100 | $8,100 | $8,100 | $9,500 | $9,500 | $9,500 | |
| Additional Cash Received | |||||||||||||
| Sales Tax, VAT, HST/GST Received | 0.00% | $0 | $0 | $0 | $0 | $0 | $0 | $0 | $0 | $0 | $0 | $0 | $0 |
| New Current Borrowing | $7,000 | $0 | $0 | $0 | $0 | $0 | $0 | $0 | $0 | $0 | $0 | $0 | |
| New Other Liabilities (interest-free) | $0 | $0 | $0 | $0 | $0 | $0 | $0 | $0 | $0 | $0 | $0 | $0 | |
| New Long-term Liabilities | $0 | $0 | $0 | $0 | $0 | $0 | $0 | $0 | $0 | $0 | $0 | $0 | |
| Sales of Other Current Assets | $0 | $0 | $0 | $0 | $0 | $0 | $0 | $0 | $0 | $0 | $0 | $0 | |
| Sales of Long-term Assets | $0 | $0 | $0 | $0 | $0 | $0 | $0 | $0 | $0 | $0 | $0 | $0 | |
| New Investment Received | $0 | $0 | $0 | $0 | $0 | $0 | $0 | $0 | $0 | $0 | $0 | $0 | |
| Subtotal Cash Received | $11,250 | $5,000 | $5,000 | $6,000 | $6,000 | $8,100 | $8,100 | $8,100 | $8,100 | $9,500 | $9,500 | $9,500 | |
| Expenditures | Month 1 | Month 2 | Month 3 | Month 4 | Month 5 | Month 6 | Month 7 | Month 8 | Month 9 | Month 10 | Month 11 | Month 12 | |
| Expenditures from Operations | |||||||||||||
| Cash Spending | $2,600 | $2,600 | $2,600 | $2,600 | $2,600 | $2,600 | $2,600 | $2,600 | $2,600 | $2,600 | $2,600 | $2,600 | |
| Bill Payments | $107 | $3,208 | $3,207 | $3,206 | $3,269 | $5,105 | $5,123 | $5,228 | $5,228 | $5,251 | $5,948 | $5,575 | |
| Subtotal Spent on Operations | $2,707 | $5,808 | $5,807 | $5,806 | $5,869 | $7,705 | $7,723 | $7,828 | $7,828 | $7,851 | $8,548 | $8,175 | |
| Additional Cash Spent | |||||||||||||
| Sales Tax, VAT, HST/GST Paid Out | $0 | $0 | $0 | $0 | $0 | $0 | $0 | $0 | $0 | $0 | $0 | $0 | |
| Principal Repayment of Current Borrowing | $86 | $86 | $86 | $86 | $86 | $86 | $86 | $86 | $86 | $86 | $86 | $86 | |
| Other Liabilities Principal Repayment | $0 | $0 | $0 | $0 | $0 | $0 | $0 | $0 | $0 | $0 | $0 | $0 | |
| Long-term Liabilities Principal Repayment | $0 | $0 | $0 | $0 | $0 | $0 | $0 | $0 | $0 | $0 | $0 | $0 | |
| Purchase Other Current Assets | $0 | $0 | $0 | $0 | $0 | $0 | $0 | $0 | $0 | $0 | $0 | $0 | |
| Purchase Long-term Assets | $0 | $0 | $0 | $0 | $0 | $0 | $0 | $0 | $0 | $0 | $0 | $0 | |
| Dividends | $0 | $0 | $0 | $0 | $0 | $0 | $0 | $0 | $0 | $0 | $0 | $0 | |
| Subtotal Cash Spent | $2,793 | $5,893 | $5,893 | $5,892 | $5,954 | $7,791 | $7,808 | $7,914 | $7,913 | $7,937 | $8,634 | $8,261 | |
| Net Cash Flow | $8,457 | ($893) | ($893) | $108 | $46 | $309 | $292 | $186 | $187 | $1,563 | $866 | $1,239 | |
| Cash Balance | $9,957 | $9,064 | $8,171 | $8,280 | $8,325 | $8,634 | $8,926 | $9,112 | $9,298 | $10,861 | $11,727 | $12,966 | |
| Pro Forma Balance Sheet | |||||||||||||
| Month 1 | Month 2 | Month 3 | Month 4 | Month 5 | Month 6 | Month 7 | Month 8 | Month 9 | Month 10 | Month 11 | Month 12 | ||
| Assets | Starting Balances | ||||||||||||
| Current Assets | |||||||||||||
| Cash | $1,500 | $9,957 | $9,064 | $8,171 | $8,280 | $8,325 | $8,634 | $8,926 | $9,112 | $9,298 | $10,861 | $11,727 | $12,966 |
| Inventory | $7,000 | $5,938 | $4,688 | $3,438 | $1,938 | $2,338 | $2,228 | $2,228 | $2,228 | $2,228 | $2,613 | $2,613 | $2,613 |
| Other Current Assets | $0 | $0 | $0 | $0 | $0 | $0 | $0 | $0 | $0 | $0 | $0 | $0 | $0 |
| Total Current Assets | $8,500 | $15,895 | $13,752 | $11,609 | $10,217 | $10,663 | $10,862 | $11,153 | $11,339 | $11,526 | $13,474 | $14,340 | $15,579 |
| Long-term Assets | |||||||||||||
| Long-term Assets | $2,500 | $2,500 | $2,500 | $2,500 | $2,500 | $2,500 | $2,500 | $2,500 | $2,500 | $2,500 | $2,500 | $2,500 | $2,500 |
| Accumulated Depreciation | $0 | $0 | $0 | $0 | $0 | $0 | $0 | $0 | $0 | $0 | $0 | $0 | $0 |
| Total Long-term Assets | $2,500 | $2,500 | $2,500 | $2,500 | $2,500 | $2,500 | $2,500 | $2,500 | $2,500 | $2,500 | $2,500 | $2,500 | $2,500 |
| Total Assets | $11,000 | $18,395 | $16,252 | $14,109 | $12,717 | $13,163 | $13,362 | $13,653 | $13,839 | $14,026 | $15,974 | $16,840 | $18,079 |
| Liabilities and Capital | Month 1 | Month 2 | Month 3 | Month 4 | Month 5 | Month 6 | Month 7 | Month 8 | Month 9 | Month 10 | Month 11 | Month 12 | |
| Current Liabilities | |||||||||||||
| Accounts Payable | $0 | $3,101 | $3,100 | $3,099 | $3,099 | $4,935 | $4,948 | $5,054 | $5,053 | $5,053 | $5,762 | $5,390 | $5,389 |
| Current Borrowing | $0 | $6,914 | $6,829 | $6,743 | $6,657 | $6,571 | $6,486 | $6,400 | $6,314 | $6,229 | $6,143 | $6,057 | $5,971 |
| Other Current Liabilities | $0 | $0 | $0 | $0 | $0 | $0 | $0 | $0 | $0 | $0 | $0 | $0 | $0 |
| Subtotal Current Liabilities | $0 | $10,015 | $9,929 | $9,842 | $9,756 | $11,506 | $11,434 | $11,454 | $11,368 | $11,281 | $11,905 | $11,447 | $11,360 |
| Long-term Liabilities | $0 | $0 | $0 | $0 | $0 | $0 | $0 | $0 | $0 | $0 | $0 | $0 | $0 |
| Total Liabilities | $0 | $10,015 | $9,929 | $9,842 | $9,756 | $11,506 | $11,434 | $11,454 | $11,368 | $11,281 | $11,905 | $11,447 | $11,360 |
| Paid-in Capital | $20,000 | $20,000 | $20,000 | $20,000 | $20,000 | $20,000 | $20,000 | $20,000 | $20,000 | $20,000 | $20,000 | $20,000 | $20,000 |
| Retained Earnings | ($9,000) | ($9,000) | ($9,000) | ($9,000) | ($9,000) | ($9,000) | ($9,000) | ($9,000) | ($9,000) | ($9,000) | ($9,000) | ($9,000) | ($9,000) |
| Earnings | $0 | ($2,620) | ($4,677) | ($6,733) | ($8,039) | ($9,343) | ($9,073) | ($8,801) | ($8,528) | ($8,255) | ($6,932) | ($5,607) | ($4,282) |
| Total Capital | $11,000 | $8,380 | $6,323 | $4,267 | $2,961 | $1,657 | $1,927 | $2,199 | $2,472 | $2,745 | $4,068 | $5,393 | $6,718 |
| Total Liabilities and Capital | $11,000 | $18,395 | $16,252 | $14,109 | $12,717 | $13,163 | $13,362 | $13,653 | $13,839 | $14,026 | $15,974 | $16,840 | $18,079 |
| Net Worth | $11,000 | $8,380 | $6,323 | $4,267 | $2,961 | $1,657 | $1,927 | $2,199 | $2,472 | $2,745 | $4,068 | $5,393 | $6,718 |


