
Scholarship Assist
Executive Summary
ScholarshipAssist assists college-bound students with their search for scholarship money. ScholarshipAssist is able to increase the award amount for students that have a scholarship or can increase the likelihood of a scholarship award for those on the border line of receiving one. ScholarshipAssist maintains an extensive database of available scholarships and offers each client individualized consulting.
Keys to Success
ScholarshipAssist has identified three keys to success which it believes will be instrumental to the health of the organization. The first is the need to offer significant value to the customers. The second is to maintain a 60% success rate for securing scholarships or increasing the amount of the scholarship. The third key is to adhere to strict financial controls.
The Market
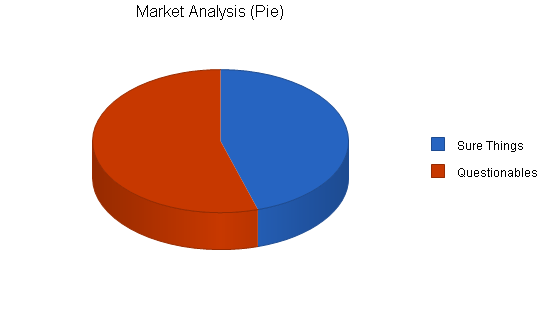
ScholarshipAssist has segmented its market into two distinct segments. The first group is sure thing applicants, the market segment that is very likely to receive scholarships. This segment is growing at 10% per year and has 93,000 potential customers. The second group is questionables whose needs will be met by significantly increasing their likelihood of receiving a scholarship through ScholarshipAssist’s guidance. This group has an annual growth rate of 11% with 112,000 potential people.
Management
ScholarshipAssist is being lead by industry veteran Steve Tracker. Steve’s educational credentials include a graduate degree in business from Babson College. He has worked in the financial aid department at Babson college, Fannie Mae, and Pew Charitable Trust Foundation. Having a well seasoned manager will help ensure success for ScholarshipAssist.
ScholarshipAssist has conservatively forecasted sales of $172,589 for year two, rising to $232,508 by year three. Profitability will increase over the next three years. Through a combination of an innovative business plan in a growing market space and a seasoned manager, ScholarshipAssist will quickly increase market penetration in a very exciting market space.

1.1 Mission
The mission of ScholarshipAssist is to help thousands of college students realize their dream of attending college by helping them find scholarships. ScholarshipAssist will aim to maintain 100% customer satisfaction for all clients.
1.2 Objectives
- Become known as THE resource for scholarship assistance.
- Reach profitability by the end of year one.
- Generate yearly sales of $200,000 within three years.
1.3 Keys to Success
- Offer significant value to clients by having a comprehensive database of scholarships and useful application information.
- Help at least 60% of the clients secure significant scholarships.
- Maintain strict financial controls.
Company Summary
ScholarshipAssist has been founded on the idea that there are a wealth of scholarships available to students that few are aware of. By becoming professionals in this arena, ScholarshipAssist can generate significant profit while helping clients make college a reality. ScholarshipAssist has chosen Boston as its headquarters because of the huge pool of students in town including but not limited to Tufts, M.I.T., Harvard, Boston College, and the University of Massachusetts.
2.1 Company Ownership
ScholarshipAssist is a Massachusetts L.L.C. with Steve Tracker as the main shareholder.
2.2 Start-up Summary
ScholarshipAssist will require the following start-up equipment/expenses:
- Assorted office furniture for four work spaces, including desk, chair, light, computer;
- Computer server with laser printer, broadband Internet connection, fax machine;
- Assorted furniture for the waiting room;
- Legal consultation for the business organization formation, review of contracts, etc.;
- Business consultation – this service will be a fairly broad area of consulting from HR to marketing.

| Start-up | |
| Requirements | |
| Start-up Expenses | |
| Legal | $3,000 |
| Stationery etc. | $300 |
| Brochures | $350 |
| Consultants | $2,000 |
| Rent | $1,000 |
| Research and Development | $4,000 |
| Expensed Equipment | $700 |
| Total Start-up Expenses | $11,350 |
| Start-up Assets | |
| Cash Required | $22,350 |
| Other Current Assets | $1,300 |
| Long-term Assets | $10,000 |
| Total Assets | $33,650 |
| Total Requirements | $45,000 |
| Start-up Funding | |
| Start-up Expenses to Fund | $11,350 |
| Start-up Assets to Fund | $33,650 |
| Total Funding Required | $45,000 |
| Assets | |
| Non-cash Assets from Start-up | $11,300 |
| Cash Requirements from Start-up | $22,350 |
| Additional Cash Raised | $0 |
| Cash Balance on Starting Date | $22,350 |
| Total Assets | $33,650 |
| Liabilities and Capital | |
| Liabilities | |
| Current Borrowing | $0 |
| Long-term Liabilities | $0 |
| Accounts Payable (Outstanding Bills) | $0 |
| Other Current Liabilities (interest-free) | $0 |
| Total Liabilities | $0 |
| Capital | |
| Planned Investment | |
| Investor 1 | $45,000 |
| Other | $0 |
| Additional Investment Requirement | $0 |
| Total Planned Investment | $45,000 |
| Loss at Start-up (Start-up Expenses) | ($11,350) |
| Total Capital | $33,650 |
| Total Capital and Liabilities | $33,650 |
| Total Funding | $45,000 |
Services
ScholarshipAssist offers college scholarship assistance to college students. There are many scholarships available that would help make college affordable for most people.
Unlike loans which require repayment, scholarships are “gifts” that generally do not need to be repaid. Many scholarships have initial prerequisites as well as performance requirements for the recipient while they are in school receiving aid.
Some scholarships have initial prerequisites such as financial need, aptitude/scholastic performance, ethnicity, association membership, etc. Many of the scholarships also have performance benchmarks that must be met while the person is receiving the aid such as a certain grade point average, avoiding academic probation, etc.
Each organization that offers scholarships have their own requirements and these requirements are at the discretion of each organization.
There are thousands of scholarships available that the potential applicants are not aware of. This is where ScholarshipAssist offers value. Their two primary services are:
- Provide the client with a list of possible scholarships from ScholarshipAssist’s master database that would be the most likely options. This database is a collection of many different available scholarships, a list that ScholarshipAssist has spent countless hours researching and continually updates.
- Increase the likelihood that the client receives a scholarship for each one that they apply to. By leveraging ScholarshipAssist’s knowledge of how scholarship recipients are chosen and passing this information on to its clients, it increases the strength of its clients application. ScholarshipAssist is also able to offer individualized suggestions specific to the different scholarships.
ScholarshipAssist fee structure is based on an incentivized performance compensation model where it gets paid if it successfully helps the client realize the scholarship. This is the proper fee model because it forces ScholarshipAssist to perform and it encourages many potential customers to sign up since payment is contingent on them getting money, a win-win situation.
Market Analysis Summary
ScholarshipAssist has identified two customer segments that it will attempt to convert to customers. The first segment are “sure thing” customers, those that are likely to get a scholarship generally due to their circumstances, whether economic or performance based. The second market segment is the “questionables” who are on the fringe for getting a scholarship but need ScholarshipAssist’s help.
Both of these segments, if they are going to rely on outside help to attempt to secure a scholarship, will generally use a career services person, either at their high school or at the college to help assist them with this process.
While the career services can be helpful, the students must be aware of the fact that the career service person helps a lot of different people thereby making the time they can spend with each student fairly small. Additionally, the person has no financial incentive in securing a scholarship and they have a limited amount of time to commit to each student.
There are no direct competitors for this type of service. Each career service department maintains a list of possible scholarships, however, it is not exhaustive nor updated often. There are a few websites that maintain a list of possible scholarships. These lists can be helpful, however the clients do not receive any individual attention or consulting for which scholarships to apply for and how they can strengthen their application.

4.1 Market Segmentation
ScholarshipAssist has segmented the market into two distinct segments:
Sure thing customers
These people are likely to secure some sort of scholarship for a variety of reasons. This group is using ScholarshipAssist’s services as a way of increasing the amount that they would receive from a scholarship or the number of scholarships that they receive. Demographic information is as follows:
- If their likelihood of getting a scholarship is based on academic performance, this segment has SAT scores of >1100.
- If their likelihood of getting a scholarship is need based, their household income is >$30,000.
- Are fairly sophisticated regarding the college education process.
- Are definitely going to college but would like to minimize the expense of their education as much as possible.
Questionables
This market segment is trying to make college a reality by securing a scholarship. The category is called questionables not because they are questionable about going to school, but because they are on the border line for receiving a scholarship. This group is therefore using the ScholarshipAssist’s services to secure a scholarship thereby making a college education affordable. Demographic information is as follows:
- If they are need based applicants, their household income is >$50,000.
- SAT scores of <1000.
- Recognize that they need help in securing a scholarship. They may or may not have spent time doing research on their own.
| Market Analysis | |||||||
| Year 1 | Year 2 | Year 3 | Year 4 | Year 5 | |||
| Potential Customers | Growth | CAGR | |||||
| Sure Things | 10% | 93,098 | 102,408 | 112,649 | 123,914 | 136,305 | 10.00% |
| Questionables | 11% | 112,343 | 124,139 | 137,174 | 151,577 | 167,493 | 10.50% |
| Total | 10.27% | 205,441 | 226,547 | 249,823 | 275,491 | 303,798 | 10.27% |
4.2 Target Market Segment Strategy
While ScholarshipAssist will be using the same media outlets for its advertising campaign, it will have different ads tailored for the different segments. One set of ads emphasizes the ability for ScholarshipAssist to secure larger amounts of assistance for each student. These ads will appeal to students who are highly likely to get a scholarship and will be lured to use ScholarshipAssist through the prospect of increased grant aid.
4.3 Service Business Analysis
There is not a large industry built around scholarship assistance currently. This can be explained by the fact that much of the help comes from career service counselors whether at the college or high school level. They do an adequate job, especially in light of the limited time and resources that they have. Within the last four years the industry has seen the emergence of several firms that offer a database of available scholarships on the Internet. These firms are more a list of resources as opposed to a company that offers individualized assistance.
4.3.1 Competition and Buying Patterns
ScholarshipAssist does not have any direct competition, however, there are several different companies working in the same space.
- Guidance school counselors. While these people do not charge for the offered services, they are hired by the school or district to assist the kids, they do provide similar services to what ScholarshipAssist does.
- Internet-based databases. There are several firms that offers lists of scholarships via their website.
- Individual consultants. There are some consultants that offer their services one on one to clients, but they are priced out of the range of most students.
Students are generally price sensitive. This means that they will often forgo a service provider or chose the least expensive one. ScholarshipAssist’s fees are billed on a contingency basis; they are only paid if they perform.
Strategy and Implementation Summary
ScholarshipAssist’s strategy will be based on raising awareness of its services as well as educating prospective clients on the effectiveness of its services. The effectiveness of ScholarshipAssist’s services is its competitive edge. It has the ability, because of a variety of factors, including extensive research, and industry insight, to show people the money.
The marketing campaign will educate students about the services offered, both the extensive database as well as the individualized counseling. The sales strategy will be based on the conversion of qualified leads into customers based on ScholarshipAssist effectiveness of getting scholarships for students who would not otherwise get any awards or increasing the award amount for those that would otherwise receive something less.
5.1 Competitive Edge
ScholarshipAssist’s competitive edge is its effectiveness to either secure scholarships for students or to increase the amount that the student would otherwise be able to do. ScholarshipAssist’s effectiveness percentage is forecasted to be 60% (and has been in limited number trials). This will be accomplished due to their extensive research that is completed on an ongoing basis as well as its wealth of industry knowledge. It is the industry knowledge (detailed in the Management Summary section) that allows it to be so effective, it knows how the industry works and what needs to be done to win scholarships for students.
5.2 Marketing Strategy
ScholarshipAssist’s marketing strategy is a strategic program designed to raise awareness among the two different student target groups regarding the services offered by ScholarshipAssist and how valuable it could be to the students. This will certainly be a challenging task since the services that ScholarshipAssist offers are a relatively new service offering. In the past the students got this type of help, albeit of lower quality and specificity from career counselors provided by the schools.
The marketing effort will utilize both advertisements and a word of mouth grass roots campaign to accomplish their goals. The advertisements will be placed in several local magazines whose readership is similar to ScholarshipAssist’s target demographic. The basic message that will be communicated is simply put that students can get far larger awards for scholarships if they use ScholarshipAssist’s help. Prominent in the advertisements will be its claim that ScholarshipAssist has a 60% success rate in helping secure scholarships or securing more out of a scholarship than if the student proceeded alone. The grass roots campaign will rely on two efforts: 1) a referral system, 2) student representatives that are “cheerleaders” for the service. This should be effective since the students are making the pitch to their peers and they already have a trust relationship with these people so what they say holds more weight.
5.3 Sales Strategy
ScholarshipAssist’s sales campaign will have the objective of making conversions of qualified leads into paying customers. The target customer is a qualified lead if they recognize the need for the services and have to some degree sought out help from ScholarshipAssist. The conversion process should not be that difficult for two main reasons. The first reason is its high success rate. The success rate would be even higher but for the reality that some students are not meet the criteria for scholarships – either they do not have the scholastic ability or economic factors are not in their favor. The second issue that should make the conversion relatively easy is the fact that the students use ScholarshipAssist’s services risk free – they pay nothing unless they are awarded a scholarship. The agreement is not exclusive, meaning the students are free to utilize other services and they do not have to pay for ScholarshipAssist’s services unless they perform.
5.3.1 Sales Forecast
The first few months will be fairly slow in terms of sales. This forecast is normal for two reasons. The first is the fact that ScholarshipAssist is a start-up organization and it takes time to build awareness, goodwill, and a client base for the business. The second explanation is the process for applying for scholarships is seasonal. It is not until April or May that students become more aggressive in securing plans for college.
The revenue stream that ScholarshipAssist receives is based on a percentage of the scholarship that is received by the student. ScholarshipAssist will receive a 6% commission on the money that it obtains for the students. This will have a positive impact on sales as there is a direct incentive to raise as much money for each student. ScholarshipAssist believes these sales forecasts to be reasonably conservative based on several factors. The first factor is the fact that Boston has a very large student population with so many different colleges and universities, some extremely desirable for people to attend. This provides ScholarshipAssist with a huge market. The second factor is that as students become increasingly more busy with extracurricular activities and work, they have less and less time to spend on the college entrance process. With less time and more money (the last two years has seen the highest percentage of students working in over 30 years) students were willing to pay someone else to accomplish tasks that they once had the time and desire to do.

| Sales Forecast | |||
| Year 1 | Year 2 | Year 3 | |
| Sales | |||
| Sure Things | $46,454 | $89,890 | $121,098 |
| Questionables | $42,738 | $82,699 | $111,410 |
| Total Sales | $89,192 | $172,589 | $232,508 |
| Direct Cost of Sales | Year 1 | Year 2 | Year 3 |
| Sure Things | $6,504 | $12,585 | $16,954 |
| Questionables | $5,983 | $11,578 | $15,597 |
| Subtotal Direct Cost of Sales | $12,487 | $24,162 | $32,551 |
5.4 Milestones
- Completion of business plan;
- Profitability;
- Monthly revenue exceeding $15,000.
| Milestones | |||||
| Milestone | Start Date | End Date | Budget | Manager | Department |
| Completion of business plan | 1/1/2003 | 2/15/2003 | $0 | Steve | Strategic |
| Profitability | 1/1/2003 | 9/30/2003 | $0 | Steve | Operations |
| Monthly rev $15,000 | 1/1/2003 | 2/1/2004 | $0 | Steve | Operations |
| Totals | $0 | ||||
Web Plan Summary
ScholarshipAssist will have a website as a way to disseminate information to prospective customers. A website is a very cost effective means for broadcasting information because it allows people to browse the material at their own leisure at whatever time is convenient for them. It also allows them to answer their questions without much help from ScholarshipAssist. Without the website the company would be overwhelmed with phone calls requiring more and more hours of ScholarshipAssist employees. The site will present people with a list of offered services, case studies of helped clients, and accomplishments of the firm.
6.1 Website Marketing Strategy
ScholarshipAssist is well aware of the fact that just because a company has a website does not mean that is any value since nobody might be visiting it. With this in mind, ScholarshipAssist will work hard to increase traffic on the site. All of the printed material that ScholarshipAssist uses will make reference to the site and encourage visitors. ScholarshipAssist will also be diligent in website submission. This is extremely important so that if a student is looking for these types of services but is not familiar with ScholarshipAssist specifically, they will still be hooked up with ScholarshipAssist.
6.2 Development Requirements
Development of the site will be handled by M.I.T. computer science students who are generally quite effective, yet work at below market rates.
Management Summary
Steve Tracker, the founder and president brings a wealth of skills and experience to the leadership role at ScholarshipAssist.
Steve received his undergraduate and graduate (MBA) degrees at Babson College in Wellesley. After his schooling, Steve went to work at Babson in their financial aid department for two years.
After Babson he went to work for Fannie Mae. At Fannie Mae Steve was a project manager in the risk assessment group. In this group, Steve was instrumental in developing formulas to assess the lending risk for clients.
Through networking contacts, Steve received a fantastic offer to come and work at the Pew Charitable Trust Foundation, the second largest scholarship fund in the USA. It was quite an honor to receive an offer at such a well respected organization that he immediately accepted the job. Steve spent six years at Pew learning every detail regarding how Pew selected recipients for their scholarships.
After four years at Pew, Steve had a seed planted in the back of his mind that some day soon he would like to start his own venture. With this in mind Steve continued to work hard at Pew, learning everything he could while networking at the same time. After 14 months, Steve began to work on a business plan for a company that leveraged his intricate knowledge regarding scholarship awards.
7.1 Personnel Plan
ScholarshipAssist has forecasted the need for a total of four employees for the first couple of years. The following bullets indicate the different employees. Please review the following chart for financial information regarding the personnel plan:
- Steve: operations, marketing, some financials, business development.
- Researcher: this position will be responsible for the development and maintenance of the scholarship database.
- Account manager (2): these position are responsible for the bulk of interactions between ScholarshipAssist and clients. These employees will ensure the complete satisfaction of the clients, servicing them in any way needed.
| Personnel Plan | |||
| Year 1 | Year 2 | Year 3 | |
| Steve | $24,000 | $30,000 | $40,000 |
| Researcher | $16,500 | $22,000 | $26,000 |
| Account Manager | $13,500 | $22,000 | $26,000 |
| Account Manager | $13,500 | $22,000 | $26,000 |
| Total People | 4 | 4 | 4 |
| Total Payroll | $67,500 | $96,000 | $118,000 |
Financial Plan
The following sections will outline important financial information.
8.1 Important Assumptions
The following table details important Financial Assumptions.
| General Assumptions | |||
| Year 1 | Year 2 | Year 3 | |
| Plan Month | 1 | 2 | 3 |
| Current Interest Rate | 10.00% | 10.00% | 10.00% |
| Long-term Interest Rate | 10.00% | 10.00% | 10.00% |
| Tax Rate | 30.00% | 30.00% | 30.00% |
| Other | 0 | 0 | 0 |
8.2 Break-even Analysis
The Break-even Analysis is shown below.

| Break-even Analysis | |
| Monthly Revenue Break-even | $9,460 |
| Assumptions: | |
| Average Percent Variable Cost | 14% |
| Estimated Monthly Fixed Cost | $8,136 |
8.3 Projected Profit and Loss
The following table will indicate Projected Profit and Loss.


| Pro Forma Profit and Loss | |||
| Year 1 | Year 2 | Year 3 | |
| Sales | $89,192 | $172,589 | $232,508 |
| Direct Cost of Sales | $12,487 | $24,162 | $32,551 |
| Other Costs of Sales | $0 | $0 | $0 |
| Total Cost of Sales | $12,487 | $24,162 | $32,551 |
| Gross Margin | $76,705 | $148,426 | $199,957 |
| Gross Margin % | 86.00% | 86.00% | 86.00% |
| Expenses | |||
| Payroll | $67,500 | $96,000 | $118,000 |
| Sales and Marketing and Other Expenses | $4,200 | $5,500 | $6,000 |
| Depreciation | $2,004 | $2,004 | $2,004 |
| Rent | $7,200 | $7,200 | $7,200 |
| Utilities | $2,400 | $2,400 | $2,400 |
| Insurance | $2,400 | $2,400 | $2,400 |
| Payroll Taxes | $10,125 | $14,400 | $17,700 |
| Other | $1,800 | $1,800 | $1,800 |
| Total Operating Expenses | $97,629 | $131,704 | $157,504 |
| Profit Before Interest and Taxes | ($20,924) | $16,722 | $42,453 |
| EBITDA | ($18,920) | $18,726 | $44,457 |
| Interest Expense | $0 | $0 | $0 |
| Taxes Incurred | $0 | $5,017 | $12,736 |
| Net Profit | ($20,924) | $11,706 | $29,717 |
| Net Profit/Sales | -23.46% | 6.78% | 12.78% |
8.4 Projected Cash Flow
The following table and chart will indicate Projected Cash Flow.

| Pro Forma Cash Flow | |||
| Year 1 | Year 2 | Year 3 | |
| Cash Received | |||
| Cash from Operations | |||
| Cash Sales | $89,192 | $172,589 | $232,508 |
| Subtotal Cash from Operations | $89,192 | $172,589 | $232,508 |
| Additional Cash Received | |||
| Sales Tax, VAT, HST/GST Received | $0 | $0 | $0 |
| New Current Borrowing | $0 | $0 | $0 |
| New Other Liabilities (interest-free) | $0 | $0 | $0 |
| New Long-term Liabilities | $0 | $0 | $0 |
| Sales of Other Current Assets | $0 | $0 | $0 |
| Sales of Long-term Assets | $0 | $0 | $0 |
| New Investment Received | $0 | $0 | $0 |
| Subtotal Cash Received | $89,192 | $172,589 | $232,508 |
| Expenditures | Year 1 | Year 2 | Year 3 |
| Expenditures from Operations | |||
| Cash Spending | $67,500 | $96,000 | $118,000 |
| Bill Payments | $36,201 | $62,122 | $81,151 |
| Subtotal Spent on Operations | $103,701 | $158,122 | $199,151 |
| Additional Cash Spent | |||
| Sales Tax, VAT, HST/GST Paid Out | $0 | $0 | $0 |
| Principal Repayment of Current Borrowing | $0 | $0 | $0 |
| Other Liabilities Principal Repayment | $0 | $0 | $0 |
| Long-term Liabilities Principal Repayment | $0 | $0 | $0 |
| Purchase Other Current Assets | $0 | $0 | $0 |
| Purchase Long-term Assets | $0 | $0 | $0 |
| Dividends | $0 | $0 | $0 |
| Subtotal Cash Spent | $103,701 | $158,122 | $199,151 |
| Net Cash Flow | ($14,509) | $14,467 | $33,357 |
| Cash Balance | $7,841 | $22,308 | $55,665 |
8.5 Projected Balance Sheet
The following table will indicate the Projected Balance Sheet.
| Pro Forma Balance Sheet | |||
| Year 1 | Year 2 | Year 3 | |
| Assets | |||
| Current Assets | |||
| Cash | $7,841 | $22,308 | $55,665 |
| Other Current Assets | $1,300 | $1,300 | $1,300 |
| Total Current Assets | $9,141 | $23,608 | $56,965 |
| Long-term Assets | |||
| Long-term Assets | $10,000 | $10,000 | $10,000 |
| Accumulated Depreciation | $2,004 | $4,008 | $6,012 |
| Total Long-term Assets | $7,996 | $5,992 | $3,988 |
| Total Assets | $17,137 | $29,600 | $60,953 |
| Liabilities and Capital | Year 1 | Year 2 | Year 3 |
| Current Liabilities | |||
| Accounts Payable | $4,411 | $5,168 | $6,804 |
| Current Borrowing | $0 | $0 | $0 |
| Other Current Liabilities | $0 | $0 | $0 |
| Subtotal Current Liabilities | $4,411 | $5,168 | $6,804 |
| Long-term Liabilities | $0 | $0 | $0 |
| Total Liabilities | $4,411 | $5,168 | $6,804 |
| Paid-in Capital | $45,000 | $45,000 | $45,000 |
| Retained Earnings | ($11,350) | ($32,274) | ($20,568) |
| Earnings | ($20,924) | $11,706 | $29,717 |
| Total Capital | $12,726 | $24,432 | $54,149 |
| Total Liabilities and Capital | $17,137 | $29,600 | $60,953 |
| Net Worth | $12,726 | $24,432 | $54,149 |
8.6 Business Ratios
The following table indicates important Business Ratios for both ScholarshipAssist as well as the industry as a whole. Please note that any material variances between ScholarshipAssist’s ratios and the industry rations can be explained by the fact that the services offered by ScholarshipAssist are quite new and are not duplicated by others therefore it is reasonable to expect that the ratios are not always consistent with the industry as a whole.
| Ratio Analysis | ||||
| Year 1 | Year 2 | Year 3 | Industry Profile | |
| Sales Growth | 0.00% | 93.50% | 34.72% | 8.15% |
| Percent of Total Assets | ||||
| Other Current Assets | 7.59% | 4.39% | 2.13% | 35.03% |
| Total Current Assets | 53.34% | 79.76% | 93.46% | 55.79% |
| Long-term Assets | 46.66% | 20.24% | 6.54% | 44.21% |
| Total Assets | 100.00% | 100.00% | 100.00% | 100.00% |
| Current Liabilities | 25.74% | 17.46% | 11.16% | 25.11% |
| Long-term Liabilities | 0.00% | 0.00% | 0.00% | 22.00% |
| Total Liabilities | 25.74% | 17.46% | 11.16% | 47.11% |
| Net Worth | 74.26% | 82.54% | 88.84% | 52.89% |
| Percent of Sales | ||||
| Sales | 100.00% | 100.00% | 100.00% | 100.00% |
| Gross Margin | 86.00% | 86.00% | 86.00% | 100.00% |
| Selling, General & Administrative Expenses | 109.46% | 79.22% | 73.22% | 77.99% |
| Advertising Expenses | 0.00% | 0.00% | 0.00% | 1.85% |
| Profit Before Interest and Taxes | -23.46% | 9.69% | 18.26% | 3.35% |
| Main Ratios | ||||
| Current | 2.07 | 4.57 | 8.37 | 1.73 |
| Quick | 2.07 | 4.57 | 8.37 | 1.30 |
| Total Debt to Total Assets | 25.74% | 17.46% | 11.16% | 59.92% |
| Pre-tax Return on Net Worth | -164.42% | 68.45% | 78.40% | 6.16% |
| Pre-tax Return on Assets | -122.10% | 56.50% | 69.65% | 15.38% |
| Additional Ratios | Year 1 | Year 2 | Year 3 | |
| Net Profit Margin | -23.46% | 6.78% | 12.78% | n.a |
| Return on Equity | -164.42% | 47.91% | 54.88% | n.a |
| Activity Ratios | ||||
| Accounts Payable Turnover | 9.21 | 12.17 | 12.17 | n.a |
| Payment Days | 27 | 28 | 26 | n.a |
| Total Asset Turnover | 5.20 | 5.83 | 3.81 | n.a |
| Debt Ratios | ||||
| Debt to Net Worth | 0.35 | 0.21 | 0.13 | n.a |
| Current Liab. to Liab. | 1.00 | 1.00 | 1.00 | n.a |
| Liquidity Ratios | ||||
| Net Working Capital | $4,730 | $18,440 | $50,161 | n.a |
| Interest Coverage | 0.00 | 0.00 | 0.00 | n.a |
| Additional Ratios | ||||
| Assets to Sales | 0.19 | 0.17 | 0.26 | n.a |
| Current Debt/Total Assets | 26% | 17% | 11% | n.a |
| Acid Test | 2.07 | 4.57 | 8.37 | n.a |
| Sales/Net Worth | 7.01 | 7.06 | 4.29 | n.a |
| Dividend Payout | 0.00 | 0.00 | 0.00 | n.a |
Appendix
| Sales Forecast | |||||||||||||
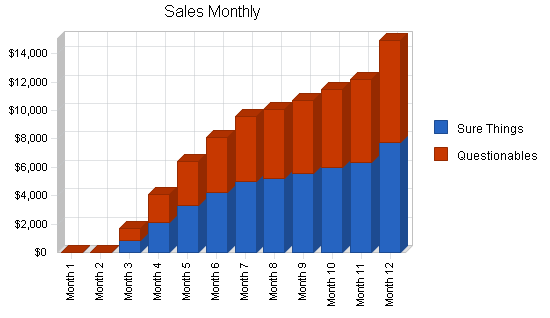
| Month 1 | Month 2 | Month 3 | Month 4 | Month 5 | Month 6 | Month 7 | Month 8 | Month 9 | Month 10 | Month 11 | Month 12 | ||
| Sales | |||||||||||||
| Sure Things | 0% | $0 | $0 | $878 | $2,132 | $3,323 | $4,234 | $4,989 | $5,234 | $5,565 | $5,989 | $6,343 | $7,767 |
| Questionables | 0% | $0 | $0 | $808 | $1,961 | $3,057 | $3,895 | $4,590 | $4,815 | $5,120 | $5,510 | $5,836 | $7,146 |
| Total Sales | $0 | $0 | $1,686 | $4,093 | $6,380 | $8,129 | $9,579 | $10,049 | $10,685 | $11,499 | $12,179 | $14,913 | |
| Direct Cost of Sales | Month 1 | Month 2 | Month 3 | Month 4 | Month 5 | Month 6 | Month 7 | Month 8 | Month 9 | Month 10 | Month 11 | Month 12 | |
| Sure Things | $0 | $0 | $123 | $298 | $465 | $593 | $698 | $733 | $779 | $838 | $888 | $1,087 | |
| Questionables | $0 | $0 | $113 | $275 | $428 | $545 | $643 | $674 | $717 | $771 | $817 | $1,000 | |
| Subtotal Direct Cost of Sales | $0 | $0 | $236 | $573 | $893 | $1,138 | $1,341 | $1,407 | $1,496 | $1,610 | $1,705 | $2,088 | |
| Personnel Plan | |||||||||||||
| Month 1 | Month 2 | Month 3 | Month 4 | Month 5 | Month 6 | Month 7 | Month 8 | Month 9 | Month 10 | Month 11 | Month 12 | ||
| Steve | 0% | $2,000 | $2,000 | $2,000 | $2,000 | $2,000 | $2,000 | $2,000 | $2,000 | $2,000 | $2,000 | $2,000 | $2,000 |
| Researcher | 0% | $0 | $1,500 | $1,500 | $1,500 | $1,500 | $1,500 | $1,500 | $1,500 | $1,500 | $1,500 | $1,500 | $1,500 |
| Account Manager | 0% | $0 | $0 | $0 | $1,500 | $1,500 | $1,500 | $1,500 | $1,500 | $1,500 | $1,500 | $1,500 | $1,500 |
| Account Manager | 0% | $0 | $0 | $0 | $1,500 | $1,500 | $1,500 | $1,500 | $1,500 | $1,500 | $1,500 | $1,500 | $1,500 |
| Total People | 1 | 2 | 2 | 4 | 4 | 4 | 4 | 4 | 4 | 4 | 4 | 4 | |
| Total Payroll | $2,000 | $3,500 | $3,500 | $6,500 | $6,500 | $6,500 | $6,500 | $6,500 | $6,500 | $6,500 | $6,500 | $6,500 | |
| General Assumptions | |||||||||||||
| Month 1 | Month 2 | Month 3 | Month 4 | Month 5 | Month 6 | Month 7 | Month 8 | Month 9 | Month 10 | Month 11 | Month 12 | ||
| Plan Month | 1 | 2 | 3 | 4 | 5 | 6 | 7 | 8 | 9 | 10 | 11 | 12 | |
| Current Interest Rate | 10.00% | 10.00% | 10.00% | 10.00% | 10.00% | 10.00% | 10.00% | 10.00% | 10.00% | 10.00% | 10.00% | 10.00% | |
| Long-term Interest Rate | 10.00% | 10.00% | 10.00% | 10.00% | 10.00% | 10.00% | 10.00% | 10.00% | 10.00% | 10.00% | 10.00% | 10.00% | |
| Tax Rate | 30.00% | 30.00% | 30.00% | 30.00% | 30.00% | 30.00% | 30.00% | 30.00% | 30.00% | 30.00% | 30.00% | 30.00% | |
| Other | 0 | 0 | 0 | 0 | 0 | 0 | 0 | 0 | 0 | 0 | 0 | 0 | |
| Pro Forma Profit and Loss | |||||||||||||
| Month 1 | Month 2 | Month 3 | Month 4 | Month 5 | Month 6 | Month 7 | Month 8 | Month 9 | Month 10 | Month 11 | Month 12 | ||
| Sales | $0 | $0 | $1,686 | $4,093 | $6,380 | $8,129 | $9,579 | $10,049 | $10,685 | $11,499 | $12,179 | $14,913 | |
| Direct Cost of Sales | $0 | $0 | $236 | $573 | $893 | $1,138 | $1,341 | $1,407 | $1,496 | $1,610 | $1,705 | $2,088 | |
| Other Costs of Sales | $0 | $0 | $0 | $0 | $0 | $0 | $0 | $0 | $0 | $0 | $0 | $0 | |
| Total Cost of Sales | $0 | $0 | $236 | $573 | $893 | $1,138 | $1,341 | $1,407 | $1,496 | $1,610 | $1,705 | $2,088 | |
| Gross Margin | $0 | $0 | $1,450 | $3,520 | $5,487 | $6,991 | $8,238 | $8,642 | $9,189 | $9,889 | $10,474 | $12,825 | |
| Gross Margin % | 0.00% | 0.00% | 86.00% | 86.00% | 86.00% | 86.00% | 86.00% | 86.00% | 86.00% | 86.00% | 86.00% | 86.00% | |
| Expenses | |||||||||||||
| Payroll | $2,000 | $3,500 | $3,500 | $6,500 | $6,500 | $6,500 | $6,500 | $6,500 | $6,500 | $6,500 | $6,500 | $6,500 | |
| Sales and Marketing and Other Expenses | $350 | $350 | $350 | $350 | $350 | $350 | $350 | $350 | $350 | $350 | $350 | $350 | |
| Depreciation | $167 | $167 | $167 | $167 | $167 | $167 | $167 | $167 | $167 | $167 | $167 | $167 | |
| Rent | $600 | $600 | $600 | $600 | $600 | $600 | $600 | $600 | $600 | $600 | $600 | $600 | |
| Utilities | $200 | $200 | $200 | $200 | $200 | $200 | $200 | $200 | $200 | $200 | $200 | $200 | |
| Insurance | $200 | $200 | $200 | $200 | $200 | $200 | $200 | $200 | $200 | $200 | $200 | $200 | |
| Payroll Taxes | 15% | $300 | $525 | $525 | $975 | $975 | $975 | $975 | $975 | $975 | $975 | $975 | $975 |
| Other | $150 | $150 | $150 | $150 | $150 | $150 | $150 | $150 | $150 | $150 | $150 | $150 | |
| Total Operating Expenses | $3,967 | $5,692 | $5,692 | $9,142 | $9,142 | $9,142 | $9,142 | $9,142 | $9,142 | $9,142 | $9,142 | $9,142 | |
| Profit Before Interest and Taxes | ($3,967) | ($5,692) | ($4,242) | ($5,622) | ($3,655) | ($2,151) | ($904) | ($500) | $47 | $747 | $1,332 | $3,683 | |
| EBITDA | ($3,800) | ($5,525) | ($4,075) | ($5,455) | ($3,488) | ($1,984) | ($737) | ($333) | $214 | $914 | $1,499 | $3,850 | |
| Interest Expense | $0 | $0 | $0 | $0 | $0 | $0 | $0 | $0 | $0 | $0 | $0 | $0 | |
| Taxes Incurred | $0 | $0 | $0 | $0 | $0 | $0 | $0 | $0 | $0 | $0 | $0 | $0 | |
| Net Profit | ($3,967) | ($5,692) | ($4,242) | ($5,622) | ($3,655) | ($2,151) | ($904) | ($500) | $47 | $747 | $1,332 | $3,683 | |
| Net Profit/Sales | 0.00% | 0.00% | -251.65% | -137.33% | -57.29% | -26.46% | -9.44% | -4.97% | 0.44% | 6.50% | 10.93% | 24.70% | |
| Pro Forma Cash Flow | |||||||||||||
| Month 1 | Month 2 | Month 3 | Month 4 | Month 5 | Month 6 | Month 7 | Month 8 | Month 9 | Month 10 | Month 11 | Month 12 | ||
| Cash Received | |||||||||||||
| Cash from Operations | |||||||||||||
| Cash Sales | $0 | $0 | $1,686 | $4,093 | $6,380 | $8,129 | $9,579 | $10,049 | $10,685 | $11,499 | $12,179 | $14,913 | |
| Subtotal Cash from Operations | $0 | $0 | $1,686 | $4,093 | $6,380 | $8,129 | $9,579 | $10,049 | $10,685 | $11,499 | $12,179 | $14,913 | |
| Additional Cash Received | |||||||||||||
| Sales Tax, VAT, HST/GST Received | 0.00% | $0 | $0 | $0 | $0 | $0 | $0 | $0 | $0 | $0 | $0 | $0 | $0 |
| New Current Borrowing | $0 | $0 | $0 | $0 | $0 | $0 | $0 | $0 | $0 | $0 | $0 | $0 | |
| New Other Liabilities (interest-free) | $0 | $0 | $0 | $0 | $0 | $0 | $0 | $0 | $0 | $0 | $0 | $0 | |
| New Long-term Liabilities | $0 | $0 | $0 | $0 | $0 | $0 | $0 | $0 | $0 | $0 | $0 | $0 | |
| Sales of Other Current Assets | $0 | $0 | $0 | $0 | $0 | $0 | $0 | $0 | $0 | $0 | $0 | $0 | |
| Sales of Long-term Assets | $0 | $0 | $0 | $0 | $0 | $0 | $0 | $0 | $0 | $0 | $0 | $0 | |
| New Investment Received | $0 | $0 | $0 | $0 | $0 | $0 | $0 | $0 | $0 | $0 | $0 | $0 | |
| Subtotal Cash Received | $0 | $0 | $1,686 | $4,093 | $6,380 | $8,129 | $9,579 | $10,049 | $10,685 | $11,499 | $12,179 | $14,913 | |
| Expenditures | Month 1 | Month 2 | Month 3 | Month 4 | Month 5 | Month 6 | Month 7 | Month 8 | Month 9 | Month 10 | Month 11 | Month 12 | |
| Expenditures from Operations | |||||||||||||
| Cash Spending | $2,000 | $3,500 | $3,500 | $6,500 | $6,500 | $6,500 | $6,500 | $6,500 | $6,500 | $6,500 | $6,500 | $6,500 | |
| Bill Payments | $60 | $1,808 | $2,033 | $2,287 | $3,059 | $3,376 | $3,620 | $3,818 | $3,885 | $3,975 | $4,088 | $4,193 | |
| Subtotal Spent on Operations | $2,060 | $5,308 | $5,533 | $8,787 | $9,559 | $9,876 | $10,120 | $10,318 | $10,385 | $10,475 | $10,588 | $10,693 | |
| Additional Cash Spent | |||||||||||||
| Sales Tax, VAT, HST/GST Paid Out | $0 | $0 | $0 | $0 | $0 | $0 | $0 | $0 | $0 | $0 | $0 | $0 | |
| Principal Repayment of Current Borrowing | $0 | $0 | $0 | $0 | $0 | $0 | $0 | $0 | $0 | $0 | $0 | $0 | |
| Other Liabilities Principal Repayment | $0 | $0 | $0 | $0 | $0 | $0 | $0 | $0 | $0 | $0 | $0 | $0 | |
| Long-term Liabilities Principal Repayment | $0 | $0 | $0 | $0 | $0 | $0 | $0 | $0 | $0 | $0 | $0 | $0 | |
| Purchase Other Current Assets | $0 | $0 | $0 | $0 | $0 | $0 | $0 | $0 | $0 | $0 | $0 | $0 | |
| Purchase Long-term Assets | $0 | $0 | $0 | $0 | $0 | $0 | $0 | $0 | $0 | $0 | $0 | $0 | |
| Dividends | $0 | $0 | $0 | $0 | $0 | $0 | $0 | $0 | $0 | $0 | $0 | $0 | |
| Subtotal Cash Spent | $2,060 | $5,308 | $5,533 | $8,787 | $9,559 | $9,876 | $10,120 | $10,318 | $10,385 | $10,475 | $10,588 | $10,693 | |
| Net Cash Flow | ($2,060) | ($5,308) | ($3,847) | ($4,694) | ($3,179) | ($1,747) | ($541) | ($269) | $300 | $1,024 | $1,591 | $4,220 | |
| Cash Balance | $20,290 | $14,983 | $11,135 | $6,442 | $3,263 | $1,516 | $975 | $706 | $1,006 | $2,030 | $3,621 | $7,841 | |
| Pro Forma Balance Sheet | |||||||||||||
| Month 1 | Month 2 | Month 3 | Month 4 | Month 5 | Month 6 | Month 7 | Month 8 | Month 9 | Month 10 | Month 11 | Month 12 | ||
| Assets | Starting Balances | ||||||||||||
| Current Assets | |||||||||||||
| Cash | $22,350 | $20,290 | $14,983 | $11,135 | $6,442 | $3,263 | $1,516 | $975 | $706 | $1,006 | $2,030 | $3,621 | $7,841 |
| Other Current Assets | $1,300 | $1,300 | $1,300 | $1,300 | $1,300 | $1,300 | $1,300 | $1,300 | $1,300 | $1,300 | $1,300 | $1,300 | $1,300 |
| Total Current Assets | $23,650 | $21,590 | $16,283 | $12,435 | $7,742 | $4,563 | $2,816 | $2,275 | $2,006 | $2,306 | $3,330 | $4,921 | $9,141 |
| Long-term Assets | |||||||||||||
| Long-term Assets | $10,000 | $10,000 | $10,000 | $10,000 | $10,000 | $10,000 | $10,000 | $10,000 | $10,000 | $10,000 | $10,000 | $10,000 | $10,000 |
| Accumulated Depreciation | $0 | $167 | $334 | $501 | $668 | $835 | $1,002 | $1,169 | $1,336 | $1,503 | $1,670 | $1,837 | $2,004 |
| Total Long-term Assets | $10,000 | $9,833 | $9,666 | $9,499 | $9,332 | $9,165 | $8,998 | $8,831 | $8,664 | $8,497 | $8,330 | $8,163 | $7,996 |
| Total Assets | $33,650 | $31,423 | $25,949 | $21,934 | $17,074 | $13,728 | $11,814 | $11,106 | $10,670 | $10,803 | $11,660 | $13,084 | $17,137 |
| Liabilities and Capital | Month 1 | Month 2 | Month 3 | Month 4 | Month 5 | Month 6 | Month 7 | Month 8 | Month 9 | Month 10 | Month 11 | Month 12 | |
| Current Liabilities | |||||||||||||
| Accounts Payable | $0 | $1,740 | $1,958 | $2,186 | $2,946 | $3,256 | $3,493 | $3,689 | $3,753 | $3,839 | $3,949 | $4,041 | $4,411 |
| Current Borrowing | $0 | $0 | $0 | $0 | $0 | $0 | $0 | $0 | $0 | $0 | $0 | $0 | $0 |
| Other Current Liabilities | $0 | $0 | $0 | $0 | $0 | $0 | $0 | $0 | $0 | $0 | $0 | $0 | $0 |
| Subtotal Current Liabilities | $0 | $1,740 | $1,958 | $2,186 | $2,946 | $3,256 | $3,493 | $3,689 | $3,753 | $3,839 | $3,949 | $4,041 | $4,411 |
| Long-term Liabilities | $0 | $0 | $0 | $0 | $0 | $0 | $0 | $0 | $0 | $0 | $0 | $0 | $0 |
| Total Liabilities | $0 | $1,740 | $1,958 | $2,186 | $2,946 | $3,256 | $3,493 | $3,689 | $3,753 | $3,839 | $3,949 | $4,041 | $4,411 |
| Paid-in Capital | $45,000 | $45,000 | $45,000 | $45,000 | $45,000 | $45,000 | $45,000 | $45,000 | $45,000 | $45,000 | $45,000 | $45,000 | $45,000 |
| Retained Earnings | ($11,350) | ($11,350) | ($11,350) | ($11,350) | ($11,350) | ($11,350) | ($11,350) | ($11,350) | ($11,350) | ($11,350) | ($11,350) | ($11,350) | ($11,350) |
| Earnings | $0 | ($3,967) | ($9,659) | ($13,901) | ($19,523) | ($23,178) | ($25,329) | ($26,233) | ($26,733) | ($26,686) | ($25,939) | ($24,607) | ($20,924) |
| Total Capital | $33,650 | $29,683 | $23,991 | $19,749 | $14,127 | $10,472 | $8,321 | $7,417 | $6,917 | $6,964 | $7,711 | $9,043 | $12,726 |
| Total Liabilities and Capital | $33,650 | $31,423 | $25,949 | $21,934 | $17,074 | $13,728 | $11,814 | $11,106 | $10,670 | $10,803 | $11,660 | $13,084 | $17,137 |
| Net Worth | $33,650 | $29,683 | $23,991 | $19,749 | $14,127 | $10,472 | $8,321 | $7,417 | $6,917 | $6,964 | $7,711 | $9,043 | $12,726 |

