
Blue Sky Satellite Communications
Executive Summary
Introduction
Blue Sky Satellite Communications CC (Blue Sky) is a communications solutions and satellite service provider in Africa with its operations base in South Africa. The company provides both satellite phones and terminals plus airtime packages customized to the client’s needs.
By focusing on its strengths, its key customers, and the underlying values they need, and the introduction of broadband technology, Blue Sky Satellite Communications will meet the following goals: increase sales to more than $20 million in three years, improving the gross margin on sales to greater than 30%, and improve inventory turnover to eight turns by Year 3.
This business plan leads the way. It renews our vision and strategic focus of adding value to our target market segments: the corporate business and high-end home office users, in our horizontal market. It also provides the step-by-step plan for improving our sales, gross margin, and profitability.
The Company
In 1996, Pedro M G Camacho started “Hyper Parts Com Division” after purchasing a satellite phone from COMSAT. He was so impressed with its abilities and potential that he decided to start his own satellite communications company. In 1998, the firm changed its name to Blue Sky Satellite Communications. It has since had two good years of legal trade, with the prospect of enormous growth. As Pedro saw Inmarsat as a niche market and reacted well to it, the same outlook has been given to VSAT, as it is the next logical step in the development of the satellite communications industry.
Blue Sky Satellite Communications is built on the assumption that the management of satellite technology and the development of broadband services will be the most important step in communication since the invention of the telephone. As a service provider for Inmarsat and VSAT services, we have placed our selves at the forefront of the most unconnected continent in the world, Africa. Our goal is to create as many links in Africa in the shortest space of time. This is to be achieved by partnering up with local telecommunication companies, be they private or government run.
In order to implement our goals we will focus on the following keys to success; increase Inmarsat airtime usage, develop the VSAT market, increase marketing in Africa, outsource quality services, introduce better value-added services to end user, and maintain and increase customer services.
Blue Sky Satellite Communications is located in Bedfordview,South Africa. It is only 15 minutes from the Johanessburg International Airport, and 15 minutes from Sandton, a suburb of Johanessburg.
The firm presently consists of 4 employees under 1 director. In the near future, the company plans to increase the company size by at least 20 people. The main additions will be in sales personnel, in-house customer support which would run constantly (24-7), and a technical support department. Marketing and promotions are outsourced to specialized firms.
We source our product from different Land Earth Stations and various equipment manufactures. In most cases, we deal directly with the manufacturer and service supplier.
The Market
The growth in the use of the Internet for sending messages and other information has made our products and services one of the most sought after commodities around. With the advent of broadband, we expect the growth to be exponential, more and more people and corporations will invest in faster and better communications systems to make them more productive and to show a better bottom line.
The satellite services market is worth an estimated $12 billion in Year 1 for the African and Middle east markets, and there is a projected growth of 20% per year. Blue Sky aims to tap into this market, and expects to be able to capture a 10-20% market share.
The projected market growth for the Telecom’s industry has been one of the most highlighted aspects of new business in the marketplace today. With the coming of age of the new broadband services and the privatization of many Telecom companies (which were previously run by the government), we see that growth is going to far surpass any projection that has been made in the past.
We shall provide our customers with systems that allow them to become more productive through offering two types of hardware. Inmarsat products, such as the Mini-M Sat Phone and the M4 Global Area Network terminal, are poised to maintain a growth pattern over the next 24 months. The re-launch of the Iridium product will also impact the market, and we are in good position to take advantage of this opportunity. The VSAT market has just appeared last year, and the sentiment is that it will grow even further in Year 1 and Year 2.
Blue Sky has a number of local competitors. They provide us with the ongoing determination for the provision of better customer relations. We learn from their mistakes, and have kept a good relationship with them.These companies are : African Satellite Corporation, Pertec International, Grintek Telecom, and Station Africa. In order to successfully compete with these companies Blue Sky has focused on the future trends in the industry to position itself to become the dominate company in this industry. Some of the most important trends are:
To maintain the recurring monthly income in top form, all customers will require maximum attention through strong customer service. The customer service center and the Internet interactive chat will account for many of the solutions offered to customers for fast service.
The most obvious and important trend in the market is declining prices. This has been true for years, but the trend seems to be accelerating. We see the major manufacturers and suppliers putting systems together with amazing specs–more power, more speed, and more bandwidth.
Another trend is ever-greater connectivity. Everybody wants to get onto the Internet, and every small office wants a LAN. A lot of small offices want their LAN connected to the Internet. It will be the challenge of Blue Sky to offer customized service packages with all the desired features at a competitive price.
The company is focusing on the small and large businesses that need a wide variety of services packages that have lower costs per airtime than other competitors.
Strategy and Implementation
- We aim to emphasize service and support. Blue Sky does not just sell the service to the client and leave it at that. We will communicate with the client on an ongoing basis with important information about the product or service which has been delivered.
- We aim to build a long-term relationship with the customer. As recurring income is the aim of this business, we need to maintain as many clients as is possible. This means that we have to have constant contact with our clients. This is achieved by sending out newsletters and emails so that they are kept up-to-date with all that is happening in the marketplace.
- Focus on target markets. Having a goal and focus on a certain market segment will make Blue Sky successful. As we have been in the business for many years, we understand the constant changes in requirements, and, due to a lean management structure, we are able to make the required decisions on new markets rather quickly and efficiently. This then lends itself to have the necessary focus on the market segment as its’ needs change.
- Differentiate and fulfill the promise. We aim to be different from other service providers. We want to be the household name in Africa when it comes to satellite services of any sort. We want to provide pre-paid services and rural telephony and get involved in the education of the users and sub-users of our products. We want to meet all our promises and go the extra mile for those who need it most.

Financial Projections
The company expects to earn $62.2 million by year three with a gross margin of 31.7%. Controlled SG&A costs will create a very strong net margin. Over the next three years, the company will be investing $6.2 million in further long-term assets in order to achieve a regional presence in Africa.
1.1 Mission
Blue Sky Satellite Communications is built on the assumption that the management of satellite technology and the development of broadband services will be the most important step in communication since the invention of the telephone. As a service provider for Inmarsat and VSAT services, we have placed our selves at the forefront of the most unconnected continent in the world, Africa. Our goal is to create as many links in Africa in the shortest space of time. This is to be achieved by partnering up with local telecommunication companies, be they private or government run. In so doing, we can offer all our customers the most legal route to high quality communication wherever they are.
Blue Sky Satellite Communications, bringing satellite communications down to earth.
1.2 Keys to Success
- Increase Inmarsat airtime usage.
- Develop the VSAT market.
- Increase marketing in Africa.
- Outsource quality services.
- Introduce better value-added services to end user.
- Maintain and increase customer services.
1.3 Objectives
- Sales increasing to more than $20 million by the third year.
- Bring gross margin up to above 30%, and maintain that level.
- Sell $4 million of service, support, and training by Year 2.
- Improve inventory turnover to six turns next year, seven in Year 2, and eight in Year 3.

Company Summary
Blue Sky is an Inmarsat-based company with a new focus for the broadband market and is well position so to be able to fulfill this objective. By means of marketing during the previous two years, Blue Sky was able to expand its market share by 20%. We plan on improving on this figure in Year 1.
2.1 Company Ownership
Blue Sky was legally registered in 1998 when it became apparent that it had grown too much to continue to be overlooked by the authorities. It was the foresight of Pedro M G Camacho, the sole owner and only member of the corporation, to start offering Inmarsat services in 1996.
2.2 Company History
In 1996, Pedro M G Camacho contacted COMSAT in the USA for the purchase of a satellite phone, via the Internet. The said phone was sent and two weeks later he was contacted by COMSAT. It was then that “Hyper Parts Com Division” came into being. In 1998, it changed its name to Blue Sky Satellite Communications. It has since had two good years of legal trade, with the prospect of enormous growth. As Pedro saw Inmarsat as a niche market and reacted well to it, the same outlook has been given to VSAT, it is the next logical step in the equation. The Year 1 will indeed be an odyssey.

| Past Performance | |||
| 1998 | 1999 | 2000 | |
| Sales | $184,251 | $667,425 | $1,748,654 |
| Gross Margin | $86,700 | $195,887 | $507,110 |
| Gross Margin % | 47.06% | 29.35% | 29.00% |
| Operating Expenses | $77,890 | $185,531 | $620,772 |
| Collection Period (days) | 64 | 38 | 0 |
| Inventory Turnover | 0.00 | 0.00 | 0.00 |
| Balance Sheet | |||
| 1998 | 1999 | 2000 | |
| Current Assets | |||
| Cash | $10,257 | $11,773 | $30,776 |
| Accounts Receivable | $10,518 | $41,447 | $108,591 |
| Inventory | $59,310 | $35,279 | $96,176 |
| Other Current Assets | $18,000 | $22,231 | $32,800 |
| Total Current Assets | $98,085 | $110,730 | $268,344 |
| Long-term Assets | |||
| Long-term Assets | $14,858 | $25,489 | $43,586 |
| Accumulated Depreciation | $1,500 | $2,750 | $7,250 |
| Total Long-term Assets | $13,358 | $22,739 | $36,336 |
| Total Assets | $111,442 | $133,469 | $304,680 |
| Current Liabilities | |||
| Accounts Payable | $5,263 | $23,068 | $34,678 |
| Current Borrowing | $0 | $5,000 | $5,000 |
| Other Current Liabilities (interest free) | $0 | $0 | $10,000 |
| Total Current Liabilities | $5,263 | $28,068 | $49,678 |
| Long-term Liabilities | $20,000 | $1,500,000 | $6,000,000 |
| Total Liabilities | $25,263 | $1,528,068 | $6,049,678 |
| Paid-in Capital | $290,000 | $450,000 | $140,000 |
| Retained Earnings | ($202,391) | ($1,848,186) | ($5,889,869) |
| Earnings | ($1,429) | $3,587 | $4,871 |
| Total Capital | $86,180 | ($1,394,599) | ($5,744,998) |
| Total Capital and Liabilities | $111,442 | $133,469 | $304,680 |
| Other Inputs | |||
| Payment Days | 45 | 45 | 45 |
| Sales on Credit | $60,000 | $250,000 | $0 |
| Receivables Turnover | 5.70 | 6.03 | 0.00 |
2.3 Company Locations and Facilities
Blue Sky Satellite Communications is located in Bedfordview,South Africa. It is only 15 minutes from the Johanessburg International Airport, and 15 minutes from Sandton, a suburb of Johanessburg.
Products and Services
Services
- Inmarsat Services ( Telenor, France Telecom, Stratos, Singapore Telecom, Comsat).
- VSAT services (Red Wing, ACC).
- Lease procurement.
- License negotiations.
- Logistical services.
Products
- Nera
- Thrane & Thrane
- Motorola
- Kyocera
- Paradise Data Modems
- Gilat
- Hughes
- Siemens
3.1 Competitive Comparison
Blue Sky does have competitors. They provide us with the ongoing determination for the provision of better customer relations. We learn from their mistakes, and have kept a good relationship with them.
These companies are called: African Satellite Corporation, Pertec International, Grintek Telecom, and Station Africa. These are the local companies that also provide satellite communications.
3.2 Fulfillment
We source our product from different Land Earth Stations and various equipment manufactures. These have all been mentioned already. In most cases, we deal directly with the manufacturer and service supplier.
3.3 Technology
The growth in the use of the Internet for sending messages and other information has made our products and services one of the most sought after commodities around. With the advent of broadband, we expect the growth to be exponential, more and more people and corporations will invest in faster and better communications systems to make them more productive and to show a better bottom line.
3.4 Future Products and Services
The future of Global Mobile Personal Communications via Satellite (GMPCS) has to be hand-held units. Although these have been plagued by some failures, the new Iridium company may just be what the industry needs. The new Gallium Nitride (GaN) terminal from Inmarsat that will deliver 128Kbps and the new broadband services from Inmarsat in 2004 will see the VSAT of today shrink in size and price.
Service in the future will be the most important aspect of the business. To maintain the recurring monthly income in top form, all customers will require maximum attention. The customer service center and the Internet interactive chat will account for many of the solutions offered to customers for fast service.
Market Analysis Summary
The satellite services market is worth an estimated $12 billion in 2001 for the African and Middle east markets, and there is a projected growth of 20% per year. Blue Sky aims to tap into this market, and expects to be able to capture a 10-20% market share.
Inmarsat products, such as the Mini-M Sat Phone and the M4 Global Area Network terminal, are poised to maintain a growth pattern over the next 24 months. The re-launch of the Iridium product will also impact the market, and we are in good position to take advantage of this opportunity.
The VSAT market has just appeared in 2000, and the sentiment is that it will grow even further in 2001 and 2002. We already have a number of proposals in the market which should materialize in the new year.
4.1 Market Segmentation
In the satellite hardware industry we find that Inmarsat products are currently the entry-level equipment. The sales in this type of product have historically been very good. However, these will taper off as new and smaller phones from Global Star and New Iridium hit the market. VSAT is an expensive product and is proprietory to a satellite, as is Inmarsat and Iridium. Although the sales in this VSAT market are fewer, the margins are large enough to justify the time and effort, the monthly recurring income is there, and most of the time, part of the usage is pre-paid for several years in advance.
Airtime customers are those that we take away from other service providers by offering lower rates on their current airtime. At times we will sell at cost just to keep up the volume so we make the profit from the discount the networks give to us.

| Market Analysis | |||||||
| 2001 | 2002 | 2003 | 2004 | 2005 | |||
| Potential Customers | Growth | CAGR | |||||
| Inmarsat | 40% | 300 | 156 | 218 | 305 | 427 | 9.23% |
| New Iridium | 300% | 300 | 1,200 | 4,800 | 19,200 | 76,800 | 300.00% |
| VSAT | 70% | 400 | 680 | 1,156 | 1,965 | 3,341 | 70.00% |
| Airtime: All | 200% | 100,000 | 300,000 | 900,000 | 2,700,000 | 8,100,000 | 200.00% |
| Total | 200.00% | 101,000 | 302,036 | 906,174 | 2,721,470 | 8,180,568 | 200.00% |
4.2 Target Market Segment Strategy
Our choice of target markets is strategic. We assume that it reflects our strengths and weaknesses. We are not selling to the self-reliant users, because they buy equipment as appliances based on features and price. Instead, we are selling to the service-seeking users whose needs match our strengths and weaknesses.
Regarding the small business segment, we are looking for the types of small business that appreciate our value-added services enough to pay for them, but aren’t big enough to have experts in-house, on payroll or staff.
4.2.1 Market Trends
The most obvious and important trend in the market is declining prices. This has been true for years, but the trend seems to be accelerating. We see the major manufacturers and suppliers putting systems together with amazing specs–more power, more speed, and more bandwidth.
Another trend is ever-greater connectivity. Everybody wants to get onto the Internet, and every small office wants a LAN. A lot of small offices want their LAN connected to the Internet.
4.2.2 Market Growth
The projected market growth for the Telecom’s industry has been one of the most highlighted aspects of new business in the marketplace today. With the coming of age of the new broadband services and the privatization of many Telecom companies (which were previously run by the government), we see that growth is going to far surpass any projection that has been made in the past.
It must be seen as one of the fastest growing market segments in business today. The recent mergers and takeovers are a small taste of what is waiting to happen.
4.2.3 Market Needs
Since our target market is the service seeker, the most important market needs are support, service, training, and installation, in that order. One of the key points of our strategy is the focus on target segments that know and understand these needs, and are willing to pay to have them filled.
Strategy and Implementation Summary
- We aim to emphasize service and support. Blue Sky does not just sell the service to the client and leave it at that. We will communicate with the client on an ongoing basis with important information about the product or service which has been delivered.
- We aim to build a long-term relationship with the customer. As recurring income is the aim of this business, we need to maintain as many clients as is possible. This means that we have to have constant contact with our clients. This is achieved by sending out newsletters and emails so that they are kept up-to-date with all that is happening in the marketplace.
- Focus on target markets. Having a goal and focus on a certain market segment will make Blue Sky successful. As we have been in the business for many years, we understand the constant changes in requirements, and, due to a lean management structure, we are able to make the required decisions on new markets rather quickly and efficiently. This then lends itself to have the necessary focus on the market segment as its’ needs change.
- Differentiate and fulfill the promise. We aim to be different from other service providers. We want to be the household name in Africa when it comes to satellite services of any sort. We want to provide pre-paid services and rural telephony and get involved in the education of the users and sub-users of our products. We want to meet all our promises and go the extra mile for those who need it most.
5.1 Competitive Edge
Our competitive edge is our positioning as a strategic ally with our clients, who are clients more than customers. By building a business based on long-standing relationships with satisfied clients, we simultaneously build defenses against competition. The longer the relationship stands, the more we help our clients understand what we offer them and why they need it.
5.2 Sales Strategy
- We need to sell the company, not the product. We sell Blue Sky Satellite Communications, not Inmarsat, Iridium, Gilat, Thrane & Thrane, or Nera, or any of our airtime providers names.
- We have to sell our service and support. The hardware is like the razor, and the support, service, software services, training, and seminars are the razor blades. We need to serve our customers with what they really need.
5.2.1 Sales Forecast
The sales chart and table summarize our ambitious sales forecast–we expect sales to increase.
| Sales Forecast | |||
| 2001 | 2002 | 2003 | |
| Sales | |||
| Inmarsat Hardware | $536,400 | $454,740 | $591,162 |
| VSAT hardware | $19,500,000 | $29,250,000 | $43,875,000 |
| New Iridium Hardware | $492,000 | $885,600 | $1,062,720 |
| Airtime:Vsat,Inmarsat,Iridium | $1,526,000 | $4,578,000 | $13,734,000 |
| Value-added services | $295,000 | $1,475,000 | $2,950,000 |
| Total Sales | $22,349,400 | $36,643,340 | $62,212,882 |
| Direct Cost of Sales | 2001 | 2002 | 2003 |
| Inmarsat Hardware | $380,645 | $322,684 | $419,489 |
| VSAT hardware | $14,468,006 | $20,500,000 | $31,250,000 |
| New Iridium Hardware | $258,500 | $462,294 | $558,353 |
| Airtime:Vsat,Inmarsat,Iridium | $990,500 | $2,971,580 | $8,914,739 |
| Value-added services | $136,500 | $682,483 | $1,364,965 |
| Subtotal Direct Cost of Sales | $16,234,151 | $24,939,040 | $42,507,546 |
Management Summary
Blue Sky is owned and operated by its founders. It is a small company with a minimum command hierarchy and a maximum of community spirit and cooperation. Despite the loose style, we are still organized by function, and the business is done with logic and order.
6.1 Organizational Structure
The team consists of 4 employees under 1 director.
Our main focus is on sales and efficient billing. Marketing and promotions are outsourced to specialized firms.
6.2 Personnel Plan
The plan with the personnel is to increase the company size at least 20 people. The main additions will be in sales personnel, in-house customer support which would run constantly (24-7), and a technical support department.
| Personnel Plan | |||
| 2001 | 2002 | 2003 | |
| Pedro Camacho | $30,000 | $30,000 | $30,000 |
| Staff | $80,040 | $80,040 | $80,040 |
| Total People | 12 | 12 | 12 |
| Total Payroll | $110,040 | $110,040 | $110,040 |
Financial Plan
The most important element of the financial plan is to have enough cash to be able to implement all the concepts of Blue Sky. This is not like any other conventional business, where stock turnover is the key factor. Here we look at selling as much hardware as possible to be able to increase the amount of airtime sold. The main revenue comes from the margins on the airtime.
7.1 Important Assumptions
The assumptions in the following table are thought to be key to the success of Blue Sky.
| General Assumptions | |||
| 2001 | 2002 | 2003 | |
| Plan Month | 1 | 2 | 3 |
| Current Interest Rate | 5.00% | 5.00% | 5.00% |
| Long-term Interest Rate | 5.00% | 5.00% | 5.00% |
| Tax Rate | 32.75% | 33.00% | 32.75% |
| Other | 0 | 0 | 0 |
7.2 Key Financial Indicators
The chart below shows the benchmarks for the company.

7.3 Projected Profit and Loss
Blue Sky’s projected profit and loss statement is found in the table below. For a monthly projection, please see appendix.

| Pro Forma Profit and Loss | |||
| 2001 | 2002 | 2003 | |
| Sales | $22,349,400 | $36,643,340 | $62,212,882 |
| Direct Cost of Sales | $16,234,151 | $24,939,040 | $42,507,546 |
| Other | $0 | $0 | $0 |
| Total Cost of Sales | $16,234,151 | $24,939,040 | $42,507,546 |
| Gross Margin | $6,115,249 | $11,704,300 | $19,705,336 |
| Gross Margin % | 27.36% | 31.94% | 31.67% |
| Expenses | |||
| Payroll | $110,040 | $110,040 | $110,040 |
| Sales and Marketing and Other Expenses | $74,000 | $574,000 | $831,000 |
| Depreciation | $4,350 | $4,350 | $4,350 |
| Leased Equipment | $8,500 | $20,000 | $40,000 |
| Utilities | $3,600 | $4,000 | $4,200 |
| Insurance | $8,400 | $9,000 | $9,600 |
| Rent | $16,200 | $16,800 | $17,200 |
| Payroll Taxes | $2,201 | $2,201 | $2,201 |
| Other | $0 | $0 | $0 |
| Total Operating Expenses | $227,291 | $740,391 | $1,018,591 |
| Profit Before Interest and Taxes | $5,887,958 | $10,963,909 | $18,686,746 |
| EBITDA | $5,892,308 | $10,968,259 | $18,691,096 |
| Interest Expense | $446,688 | $261,250 | $143,750 |
| Taxes Incurred | $1,795,983 | $3,531,878 | $6,072,831 |
| Net Profit | $3,645,287 | $7,170,782 | $12,470,165 |
| Net Profit/Sales | 16.31% | 19.57% | 20.04% |
7.4 Projected Cash Flow
The cash flow projections for Blue Sky are found in the chart and table below. We will use a $3,000,000 line of credit to finance inventory purchases.

| Pro Forma Cash Flow | |||
| 2001 | 2002 | 2003 | |
| Cash Received | |||
| Cash from Operations | |||
| Cash Sales | $2,234,940 | $3,664,334 | $6,221,288 |
| Cash from Receivables | $19,206,566 | $32,328,895 | $54,828,651 |
| Subtotal Cash from Operations | $21,441,506 | $35,993,229 | $61,049,939 |
| Additional Cash Received | |||
| Sales Tax, VAT, HST/GST Received | $0 | $0 | $0 |
| New Current Borrowing | $3,700,000 | $0 | $0 |
| New Other Liabilities (interest-free) | $0 | $0 | $0 |
| New Long-term Liabilities | $0 | $0 | $0 |
| Sales of Other Current Assets | $0 | $0 | $0 |
| Sales of Long-term Assets | $0 | $0 | $0 |
| New Investment Received | $3,500,000 | $0 | $0 |
| Subtotal Cash Received | $28,641,506 | $35,993,229 | $61,049,939 |
| Expenditures | 2001 | 2002 | 2003 |
| Expenditures from Operations | |||
| Cash Spending | $110,040 | $110,040 | $110,040 |
| Bill Payments | $18,468,456 | $28,321,992 | $48,877,891 |
| Subtotal Spent on Operations | $18,578,496 | $28,432,032 | $48,987,931 |
| Additional Cash Spent | |||
| Sales Tax, VAT, HST/GST Paid Out | $0 | $0 | $0 |
| Principal Repayment of Current Borrowing | $3,005,000 | $350,000 | $350,000 |
| Other Liabilities Principal Repayment | $0 | $0 | $0 |
| Long-term Liabilities Principal Repayment | $300,000 | $2,000,000 | $2,000,000 |
| Purchase Other Current Assets | $500,000 | $0 | $0 |
| Purchase Long-term Assets | $6,000,000 | $200,000 | $0 |
| Dividends | $0 | $0 | $9,000,000 |
| Subtotal Cash Spent | $28,383,496 | $30,982,032 | $60,337,931 |
| Net Cash Flow | $258,010 | $5,011,197 | $712,009 |
| Cash Balance | $288,786 | $5,299,984 | $6,011,992 |
7.5 Projected Balance Sheet
The table below shows Blue Sky’s balance sheet.
| Pro Forma Balance Sheet | |||
| 2001 | 2002 | 2003 | |
| Assets | |||
| Current Assets | |||
| Cash | $288,786 | $5,299,984 | $6,011,992 |
| Accounts Receivable | $1,016,486 | $1,666,596 | $2,829,539 |
| Inventory | $882,664 | $1,355,956 | $2,311,170 |
| Other Current Assets | $532,800 | $532,800 | $532,800 |
| Total Current Assets | $2,720,736 | $8,855,336 | $11,685,501 |
| Long-term Assets | |||
| Long-term Assets | $6,043,586 | $6,243,586 | $6,243,586 |
| Accumulated Depreciation | $11,600 | $15,950 | $20,300 |
| Total Long-term Assets | $6,031,986 | $6,227,636 | $6,223,286 |
| Total Assets | $8,752,722 | $15,082,972 | $17,908,787 |
| Liabilities and Capital | 2001 | 2002 | 2003 |
| Current Liabilities | |||
| Accounts Payable | $942,433 | $2,451,901 | $4,157,551 |
| Current Borrowing | $700,000 | $350,000 | $0 |
| Other Current Liabilities | $10,000 | $10,000 | $10,000 |
| Subtotal Current Liabilities | $1,652,433 | $2,811,901 | $4,167,551 |
| Long-term Liabilities | $5,700,000 | $3,700,000 | $1,700,000 |
| Total Liabilities | $7,352,433 | $6,511,901 | $5,867,551 |
| Paid-in Capital | $3,640,000 | $3,640,000 | $3,640,000 |
| Retained Earnings | ($5,884,998) | ($2,239,711) | ($4,068,929) |
| Earnings | $3,645,287 | $7,170,782 | $12,470,165 |
| Total Capital | $1,400,289 | $8,571,071 | $12,041,235 |
| Total Liabilities and Capital | $8,752,722 | $15,082,972 | $17,908,787 |
| Net Worth | $1,400,289 | $8,571,071 | $12,041,235 |
7.6 Business Ratios
The following table contains ratios from the communication services (4899) industry, as determined by the Standard Industry Classification (SIC) Index.
| Ratio Analysis | ||||
| 2001 | 2002 | 2003 | Industry Profile | |
| Sales Growth | 1178.09% | 63.96% | 69.78% | 4.80% |
| Percent of Total Assets | ||||
| Accounts Receivable | 11.61% | 11.05% | 15.80% | 14.30% |
| Inventory | 10.08% | 8.99% | 12.91% | 2.50% |
| Other Current Assets | 6.09% | 3.53% | 2.98% | 46.50% |
| Total Current Assets | 31.08% | 58.71% | 65.25% | 63.30% |
| Long-term Assets | 68.92% | 41.29% | 34.75% | 36.70% |
| Total Assets | 100.00% | 100.00% | 100.00% | 100.00% |
| Current Liabilities | 18.88% | 18.64% | 23.27% | 43.60% |
| Long-term Liabilities | 65.12% | 24.53% | 9.49% | 26.30% |
| Total Liabilities | 84.00% | 43.17% | 32.76% | 69.90% |
| Net Worth | 16.00% | 56.83% | 67.24% | 30.10% |
| Percent of Sales | ||||
| Sales | 100.00% | 100.00% | 100.00% | 100.00% |
| Gross Margin | 27.36% | 31.94% | 31.67% | 57.80% |
| Selling, General & Administrative Expenses | 10.68% | 12.46% | 11.85% | 35.50% |
| Advertising Expenses | 0.04% | 1.36% | 1.21% | 1.00% |
| Profit Before Interest and Taxes | 26.35% | 29.92% | 30.04% | 1.90% |
| Main Ratios | ||||
| Current | 1.65 | 3.15 | 2.80 | 1.17 |
| Quick | 1.11 | 2.67 | 2.25 | 0.95 |
| Total Debt to Total Assets | 84.00% | 43.17% | 32.76% | 69.90% |
| Pre-tax Return on Net Worth | 388.58% | 124.87% | 154.00% | 4.20% |
| Pre-tax Return on Assets | 62.17% | 70.96% | 103.54% | 14.00% |
| Additional Ratios | 2001 | 2002 | 2003 | |
| Net Profit Margin | 16.31% | 19.57% | 20.04% | n.a |
| Return on Equity | 260.32% | 83.66% | 103.56% | n.a |
| Activity Ratios | ||||
| Accounts Receivable Turnover | 19.79 | 19.79 | 19.79 | n.a |
| Collection Days | 59 | 15 | 15 | n.a |
| Inventory Turnover | 7.57 | 22.28 | 23.18 | n.a |
| Accounts Payable Turnover | 20.56 | 12.17 | 12.17 | n.a |
| Payment Days | 27 | 21 | 24 | n.a |
| Total Asset Turnover | 2.55 | 2.43 | 3.47 | n.a |
| Debt Ratios | ||||
| Debt to Net Worth | 5.25 | 0.76 | 0.49 | n.a |
| Current Liab. to Liab. | 0.22 | 0.43 | 0.71 | n.a |
| Liquidity Ratios | ||||
| Net Working Capital | $1,068,303 | $6,043,435 | $7,517,949 | n.a |
| Interest Coverage | 13.18 | 41.97 | 129.99 | n.a |
| Additional Ratios | ||||
| Assets to Sales | 0.39 | 0.41 | 0.29 | n.a |
| Current Debt/Total Assets | 19% | 19% | 23% | n.a |
| Acid Test | 0.50 | 2.07 | 1.57 | n.a |
| Sales/Net Worth | 15.96 | 4.28 | 5.17 | n.a |
| Dividend Payout | 0.00 | 0.00 | 0.72 | n.a |
Appendix
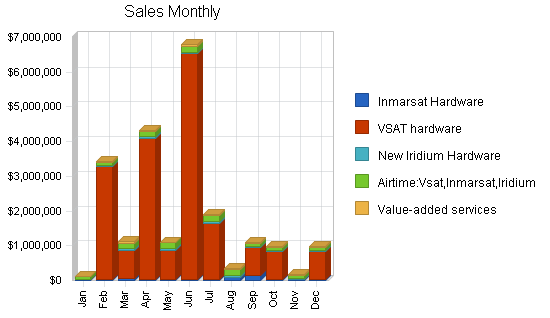
| Sales Forecast | |||||||||||||
| Jan | Feb | Mar | Apr | May | Jun | Jul | Aug | Sep | Oct | Nov | Dec | ||
| Sales | |||||||||||||
| Inmarsat Hardware | 0% | $29,150 | $29,150 | $53,000 | $29,150 | $39,750 | $29,150 | $29,150 | $73,900 | $136,550 | $29,150 | $29,150 | $29,150 |
| VSAT hardware | 0% | $0 | $3,250,000 | $812,500 | $4,062,500 | $812,500 | $6,500,000 | $1,625,000 | $0 | $812,500 | $812,500 | $0 | $812,500 |
| New Iridium Hardware | 0% | $0 | $36,000 | $60,000 | $60,000 | $60,000 | $36,000 | $36,000 | $60,000 | $36,000 | $36,000 | $36,000 | $36,000 |
| Airtime:Vsat,Inmarsat,Iridium | 0% | $81,000 | $81,000 | $150,000 | $150,000 | $180,000 | $180,000 | $185,000 | $195,000 | $81,000 | $81,000 | $81,000 | $81,000 |
| Value-added services | 0% | $15,000 | $30,000 | $45,000 | $20,000 | $15,000 | $50,000 | $40,000 | $15,000 | $20,000 | $15,000 | $15,000 | $15,000 |
| Total Sales | $125,150 | $3,426,150 | $1,120,500 | $4,321,650 | $1,107,250 | $6,795,150 | $1,915,150 | $343,900 | $1,086,050 | $973,650 | $161,150 | $973,650 | |
| Direct Cost of Sales | Jan | Feb | Mar | Apr | May | Jun | Jul | Aug | Sep | Oct | Nov | Dec | |
| Inmarsat Hardware | $20,900 | $20,900 | $38,000 | $20,900 | $28,500 | $20,900 | $20,900 | $51,825 | $95,120 | $20,900 | $20,900 | $20,900 | |
| VSAT hardware | $0 | $2,825,875 | $545,000 | $3,258,000 | $706,522 | $3,600,000 | $1,413,044 | $0 | $706,522 | $706,522 | $0 | $706,522 | |
| New Iridium Hardware | $0 | $25,500 | $42,500 | $38,000 | $38,000 | $25,500 | $25,500 | $38,000 | $25,500 | $0 | $0 | $0 | |
| Airtime:Vsat,Inmarsat,Iridium | $67,500 | $67,500 | $115,000 | $67,500 | $125,500 | $125,000 | $71,500 | $81,000 | $67,500 | $67,500 | $67,500 | $67,500 | |
| Value-added services | $5,000 | $13,000 | $7,500 | $7,500 | $7,500 | $30,000 | $31,000 | $5,000 | $7,500 | $7,500 | $7,500 | $7,500 | |
| Subtotal Direct Cost of Sales | $93,400 | $2,952,775 | $748,000 | $3,391,900 | $906,022 | $3,801,400 | $1,561,944 | $175,825 | $902,142 | $802,422 | $95,900 | $802,422 | |
| Personnel Plan | |||||||||||||
| Jan | Feb | Mar | Apr | May | Jun | Jul | Aug | Sep | Oct | Nov | Dec | ||
| Pedro Camacho | 0% | $2,500 | $2,500 | $2,500 | $2,500 | $2,500 | $2,500 | $2,500 | $2,500 | $2,500 | $2,500 | $2,500 | $2,500 |
| Staff | 0% | $6,670 | $6,670 | $6,670 | $6,670 | $6,670 | $6,670 | $6,670 | $6,670 | $6,670 | $6,670 | $6,670 | $6,670 |
| Total People | 0 | 12 | 12 | 12 | 12 | 12 | 12 | 12 | 12 | 12 | 12 | 12 | |
| Total Payroll | $9,170 | $9,170 | $9,170 | $9,170 | $9,170 | $9,170 | $9,170 | $9,170 | $9,170 | $9,170 | $9,170 | $9,170 | |
| General Assumptions | |||||||||||||
| Jan | Feb | Mar | Apr | May | Jun | Jul | Aug | Sep | Oct | Nov | Dec | ||
| Plan Month | 1 | 2 | 3 | 4 | 5 | 6 | 7 | 8 | 9 | 10 | 11 | 12 | |
| Current Interest Rate | 5.00% | 5.00% | 5.00% | 5.00% | 5.00% | 5.00% | 5.00% | 5.00% | 5.00% | 5.00% | 5.00% | 5.00% | |
| Long-term Interest Rate | 5.00% | 5.00% | 5.00% | 5.00% | 5.00% | 5.00% | 5.00% | 5.00% | 5.00% | 5.00% | 5.00% | 5.00% | |
| Tax Rate | 30.00% | 33.00% | 33.00% | 33.00% | 33.00% | 33.00% | 33.00% | 33.00% | 33.00% | 33.00% | 33.00% | 33.00% | |
| Other | 0 | 0 | 0 | 0 | 0 | 0 | 0 | 0 | 0 | 0 | 0 | 0 | |
| Pro Forma Profit and Loss | |||||||||||||
| Jan | Feb | Mar | Apr | May | Jun | Jul | Aug | Sep | Oct | Nov | Dec | ||
| Sales | $125,150 | $3,426,150 | $1,120,500 | $4,321,650 | $1,107,250 | $6,795,150 | $1,915,150 | $343,900 | $1,086,050 | $973,650 | $161,150 | $973,650 | |
| Direct Cost of Sales | $93,400 | $2,952,775 | $748,000 | $3,391,900 | $906,022 | $3,801,400 | $1,561,944 | $175,825 | $902,142 | $802,422 | $95,900 | $802,422 | |
| Other | $0 | $0 | $0 | $0 | $0 | $0 | $0 | $0 | $0 | $0 | $0 | $0 | |
| Total Cost of Sales | $93,400 | $2,952,775 | $748,000 | $3,391,900 | $906,022 | $3,801,400 | $1,561,944 | $175,825 | $902,142 | $802,422 | $95,900 | $802,422 | |
| Gross Margin | $31,750 | $473,375 | $372,500 | $929,750 | $201,228 | $2,993,750 | $353,206 | $168,075 | $183,908 | $171,228 | $65,250 | $171,228 | |
| Gross Margin % | 25.37% | 13.82% | 33.24% | 21.51% | 18.17% | 44.06% | 18.44% | 48.87% | 16.93% | 17.59% | 40.49% | 17.59% | |
| Expenses | |||||||||||||
| Payroll | $9,170 | $9,170 | $9,170 | $9,170 | $9,170 | $9,170 | $9,170 | $9,170 | $9,170 | $9,170 | $9,170 | $9,170 | |
| Sales and Marketing and Other Expenses | $6,900 | $5,500 | $6,900 | $5,500 | $6,700 | $5,500 | $6,700 | $6,700 | $5,500 | $7,100 | $5,500 | $5,500 | |
| Depreciation | $363 | $363 | $363 | $363 | $363 | $363 | $363 | $363 | $363 | $363 | $363 | $363 | |
| Leased Equipment | $0 | $0 | $2,000 | $0 | $3,000 | $0 | $500 | $0 | $1,000 | $0 | $2,000 | $0 | |
| Utilities | $300 | $300 | $300 | $300 | $300 | $300 | $300 | $300 | $300 | $300 | $300 | $300 | |
| Insurance | $700 | $700 | $700 | $700 | $700 | $700 | $700 | $700 | $700 | $700 | $700 | $700 | |
| Rent | $1,350 | $1,350 | $1,350 | $1,350 | $1,350 | $1,350 | $1,350 | $1,350 | $1,350 | $1,350 | $1,350 | $1,350 | |
| Payroll Taxes | 2% | $183 | $183 | $183 | $183 | $183 | $183 | $183 | $183 | $183 | $183 | $183 | $183 |
| Other | $0 | $0 | $0 | $0 | $0 | $0 | $0 | $0 | $0 | $0 | $0 | $0 | |
| Total Operating Expenses | $18,966 | $17,566 | $20,966 | $17,566 | $21,766 | $17,566 | $19,266 | $18,766 | $18,566 | $19,166 | $19,566 | $17,566 | |
| Profit Before Interest and Taxes | $12,784 | $455,809 | $351,534 | $912,184 | $179,462 | $2,976,184 | $333,940 | $149,309 | $165,342 | $152,062 | $45,684 | $153,662 | |
| EBITDA | $13,147 | $456,172 | $351,897 | $912,547 | $179,825 | $2,976,547 | $334,303 | $149,672 | $165,705 | $152,425 | $46,047 | $154,025 | |
| Interest Expense | $24,917 | $39,396 | $39,292 | $39,188 | $39,917 | $39,813 | $39,708 | $39,604 | $39,500 | $39,396 | $39,292 | $26,667 | |
| Taxes Incurred | ($3,640) | $137,416 | $103,040 | $288,089 | $46,050 | $969,003 | $97,096 | $36,203 | $41,528 | $37,180 | $2,110 | $41,909 | |
| Net Profit | ($8,493) | $278,997 | $209,202 | $584,908 | $93,496 | $1,967,369 | $197,135 | $73,502 | $84,314 | $75,487 | $4,283 | $85,087 | |
| Net Profit/Sales | -6.79% | 8.14% | 18.67% | 13.53% | 8.44% | 28.95% | 10.29% | 21.37% | 7.76% | 7.75% | 2.66% | 8.74% | |
| Pro Forma Cash Flow | |||||||||||||
| Jan | Feb | Mar | Apr | May | Jun | Jul | Aug | Sep | Oct | Nov | Dec | ||
| Cash Received | |||||||||||||
| Cash from Operations | |||||||||||||
| Cash Sales | $12,515 | $342,615 | $112,050 | $432,165 | $110,725 | $679,515 | $191,515 | $34,390 | $108,605 | $97,365 | $16,115 | $97,365 | |
| Cash from Receivables | $54,296 | $58,050 | $211,665 | $3,014,366 | $1,104,485 | $3,793,053 | $1,167,162 | $5,969,235 | $1,676,498 | $331,775 | $974,073 | $851,910 | |
| Subtotal Cash from Operations | $66,811 | $400,665 | $323,715 | $3,446,531 | $1,215,210 | $4,472,568 | $1,358,677 | $6,003,625 | $1,785,103 | $429,140 | $990,188 | $949,275 | |
| Additional Cash Received | |||||||||||||
| Sales Tax, VAT, HST/GST Received | 0.00% | $0 | $0 | $0 | $0 | $0 | $0 | $0 | $0 | $0 | $0 | $0 | $0 |
| New Current Borrowing | $0 | $3,500,000 | $0 | $0 | $200,000 | $0 | $0 | $0 | $0 | $0 | $0 | $0 | |
| New Other Liabilities (interest-free) | $0 | $0 | $0 | $0 | $0 | $0 | $0 | $0 | $0 | $0 | $0 | $0 | |
| New Long-term Liabilities | $0 | $0 | $0 | $0 | $0 | $0 | $0 | $0 | $0 | $0 | $0 | $0 | |
| Sales of Other Current Assets | $0 | $0 | $0 | $0 | $0 | $0 | $0 | $0 | $0 | $0 | $0 | $0 | |
| Sales of Long-term Assets | $0 | $0 | $0 | $0 | $0 | $0 | $0 | $0 | $0 | $0 | $0 | $0 | |
| New Investment Received | $3,500,000 | $0 | $0 | $0 | $0 | $0 | $0 | $0 | $0 | $0 | $0 | $0 | |
| Subtotal Cash Received | $3,566,811 | $3,900,665 | $323,715 | $3,446,531 | $1,415,210 | $4,472,568 | $1,358,677 | $6,003,625 | $1,785,103 | $429,140 | $990,188 | $949,275 | |
| Expenditures | Jan | Feb | Mar | Apr | May | Jun | Jul | Aug | Sep | Oct | Nov | Dec | |
| Expenditures from Operations | |||||||||||||
| Cash Spending | $9,170 | $9,170 | $9,170 | $9,170 | $9,170 | $9,170 | $9,170 | $9,170 | $9,170 | $9,170 | $9,170 | $9,170 | |
| Bill Payments | $39,034 | $335,750 | $6,078,628 | $313,914 | $4,796,246 | $300,751 | $5,973,781 | $144,488 | $85,208 | $94,715 | $223,725 | $82,218 | |
| Subtotal Spent on Operations | $48,204 | $344,920 | $6,087,798 | $323,084 | $4,805,416 | $309,921 | $5,982,951 | $153,658 | $94,378 | $103,885 | $232,895 | $91,388 | |
| Additional Cash Spent | |||||||||||||
| Sales Tax, VAT, HST/GST Paid Out | $0 | $0 | $0 | $0 | $0 | $0 | $0 | $0 | $0 | $0 | $0 | $0 | |
| Principal Repayment of Current Borrowing | $0 | $0 | $0 | $0 | $0 | $0 | $0 | $0 | $0 | $0 | $0 | $3,005,000 | |
| Other Liabilities Principal Repayment | $0 | $0 | $0 | $0 | $0 | $0 | $0 | $0 | $0 | $0 | $0 | $0 | |
| Long-term Liabilities Principal Repayment | $25,000 | $25,000 | $25,000 | $25,000 | $25,000 | $25,000 | $25,000 | $25,000 | $25,000 | $25,000 | $25,000 | $25,000 | |
| Purchase Other Current Assets | $0 | $0 | $0 | $0 | $0 | $0 | $0 | $0 | $0 | $0 | $500,000 | $0 | |
| Purchase Long-term Assets | $0 | $0 | $0 | $0 | $0 | $0 | $0 | $0 | $0 | $0 | $3,000,000 | $3,000,000 | |
| Dividends | $0 | $0 | $0 | $0 | $0 | $0 | $0 | $0 | $0 | $0 | $0 | $0 | |
| Subtotal Cash Spent | $73,204 | $369,920 | $6,112,798 | $348,084 | $4,830,416 | $334,921 | $6,007,951 | $178,658 | $119,378 | $128,885 | $3,757,895 | $6,121,388 | |
| Net Cash Flow | $3,493,607 | $3,530,746 | ($5,789,083) | $3,098,446 | ($3,415,206) | $4,137,647 | ($4,649,274) | $5,824,967 | $1,665,725 | $300,255 | ($2,767,707) | ($5,172,113) | |
| Cash Balance | $3,524,383 | $7,055,129 | $1,266,046 | $4,364,492 | $949,286 | $5,086,933 | $437,659 | $6,262,626 | $7,928,351 | $8,228,606 | $5,460,899 | $288,786 | |
| Pro Forma Balance Sheet | |||||||||||||
| Jan | Feb | Mar | Apr | May | Jun | Jul | Aug | Sep | Oct | Nov | Dec | ||
| Assets | Starting Balances | ||||||||||||
| Current Assets | |||||||||||||
| Cash | $30,776 | $3,524,383 | $7,055,129 | $1,266,046 | $4,364,492 | $949,286 | $5,086,933 | $437,659 | $6,262,626 | $7,928,351 | $8,228,606 | $5,460,899 | $288,786 |
| Accounts Receivable | $108,591 | $166,931 | $3,192,416 | $3,989,201 | $4,864,320 | $4,756,361 | $7,078,943 | $7,635,416 | $1,975,691 | $1,276,638 | $1,821,149 | $992,111 | $1,016,486 |
| Inventory | $96,176 | $102,740 | $3,248,053 | $2,500,053 | $3,731,090 | $2,825,068 | $4,181,540 | $2,619,596 | $2,443,771 | $1,541,629 | $882,664 | $786,764 | $882,664 |
| Other Current Assets | $32,800 | $32,800 | $32,800 | $32,800 | $32,800 | $32,800 | $32,800 | $32,800 | $32,800 | $32,800 | $32,800 | $532,800 | $532,800 |
| Total Current Assets | $268,344 | $3,826,854 | $13,528,397 | $7,788,099 | $12,992,702 | $8,563,515 | $16,380,216 | $10,725,471 | $10,714,888 | $10,779,418 | $10,965,218 | $7,772,574 | $2,720,736 |
| Long-term Assets | |||||||||||||
| Long-term Assets | $43,586 | $43,586 | $43,586 | $43,586 | $43,586 | $43,586 | $43,586 | $43,586 | $43,586 | $43,586 | $43,586 | $3,043,586 | $6,043,586 |
| Accumulated Depreciation | $7,250 | $7,613 | $7,975 | $8,338 | $8,700 | $9,063 | $9,425 | $9,788 | $10,150 | $10,513 | $10,875 | $11,238 | $11,600 |
| Total Long-term Assets | $36,336 | $35,974 | $35,611 | $35,249 | $34,886 | $34,524 | $34,161 | $33,799 | $33,436 | $33,074 | $32,711 | $3,032,349 | $6,031,986 |
| Total Assets | $304,680 | $3,862,827 | $13,564,008 | $7,823,348 | $13,027,588 | $8,598,038 | $16,414,377 | $10,759,269 | $10,748,324 | $10,812,492 | $10,997,929 | $10,804,922 | $8,752,722 |
| Liabilities and Capital | Jan | Feb | Mar | Apr | May | Jun | Jul | Aug | Sep | Oct | Nov | Dec | |
| Current Liabilities | |||||||||||||
| Accounts Payable | $34,678 | $126,319 | $6,073,502 | $148,640 | $4,792,972 | $94,927 | $5,968,896 | $141,654 | $82,206 | $87,059 | $222,010 | $49,720 | $942,433 |
| Current Borrowing | $5,000 | $5,000 | $3,505,000 | $3,505,000 | $3,505,000 | $3,705,000 | $3,705,000 | $3,705,000 | $3,705,000 | $3,705,000 | $3,705,000 | $3,705,000 | $700,000 |
| Other Current Liabilities | $10,000 | $10,000 | $10,000 | $10,000 | $10,000 | $10,000 | $10,000 | $10,000 | $10,000 | $10,000 | $10,000 | $10,000 | $10,000 |
| Subtotal Current Liabilities | $49,678 | $141,319 | $9,588,502 | $3,663,640 | $8,307,972 | $3,809,927 | $9,683,896 | $3,856,654 | $3,797,206 | $3,802,059 | $3,937,010 | $3,764,720 | $1,652,433 |
| Long-term Liabilities | $6,000,000 | $5,975,000 | $5,950,000 | $5,925,000 | $5,900,000 | $5,875,000 | $5,850,000 | $5,825,000 | $5,800,000 | $5,775,000 | $5,750,000 | $5,725,000 | $5,700,000 |
| Total Liabilities | $6,049,678 | $6,116,319 | $15,538,502 | $9,588,640 | $14,207,972 | $9,684,927 | $15,533,896 | $9,681,654 | $9,597,206 | $9,577,059 | $9,687,010 | $9,489,720 | $7,352,433 |
| Paid-in Capital | $140,000 | $3,640,000 | $3,640,000 | $3,640,000 | $3,640,000 | $3,640,000 | $3,640,000 | $3,640,000 | $3,640,000 | $3,640,000 | $3,640,000 | $3,640,000 | $3,640,000 |
| Retained Earnings | ($5,889,869) | ($5,884,998) | ($5,884,998) | ($5,884,998) | ($5,884,998) | ($5,884,998) | ($5,884,998) | ($5,884,998) | ($5,884,998) | ($5,884,998) | ($5,884,998) | ($5,884,998) | ($5,884,998) |
| Earnings | $4,871 | ($8,493) | $270,504 | $479,707 | $1,064,614 | $1,158,110 | $3,125,479 | $3,322,614 | $3,396,116 | $3,480,431 | $3,555,917 | $3,560,200 | $3,645,287 |
| Total Capital | ($5,744,998) | ($2,253,491) | ($1,974,494) | ($1,765,292) | ($1,180,384) | ($1,086,888) | $880,481 | $1,077,616 | $1,151,118 | $1,235,432 | $1,310,919 | $1,315,202 | $1,400,289 |
| Total Liabilities and Capital | $304,680 | $3,862,827 | $13,564,008 | $7,823,348 | $13,027,588 | $8,598,038 | $16,414,377 | $10,759,269 | $10,748,324 | $10,812,492 | $10,997,929 | $10,804,922 | $8,752,722 |
| Net Worth | ($5,744,998) | ($2,253,491) | ($1,974,494) | ($1,765,292) | ($1,180,384) | ($1,086,888) | $880,481 | $1,077,616 | $1,151,118 | $1,235,432 | $1,310,919 | $1,315,202 | $1,400,289 |


