
Salvador's Sauces
Executive Summary
Salvador’s is a manufacturer of authentic Hispanic foods including salsa and chips. Their products are positioned at the high end of the market in terms of both quality and price. Salvador’s has been in business now for three years and has grown in popularity. What was once a business targeting solely the Hispanic community has grown into a business that has far broader appeal.
Salvador’s has several objectives that they will achieve within the next three years. The first is an increase in sales reaching two million dollars by Year 5. Salvador’s also would like gross margins to be above 55%. Salvador’s also hopes to have 40 different outlets that will distribute their product. Lastly, they aim to become known as the premier authentic Hispanic food producer in the area with an ever-expanding geographic distribution area.
Currently, Salvador’s has two main line of products. Their flagship product is their salsa, renowned for its freshness, uniqueness, and quality ingredients. Originally introduced in one temperature, hot, the market demand has asked for milder temperatures and Salvador’s has responded with both a medium and mild version. To compliment their salsa, Salvador’s offers fresh chips in both yellow and blue corn.
Salvador’s has targeted three main customer groups to sell their products to. The first group is grocery stores. The grocery stores will be then sell directly to the end consumer. This segment is growing at 75% and there currently are 53 potential customers. The second group is wholesale distributors. This segment has a 100% growth rate with 5 potential distributors. The last customer segment is restaurants which have a 45% growth rate. There are 18 potential restaurant customers. As mentioned before, Salvador’s originally targeted the Hispanic community. The market has indicated that their products have broader appeal and Salvador’s has recognized this and acted accordingly. The Hispanic community was initially targeted because of its exciting growth rate. The community has been growing at 22% a year, almost double the average of the overall US population.
While there are many competitors at the mid price point, both regional and national, there are few direct competitors at Salvador’s high price point. This is quite advantageous for Salvador’s, providing them with additional breathing room to establish themselves as the premier brand of authentic Hispanic food.
Salvador’s strong management team of Ricardo and Pat Torres will ensure sustainable growth for Salvador’s. Pat is the President and has 12 years of food industry experience. The previous five years was as manager of a four store Tex-Mex restaurant chain. This provided Pat with incredible insight and industry knowledge that reinforced the idea to start a business from scratch. Ricardo brings Salvador’s over six years of financial control experience that was gained as a CPA with Arthur Andersen. Salvador’s management team, due to its seasoned strength will help Salvador’s achieve the dream of being the premier Hispanic food manufacturer.
Salvador’s has begun to reach profitability and forecasts a modest net profit in three years. The commensurate modest profit margin will be achieved from sales. The financials within the plan further reinforce the exciting nature of this business.
1.1 Objectives
- Increase sales significantly over the next three years.
- Improve gross margin % over the current product line and maintain that level.
- Add products and services to meet market demand, again at high gross margin.
- Improve inventory turnover, reduce the cost of goods sold while maintaining the high quality of the products.
- To provide jobs to the Hispanic community that are rewarding and fulfilling.
1.2 Mission
Salvador’s was built on offering the highest quality and value in its authentic hot salsa, filled with the history of the Hispanic community. Time honored family recipes have been passed down through the generations, rich with ethnic heritage. Knowledgeable consumers were looking for authentic products, filled with the best ingredients. The consumer was crying out for a change! They wanted real down home Hispanic salsa.
Salvador’s answered this call, first with its hot salsa, then adding mild and extra hot salsa, followed by yellow and blue corn chips. Constantly striving to supply what the consumer is asking for, we continually review what is available in the marketplace, and what isn’t. Improving on what is available and providing new products and services to the areas of need will assure our success in a market driven by consumer demand.
1.3 Keys to Success
- Delivering high quality products that set themselves apart from the others in taste and value.
- Providing service, support, and a better than average margin to our dealers.
- Increase gross margin %.
- Bring new products into the mix to increase sales volume.
Company Summary
Salvador’s is in its third year of operation, increasing sales five-fold in its second year, and is on track to repeat this in its third year. It has a good reputation, excellent people, an increasing position in the local market, and opportunities to reach out into other states. Starting with a few outlets for our products, we now have over 40, with two large grocery chains in the approval process of carrying our full line of products, and a large distributor intending to sell over $100,000 worth of our products annually.
- See enclosed copies of letters from Moctezuma Foods, Inc., Meijer, Inc., and others.
2.1 Company History
Salvador’s has been hindered only by the lack of working capital it had in its initial stages of setup and operation. Sales are growing steadily, with the cost of goods sold consistently decreasing. But to make significant headway in this area, additional capital is needed to purchase ingredients and processing in larger volumes, thereby reducing the costs of goods sold by 32% overall.

| Past Performance | |||
| 1993 | 1994 | 1995 | |
| Sales | $0 | $4,224 | $21,050 |
| Gross Margin | $0 | $2,451 | $14,160 |
| Gross Margin % | 0.00% | 58.03% | 67.27% |
| Operating Expenses | $0 | $12,028 | $20,719 |
| Collection Period (days) | 0 | 0 | 0 |
| Inventory Turnover | 0.00 | 6.00 | 5.00 |
| Balance Sheet | |||
| 1993 | 1994 | 1995 | |
| Current Assets | |||
| Cash | $0 | $0 | $126 |
| Accounts Receivable | $0 | $0 | $0 |
| Inventory | $0 | $0 | $3,492 |
| Other Current Assets | $0 | $0 | $0 |
| Total Current Assets | $0 | $0 | $3,618 |
| Long-term Assets | |||
| Long-term Assets | $0 | $0 | $23,368 |
| Accumulated Depreciation | $0 | $0 | $9,792 |
| Total Long-term Assets | $0 | $0 | $13,576 |
| Total Assets | $0 | $0 | $17,194 |
| Current Liabilities | |||
| Accounts Payable | $0 | $0 | $0 |
| Current Borrowing | $0 | $0 | $16,207 |
| Other Current Liabilities (interest free) | $0 | $0 | $0 |
| Total Current Liabilities | $0 | $0 | $16,207 |
| Long-term Liabilities | $0 | $0 | $0 |
| Total Liabilities | $0 | $0 | $16,207 |
| Paid-in Capital | $0 | $0 | $25,000 |
| Retained Earnings | $0 | $0 | ($9,755) |
| Earnings | $0 | $0 | ($14,258) |
| Total Capital | $0 | $0 | $987 |
| Total Capital and Liabilities | $0 | $0 | $17,194 |
| Other Inputs | |||
| Payment Days | 0 | 0 | 0 |
| Sales on Credit | $0 | $0 | $0 |
| Receivables Turnover | 0.00 | 0.00 | 0.00 |
2.2 Company Ownership
Salvador’s is a privately-held C Corporation owned in total by its co-founders, Ricardo and Pat Torres.
2.3 Company Locations and Facilities
Currently we have one location in suburban Perrysburg. It includes the production area, offices, and warehouse area. We are currently looking into plans to increase the size of the warehouse by adding a location, and providing a store front to enhance the current business sales practices, while providing a high quality, ethnic outlet for Hispanic foods.
Products
Salvador’s sells its authentic Hispanic salsa and chips to an ever-growing clientele. Originally geared toward the local Hispanic community, the market has expanded to include a much larger geographical area, in addition to a very broad consumer response.
We are selling quality and product-uniqueness in a market segment filled with competition. Our approach is to take our product image up-market because or our rich heritage and uncompromising view of product quality. This focus has enabled us to view the voids in the market, and add product to our line that will fill it. We have researched and reviewed other ethnic food item organizations, tracking their successes and positioning ourselves similarly.

Salvador’s is building a reputation for high quality and strong value in a product filled with authentic Hispanic flavor. We service our dealers just as if they were a part of the family – and that is our unique approach to marketing our products. You are not just a dealer; not just a consumer; you are special to us – you are family. We go to great lengths to provide our dealers with high quality products, and the ability to make a good margin on them. In addition, we make ourselves available for on-site demonstrations of the product at no charge to them. We hope to continue offering this service, but at a minimal cost to lower our expenses in the future.
3.1 Product Description
We currently offer two basic product lines:
- Our original product, Salsa, was available only in a hot flavor. Because of consumer demand, we have added extra hot and mild flavors.
- Chips, both yellow corn and blue corn.
3.2 Competitive Comparison
To differentiate ourselves from all of the others, we stress quality and authenticity of the ingredients, and the heritage of the family recipe.
We sell more than a jar with salsa in it. We sell high quality ingredients, carefully put together in a masterful blend that can’t be matched in taste or true Hispanic authenticity.
These are simple products that must be presented in a way that encourages the consumer to just give us a chance. Once they try our product, we will have a long-term relationship with them.
As in similar food items, we can charge a premium for what we supply. The market has shown it will buy our product over more readily known names because of the richness and authentic taste of our salsa.
3.3 Sales Literature
We are currently working on a new line of brochures and sales materials to assist our marketing, and that of our dealers. Our newly designed labels show the direction we are taking in this area, and we have enclosed a copy as an appendix/attachment.
3.4 Sourcing
Our costs are a part of the margin squeeze. As our orders go up, we need to increase our production in a way that also increases our margin. We have found a local supplier that can reduce our costs by handling much larger batches of salsa than we are currently able, yet maintain our high quality. This will reduce our costs over 32% per jar in the production of our salsa.
We need to continue to find additional opportunities that will afford us lower costs of production while maintaining the quality that has put us on the map. Our outsourcing for the corn chips has shown we can contract for a high quality product that we will be able to put our name on, and meet our goals for gross-profit margin.
3.5 Future Products
We are currently researching the addition of an authentic Hispanic Sauce, as well as other Hispanic food items to offer our current clients, and to build increased interest in Salvador’s, Inc.
We are now looking into additional products, sauce, and other Hispanic food items, as well as other ways of marketing the overall line.
We are also looking into creation of a small store front, and eventually a lunch counter or small restaurant setting.
Market Analysis Summary
We have been selling at the rate of $2,500 per month to local restaurants, small grocery stores and distributors of Hispanic foodstuffs. Salvador’s is currently awaiting approval for a large grocery chain to carry our products, and has received a commitment from a large distributor to sell from $100,000 to $150,000 of product per year. There are several other large grocery chains that have been approached and are in various stages of interest in carrying the Salvador’s line of product.
4.1 Market Segmentation
The Hispanic food industry is in a boom period. While there are many items from various vendors available, Salvador’s has approached the market as a Specialty Retailer: a provider of authentic high quality Hispanic salsa and chips.
We have made significant inroads with several area restaurants and a small grocer’s, each providing us with a market presence. We are now looking at developing our own store front as an adjunct to our current marketing. There is is a need for a specialty retailer catering specifically to the Hispanic client and to the individuals that appreciate authentic Hispanic cuisine.
In addition to the above, we are also looking at packaging our products for other groups to use for fundraising events, gift baskets for corporate promotions, and the possibility of a house restaurant to further advertise and promote the products.

| Market Analysis | |||||||
| 1996 | 1997 | 1998 | 1999 | 2000 | |||
| Potential Customers | Growth | CAGR | |||||
| Grocery Stores | 75% | 53 | 93 | 163 | 285 | 499 | 75.17% |
| Distributors | 100% | 5 | 10 | 20 | 40 | 80 | 100.00% |
| Restaurants | 45% | 18 | 26 | 38 | 55 | 80 | 45.20% |
| Other | 12% | 10 | 11 | 12 | 13 | 15 | 10.67% |
| Total | 67.32% | 86 | 140 | 233 | 393 | 674 | 67.32% |
4.2 Target Market Segment Strategy
We are initially focusing on the Hispanic community. They will be able to appreciate more readily the authenticity of the product. The market will observe the products they choose, and they will indirectly become promoters of our products.
4.2.1 Market Growth
The market analysis shows us a broad range of prospective clients, covering more than one ethnic group or body. The largest of these groups of customers is that of the mainstream American, which is projected to grow at 12% per year. The fasting growing segment is Hispanic, which is projected to grow at 22% per year.
4.3 Industry Analysis
The Hispanic food industry is relatively new, and its popularity is ever on the increase. The authentic taste is not common in this industry, which gives Salvador’s a leg up on the competition.
In an industry currently in a steady upward growth curve, Salvador’s is poised to capitalize on the consumer’s desire for authentic, high quality, Hispanic cuisine.
While a troubling economy can affect many areas, food items are generally not as affected, with specialty items seeming to always find favor in the market place.
4.3.1 Competition and Buying Patterns
There are many suppliers of salsa and similar products currently available on the shelves at your local grocer. However, there is still a lot of room for new products and new companies.
By positioning ourselves at the higher end of the market, we expose ourselves to consumers trying to get out of the rut, who continue to use a product that they have long forgotten why they buy. By not trying to compete head on, we are selling our product consistently and increasingly. With entrance into some of the larger grocery chains we will broaden our audience considerably.
4.3.2 Main Competitors
Although Salvador’s is staking out the high end of this market, we can not fail to be compared with some of the current leaders in this arena. Chi – Chi’s, El Paso, and Hunt’s are just a few of the participants in this segment. Most have been on the shelf for so long they are taken for granted by the consumer. Our fresh approach to authentic taste and texture makes us different.
4.3.3 Industry Participants
While there are currently several vendors in this market selling competitive products, the commonality of those products provides an opening in the marketplace for the vibrant packaging and positioning of Salvador’s salsa and chips. We stand out on the shelf, we stand out in the restaurant, and we will stand out in the mind of the consumer.
4.3.4 Distribution Patterns
While current brand names carry more weight in the marketplace, because of our unique marketing approach using local restaurants, and displaying and demonstrating our wares in local grocery stores, we are able to build consumer awareness at a margin of the cost of television and radio advertising.
In going to food fairs, neighborhood festivals and the like, we build consumer awareness and generate demand at the same time. While at these events we are also able to directly research the market and hear first-hand what the consumer is seeking.
Strategy and Implementation Summary
Our strategy is based on serving niche markets well. The world is full of consumers who can’t get what they perceive to be high quality or authentic. We are capitalizing on the family heritage in our product line.
We are building a marketing infrastructure that will provide what appears to be a seamless approach to our products, covering multiple avenues of utilizing grocery stores and major distributors. Each location will accent the other, providing for continuous exposure of Salvador’s name.
5.1 Marketing Strategy
We are focusing on the consumer first through grocery exposure, and then impacting them through restaurants and other food places.
5.1.1 Promotion Strategy
The long-range goal is to gain enough visibility to leverage the product into other distribution sites within our region, then to move on to other geographical regions as inquiries and distribution requests come in.
Although our current contacts in the grocery chains are for local consumption, they all move out of this region in their normal distribution. It is our goal to move with them.
5.1.2 Distribution Strategy
To this means we have been continually reworking our packaging for better corporate identity, providing a more attractive package, a very important ingredient in the food industry. An example is the recent addition of bar-coding and nutritional information to our label.
5.1.3 Pricing Strategy
We are able to price our products competitively. Even though we are subject to some impulse buying, we can provide a product to be resold at a generous mark-up for our dealers, while still providing a satisfactory experience for the consumer. At a retail range of $2.79 to $3.05 per jar of salsa, we cover the mid-to-upper price range of the salsa market, while providing a 33% margin for the dealers.
5.2 Sales Strategy
The keys to our continuing success are in the areas we are adding to our current distribution channels. This will remain our main focus for the next five years. Sales calls on the following enterprises have resulted in Salvador’s Salsa being stocked and sold by them.
Barney’s (Perrysburg)
Bassets IGA (Oak Harbor)
Brinkman’s Country Corner (Findlay)
Brownings (Whitehouse)
Char’s Best Market (Toledo)
Churchill Supermarkets
Connie Mac’s (Toledo)
D & D’s Carryout (Pemberville)
Dels (Woodville)
E & L Meats (Detroit)
El Aguila Bakery (Fremont)
Elmore Super Value (Elmore)
Falls Crestview Market (Toledo)
Gerrards (Rossford)
Gift Baskets (Perrysburg)
Grumpy’s (Toledo)
IGA (Delta)
Kazmaiers
Kirwen’s (Gibsonburg)
K.O.A. Campground (Stoney Ridge)
La Bottelia (Detroit)
LaColmena (Detroit)
LaMexicana (Toledo)
LaPeria (Toledo)
Luna Bakery & Grocery (Detroit)
Mad Anthony’s (Waterville)
Markada (Ann Arbor)
Moser’s Farm Market (Perrysburg)
Ohlman’s Farm Market (Toledo)
Ottawa Market (Toledo)
Partners in Wine II (Ann Arbor)
Pauken Wine & Liquor (Maumee)
Schorlings (Toledo)
South Point Carryout (Toledo)
Stephen’s Restaurant (Perrysburg)
Vernor Foods (Detroit)
Wolfert’s (Toledo)
5.2.1 Sales Programs
Dealer sales: Thorough and persistent effort to generate sales through major names including:
- Meijer, Inc.
- Foodtown, Inc.
- Kroger’s
- Moctezuma Foods, Inc.
- IGA (various)
- Churchill’s
- Ohlman’s
To this means, we are currently interviewing distributors to assist us with the marketing and distribution of our salsa. Again, the hiring of a distributor, and a modest performance increase on their efforts for Salvador’s would make our sales projections conservative. Key to the sale and distribution of our products through this channel is the constant care and feeding of the buyers for each of the organizations. Sales calls on a regular basis, along with samples of new product, will keep the doors open to us.
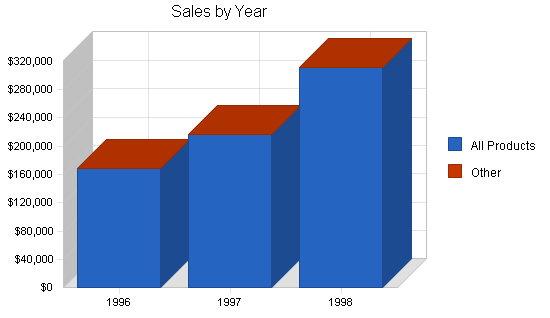
5.2.2 Sales Forecast
We currently forecast our sales to grow at an astounding rate for the next 12 months because of written commitments we have received from distributors intending to take on our product line in larger volumes in the future.
This growth will continue, but at a lower rate for the next year, and the following year. We anticipate the growth rate to flatten out within five years, but to remain steady. Should the market on Hispanic food items continue at its current pace, we will keep pace with it. Our forecast does assume a downturn in the product within a three-year period, and the lower figures are a reflection of that forecast. We would be happy if it didn’t falter.

| Sales Forecast | |||
| 1996 | 1997 | 1998 | |
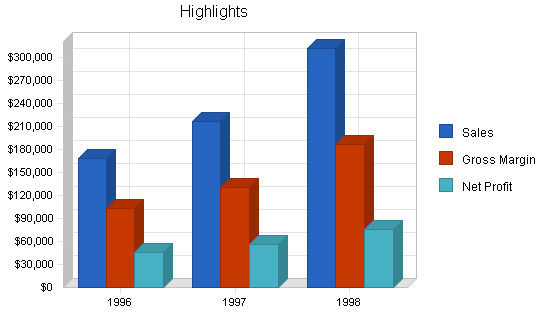
| Sales | |||
| All Products | $168,602 | $217,320 | $312,052 |
| Other | $0 | $0 | $0 |
| Total Sales | $168,602 | $217,320 | $312,052 |
| Direct Cost of Sales | 1996 | 1997 | 1998 |
| All Products | $64,916 | $86,928 | $124,821 |
| Other | $0 | $0 | $0 |
| Subtotal Direct Cost of Sales | $64,916 | $86,928 | $124,821 |
5.3 Strategic Alliances
We do have some opportunity for building strategic alliances with several local restaurants some of which are listed below. Approached properly, they will not only serve our products in their restaurants, but also sell for carry out.
- La Perla
- Connie Mac’s
- Zingerman’s
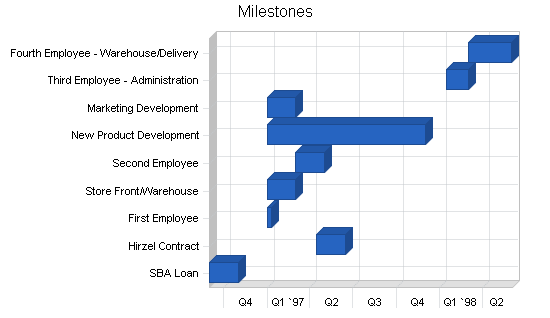
5.4 Milestones
The following table lists important program milestones, with dates and budgets for each. The milestone schedule indicates our emphasis on planning and for having a sure method of implementation when the time comes for each action.
| Milestones | |||||
| Milestone | Start Date | End Date | Budget | Manager | Department |
| SBA Loan | 9/1/1996 | 11/1/1996 | $1,500 | Patricia | Finance |
| Hirzel Contract | 4/15/1997 | 6/15/1997 | $9,600 | Ricardo | Finance |
| First Employee | 1/1/1997 | 1/10/1997 | $9,600 | Patricia | Admin/Mgmt |
| Store Front/Warehouse | 1/1/1997 | 3/1/1997 | $12,000 | Ricardo | Sales |
| Second Employee | 3/1/1997 | 5/1/1997 | $25,000 | Ricardo | Production |
| New Product Development | 1/1/1997 | 12/1/1997 | $350 | Pat/Ric | Marketing |
| Marketing Development | 1/1/1997 | 3/1/1997 | $500 | Ricardo | Marketing |
| Third Employee – Administration | 1/15/1998 | 3/1/1998 | $18,500 | Patricia | Admin |
| Fourth Employee – Warehouse/Delivery | 3/1/1998 | 6/1/1998 | $24,500 | Ricardo | Warehouse |
| Totals | $101,550 | ||||
Management Summary
Salvador’s was founded by Ricardo & Patricia Torres and has operated without the burden of any payroll or salary expense to this point.
Patricia Torres – President
Patricia is currently responsible for the preparation of salsa and maintaining the various inventories of raw materials; purchasing of food ingredients; assistance with packaging and shipping. In addition, she maintains the company records and is in direct communication with the accountant and other advisors.
Ricardo Torres – Vice President
Ricardo assists with the preparation and production of salsa; maintains the inventory of the finished products; is responsible for packing and shipping; assists with recordkeeping and cost containment. Ricardo also shares in the marketing and promotion of the product.
Current plans are to bring Patricia on board in a paid capacity on or about August 1st, and we have forecast the proper expenses to do so. As orders are processed and goals met, Ricardo will take charge of the logistics and become a full time paid employee as well. We are currently forecasting this to transpire in the first quarter of 1997. We plan on hiring additional personnel as the need for them arises, and as we have the ability to pay them.
6.1 Organizational Structure
Salvador’s planned organization calls for sales and marketing, product development, finance and administration. Actual production falls under the finance and administrative area. We are currently using outside consultants to assist in these areas.
6.2 Management Team
The management team is currently comprised of Ricardo and Patricia Torres, the founders of Salvador’s, Inc. In addition, they have a board of advisors with over 78 years of administrative, financial, and sales management experience to assist them with management decisions on daily operations, and the long-range planning necessary for continued, consistent growth.
The team is currently compose of the following professionals:
[Personal and Confidential information removed]
6.3 Management Team Gaps
The gaps in the management team are currently being addressed through the use of outside consultants as mentioned above, and will continue to be until the cash flow allows for the hiring of employees to fill those capacities. The identifiable gaps are in administration, finance management, and marketing.
6.4 Personnel Plan
The current personnel plan calls for Patricia to become a paid employee on or about August 1st. Although she has been working for Salvador’s since its inception two years ago, she has not drawn a salary or been reimbursed for expenses. We are then planning on Ricardo taking a paid position with Salvador’s by early 1997, or the successful approval of a Link Deposit Loan; whichever comes first.
| Personnel Plan | |||
| 1996 | 1997 | 1998 | |
| Patricia Torres | $9,600 | $23,000 | $38,000 |
| Ricardo Torres | $0 | $20,500 | $34,800 |
| Other | $0 | $0 | $0 |
| Total People | 2 | 2 | 2 |
| Total Payroll | $9,600 | $43,500 | $72,800 |
Financial Plan
We have forecast a very rapid growth for Salvador’s this year. Although this may seem ambitious based on historic sales, this rate of growth is due to the large orders we have received to date from several distributors, letters of commitment from Meijer’s and Kroger’s, and the increasing number of orders from current clients.
7.1 Important Assumptions
The financial plan depends on important assumptions, most of which are shown in the following table. The key underlying assumptions are:
- We assume a slow-growth economy, without major recession.
- We assume, of course, that there are no unforeseen changes in the consumer market to make products immediately obsolete or out of favor (or not increasing in popularity).
- We assume access to equity capital and financing sufficient to maintain our financial plan as shown in the tables, addendum, and additional documentation.
| General Assumptions | |||
| 1996 | 1997 | 1998 | |
| Plan Month | 1 | 2 | 3 |
| Current Interest Rate | 5.00% | 5.00% | 5.00% |
| Long-term Interest Rate | 5.00% | 5.00% | 5.00% |
| Tax Rate | 25.00% | 25.00% | 25.00% |
| Other | 0 | 0 | 0 |
7.2 Key Financial Indicators
The most important factor in our case is the ability to procure financing to go the the next level. The size of the orders currently being asked of us are well beyond our current production capacity, but well within the production capability of a local processor. *Note: purchasing from this supplier will also reduce our per unit production costs in excess of 30%. An additional alternative would be to purchase the production equipment necessary, and not be subject to the local manufacturer’s production scheduling.
We must maintain reasonably high gross margins, and hold marketing costs to no more than 20% of sales to provide the income to reduce out debt, and equip us to sustain the growth we anticipate. We will meet and exceed all of theses conditions through buying at increased volumes. Then we’ll pass the savings on to our customers through increases in the margins at which they retail the product.

7.3 Break-even Analysis
The break-even analysis shows that Salvador’s has a good balance of fixed costs and sufficient sales to remain healthy. We have already passed our monthly break-even point; last year’s overall loss reflects high costs in the first half of the year.
We have just recently contracted with another jar supplier that will reduce our costs by 18% per jar of salsa with the next supply order. This will further reduce the break-even point, and add to our goal of increasing the margin on our salsa.

| Break-even Analysis | |
| Monthly Revenue Break-even | $4,747 |
| Assumptions: | |
| Average Percent Variable Cost | 39% |
| Estimated Monthly Fixed Cost | $2,919 |
7.4 Projected Profit and Loss
We expect to close out this year with good sales growth, and to increase our sales each year through the turn of the century, with comfortable net profit.


| Pro Forma Profit and Loss | |||
| 1996 | 1997 | 1998 | |
| Sales | $168,602 | $217,320 | $312,052 |
| Direct Cost of Sales | $64,916 | $86,928 | $124,821 |
| Other Costs of Sales | $0 | $0 | $0 |
| Total Cost of Sales | $64,916 | $86,928 | $124,821 |
| Gross Margin | $103,686 | $130,392 | $187,231 |
| Gross Margin % | 61.50% | 60.00% | 60.00% |
| Expenses | |||
| Payroll | $9,600 | $43,500 | $72,800 |
| Marketing/Promotion | $6,763 | $0 | $0 |
| Depreciation | $5,520 | $0 | $0 |
| Rent | $3,500 | $0 | $0 |
| Utilities | $3,850 | $0 | $0 |
| Leased Equipment | $465 | $0 | $0 |
| Insurance | $1,044 | $0 | $0 |
| Payroll Taxes | $0 | $0 | $0 |
| Other | $4,290 | $4,225 | $6,275 |
| Total Operating Expenses | $35,032 | $47,725 | $79,075 |
| Profit Before Interest and Taxes | $68,654 | $82,667 | $108,156 |
| EBITDA | $74,174 | $82,667 | $108,156 |
| Interest Expense | $7,533 | $7,958 | $6,817 |
| Taxes Incurred | $15,280 | $18,677 | $25,335 |
| Net Profit | $45,841 | $56,032 | $76,004 |
| Net Profit/Sales | 27.19% | 25.78% | 24.36% |
7.5 Projected Cash Flow
We expect to manage cash flow over the next three years with the assistance of a Small Business Administration supported loan. This financing assistance is required to provide the working capital to meet the current needs while providing a solid foundation to build the growth of the organization. After a six-month period, we anticipate requesting an open line of credit to further the company’s ability to meet and exceed sales projections, gross margin, and return on investment.

| Pro Forma Cash Flow | |||
| 1996 | 1997 | 1998 | |
| Cash Received | |||
| Cash from Operations | |||
| Cash Sales | $143,312 | $184,722 | $265,244 |
| Subtotal Cash from Operations | $164,267 | $216,067 | $309,616 |
| Additional Cash Received | |||
| Sales Tax, VAT, HST/GST Received | $0 | $0 | $0 |
| New Current Borrowing | $0 | $0 | $0 |
| New Other Liabilities (interest-free) | $0 | $0 | $0 |
| New Long-term Liabilities | $165,000 | $0 | $0 |
| Sales of Other Current Assets | $0 | $0 | $0 |
| Sales of Long-term Assets | $0 | $0 | $0 |
| New Investment Received | $0 | $0 | $0 |
| Subtotal Cash Received | $329,267 | $216,067 | $309,616 |
| Expenditures | 1996 | 1997 | 1998 |
| Expenditures from Operations | |||
| Cash Spending | $9,600 | $43,500 | $72,800 |
| Bill Payments | $101,045 | $120,055 | $163,313 |
| Subtotal Spent on Operations | $110,645 | $163,555 | $236,113 |
| Additional Cash Spent | |||
| Sales Tax, VAT, HST/GST Paid Out | $0 | $0 | $0 |
| Principal Repayment of Current Borrowing | $3,650 | $5,555 | $6,000 |
| Other Liabilities Principal Repayment | $0 | $0 | $0 |
| Long-term Liabilities Principal Repayment | $7,100 | $17,042 | $17,042 |
| Purchase Other Current Assets | $0 | $0 | $0 |
| Purchase Long-term Assets | $0 | $0 | $0 |
| Dividends | $45,000 | $0 | $0 |
| Subtotal Cash Spent | $166,395 | $186,152 | $259,155 |
| Net Cash Flow | $162,872 | $29,916 | $50,461 |
| Cash Balance | $162,998 | $192,913 | $243,375 |
7.6 Projected Balance Sheet
As shown by the balance sheet in the table, we expect a healthy growth in net worth through the end of the plan period.
| Pro Forma Balance Sheet | |||
| 1996 | 1997 | 1998 | |
| Assets | |||
| Current Assets | |||
| Cash | $162,998 | $192,913 | $243,375 |
| Accounts Receivable | $4,335 | $5,587 | $8,023 |
| Inventory | $6,745 | $9,032 | $12,970 |
| Other Current Assets | $0 | $0 | $0 |
| Total Current Assets | $174,078 | $207,533 | $264,367 |
| Long-term Assets | |||
| Long-term Assets | $23,368 | $23,368 | $23,368 |
| Accumulated Depreciation | $15,312 | $15,312 | $15,312 |
| Total Long-term Assets | $8,056 | $8,056 | $8,056 |
| Total Assets | $182,134 | $215,589 | $272,423 |
| Liabilities and Capital | 1996 | 1997 | 1998 |
| Current Liabilities | |||
| Accounts Payable | $9,849 | $9,869 | $13,741 |
| Current Borrowing | $12,557 | $7,002 | $1,002 |
| Other Current Liabilities | $0 | $0 | $0 |
| Subtotal Current Liabilities | $22,406 | $16,871 | $14,743 |
| Long-term Liabilities | $157,900 | $140,858 | $123,816 |
| Total Liabilities | $180,306 | $157,729 | $138,559 |
| Paid-in Capital | $25,000 | $25,000 | $25,000 |
| Retained Earnings | ($69,013) | ($23,172) | $32,860 |
| Earnings | $45,841 | $56,032 | $76,004 |
| Total Capital | $1,828 | $57,860 | $133,864 |
| Total Liabilities and Capital | $182,134 | $215,589 | $272,423 |
| Net Worth | $1,828 | $57,860 | $133,864 |
7.7 Business Ratios
Standard business ratios are included in the table that follows. The ratios show a plan for well balanced, healthy growth. The industry comparisons are for the Perishable Prepared Food Manufacturing industry, NAICS classification code 311991.
| Ratio Analysis | ||||
| 1996 | 1997 | 1998 | Industry Profile | |
| Sales Growth | 700.96% | 28.90% | 43.59% | 6.68% |
| Percent of Total Assets | ||||
| Accounts Receivable | 2.38% | 2.59% | 2.94% | 15.95% |
| Inventory | 3.70% | 4.19% | 4.76% | 13.45% |
| Other Current Assets | 0.00% | 0.00% | 0.00% | 21.34% |
| Total Current Assets | 95.58% | 96.26% | 97.04% | 50.74% |
| Long-term Assets | 4.42% | 3.74% | 2.96% | 49.26% |
| Total Assets | 100.00% | 100.00% | 100.00% | 100.00% |
| Current Liabilities | 12.30% | 7.83% | 5.41% | 25.96% |
| Long-term Liabilities | 86.69% | 65.34% | 45.45% | 29.44% |
| Total Liabilities | 99.00% | 73.16% | 50.86% | 55.40% |
| Net Worth | 1.00% | 26.84% | 49.14% | 44.60% |
| Percent of Sales | ||||
| Sales | 100.00% | 100.00% | 100.00% | 100.00% |
| Gross Margin | 61.50% | 60.00% | 60.00% | 19.36% |
| Selling, General & Administrative Expenses | 34.31% | 34.22% | 35.64% | 11.01% |
| Advertising Expenses | 3.27% | 0.00% | 0.00% | 0.60% |
| Profit Before Interest and Taxes | 40.72% | 38.04% | 34.66% | 1.06% |
| Main Ratios | ||||
| Current | 7.77 | 12.30 | 17.93 | 1.56 |
| Quick | 7.47 | 11.77 | 17.05 | 0.86 |
| Total Debt to Total Assets | 99.00% | 73.16% | 50.86% | 63.95% |
| Pre-tax Return on Net Worth | 3343.58% | 129.12% | 75.70% | 1.88% |
| Pre-tax Return on Assets | 33.56% | 34.65% | 37.20% | 5.23% |
| Additional Ratios | 1996 | 1997 | 1998 | |
| Net Profit Margin | 27.19% | 25.78% | 24.36% | n.a |
| Return on Equity | 2507.69% | 96.84% | 56.78% | n.a |
| Activity Ratios | ||||
| Accounts Receivable Turnover | 5.83 | 5.83 | 5.83 | n.a |
| Collection Days | 57 | 56 | 53 | n.a |
| Inventory Turnover | 10.91 | 11.02 | 11.35 | n.a |
| Accounts Payable Turnover | 11.26 | 12.17 | 12.17 | n.a |
| Payment Days | 27 | 30 | 26 | n.a |
| Total Asset Turnover | 0.93 | 1.01 | 1.15 | n.a |
| Debt Ratios | ||||
| Debt to Net Worth | 98.63 | 2.73 | 1.04 | n.a |
| Current Liab. to Liab. | 0.12 | 0.11 | 0.11 | n.a |
| Liquidity Ratios | ||||
| Net Working Capital | $151,672 | $190,662 | $249,624 | n.a |
| Interest Coverage | 9.11 | 10.39 | 15.87 | n.a |
| Additional Ratios | ||||
| Assets to Sales | 1.08 | 0.99 | 0.87 | n.a |
| Current Debt/Total Assets | 12% | 8% | 5% | n.a |
| Acid Test | 7.27 | 11.43 | 16.51 | n.a |
| Sales/Net Worth | 92.23 | 3.76 | 2.33 | n.a |
| Dividend Payout | 0.98 | 0.00 | 0.00 | n.a |
Appendix
| Sales Forecast | |||||||||||||
| Jan | Feb | Mar | Apr | May | Jun | Jul | Aug | Sep | Oct | Nov | Dec | ||
| Sales | |||||||||||||
| All Products | 0% | $13,351 | $12,271 | $12,421 | $15,099 | $14,370 | $15,850 | $14,350 | $13,800 | $14,112 | $13,643 | $13,100 | $16,235 |
| Other | 0% | $0 | $0 | $0 | $0 | $0 | $0 | $0 | $0 | $0 | $0 | $0 | $0 |
| Total Sales | $13,351 | $12,271 | $12,421 | $15,099 | $14,370 | $15,850 | $14,350 | $13,800 | $14,112 | $13,643 | $13,100 | $16,235 | |
| Direct Cost of Sales | Jan | Feb | Mar | Apr | May | Jun | Jul | Aug | Sep | Oct | Nov | Dec | |
| All Products | $3,981 | $3,726 | $6,924 | $4,659 | $5,093 | $5,615 | $5,925 | $6,173 | $5,313 | $5,500 | $5,875 | $6,132 | |
| Other | $0 | $0 | $0 | $0 | $0 | $0 | $0 | $0 | $0 | $0 | $0 | $0 | |
| Subtotal Direct Cost of Sales | $3,981 | $3,726 | $6,924 | $4,659 | $5,093 | $5,615 | $5,925 | $6,173 | $5,313 | $5,500 | $5,875 | $6,132 | |
| Personnel Plan | |||||||||||||
| Jan | Feb | Mar | Apr | May | Jun | Jul | Aug | Sep | Oct | Nov | Dec | ||
| Patricia Torres | 0% | $0 | $0 | $0 | $0 | $0 | $0 | $0 | $1,920 | $1,920 | $1,920 | $1,920 | $1,920 |
| Ricardo Torres | 0% | $0 | $0 | $0 | $0 | $0 | $0 | $0 | $0 | $0 | $0 | $0 | $0 |
| Other | 0% | $0 | $0 | $0 | $0 | $0 | $0 | $0 | $0 | $0 | $0 | $0 | $0 |
| Total People | 2 | 2 | 2 | 2 | 2 | 2 | 2 | 2 | 2 | 2 | 2 | 2 | |
| Total Payroll | $0 | $0 | $0 | $0 | $0 | $0 | $0 | $1,920 | $1,920 | $1,920 | $1,920 | $1,920 | |
| Pro Forma Profit and Loss | |||||||||||||
| Jan | Feb | Mar | Apr | May | Jun | Jul | Aug | Sep | Oct | Nov | Dec | ||
| Sales | $13,351 | $12,271 | $12,421 | $15,099 | $14,370 | $15,850 | $14,350 | $13,800 | $14,112 | $13,643 | $13,100 | $16,235 | |
| Direct Cost of Sales | $3,981 | $3,726 | $6,924 | $4,659 | $5,093 | $5,615 | $5,925 | $6,173 | $5,313 | $5,500 | $5,875 | $6,132 | |
| Other Costs of Sales | $0 | $0 | $0 | $0 | $0 | $0 | $0 | $0 | $0 | $0 | $0 | $0 | |
| Total Cost of Sales | $3,981 | $3,726 | $6,924 | $4,659 | $5,093 | $5,615 | $5,925 | $6,173 | $5,313 | $5,500 | $5,875 | $6,132 | |
| Gross Margin | $9,370 | $8,545 | $5,497 | $10,440 | $9,277 | $10,235 | $8,425 | $7,627 | $8,799 | $8,143 | $7,225 | $10,103 | |
| Gross Margin % | 70.18% | 69.64% | 44.26% | 69.14% | 64.56% | 64.57% | 58.71% | 55.27% | 62.35% | 59.69% | 55.15% | 62.23% | |
| Expenses | |||||||||||||
| Payroll | $0 | $0 | $0 | $0 | $0 | $0 | $0 | $1,920 | $1,920 | $1,920 | $1,920 | $1,920 | |
| Marketing/Promotion | $466 | $722 | $330 | $845 | $335 | $435 | $595 | $470 | $800 | $470 | $675 | $620 | |
| Depreciation | $460 | $460 | $460 | $460 | $460 | $460 | $460 | $460 | $460 | $460 | $460 | $460 | |
| Rent | $0 | $0 | $0 | $0 | $0 | $500 | $500 | $500 | $500 | $500 | $500 | $500 | |
| Utilities | $315 | $400 | $315 | $300 | $315 | $315 | $315 | $315 | $315 | $315 | $315 | $315 | |
| Leased Equipment | $0 | $0 | $0 | $0 | $0 | $65 | $0 | $0 | $75 | $0 | $325 | $0 | |
| Insurance | $87 | $87 | $87 | $87 | $87 | $87 | $87 | $87 | $87 | $87 | $87 | $87 | |
| Payroll Taxes | 15% | $0 | $0 | $0 | $0 | $0 | $0 | $0 | $0 | $0 | $0 | $0 | $0 |
| Other | $167 | $1,591 | $118 | $614 | $225 | $225 | $225 | $225 | $225 | $225 | $225 | $225 | |
| Total Operating Expenses | $1,495 | $3,260 | $1,310 | $2,306 | $1,422 | $2,087 | $2,182 | $3,977 | $4,382 | $3,977 | $4,507 | $4,127 | |
| Profit Before Interest and Taxes | $7,875 | $5,285 | $4,187 | $8,134 | $7,855 | $8,148 | $6,243 | $3,650 | $4,417 | $4,166 | $2,718 | $5,976 | |
| EBITDA | $8,335 | $5,745 | $4,647 | $8,594 | $8,315 | $8,608 | $6,703 | $4,110 | $4,877 | $4,626 | $3,178 | $6,436 | |
| Interest Expense | $67 | $67 | $754 | $753 | $753 | $752 | $751 | $743 | $735 | $727 | $719 | $710 | |
| Taxes Incurred | $1,952 | $1,305 | $858 | $1,845 | $1,776 | $1,849 | $1,373 | $727 | $920 | $860 | $500 | $1,316 | |
| Net Profit | $5,856 | $3,914 | $2,575 | $5,535 | $5,327 | $5,547 | $4,119 | $2,180 | $2,761 | $2,579 | $1,499 | $3,949 | |
| Net Profit/Sales | 43.86% | 31.89% | 20.73% | 36.66% | 37.07% | 35.00% | 28.70% | 15.80% | 19.57% | 18.90% | 11.44% | 24.33% | |
| Pro Forma Cash Flow | |||||||||||||
| Jan | Feb | Mar | Apr | May | Jun | Jul | Aug | Sep | Oct | Nov | Dec | ||
| Cash Received | |||||||||||||
| Cash from Operations | |||||||||||||
| Cash Sales | $11,348 | $10,430 | $10,558 | $12,834 | $12,215 | $13,473 | $12,198 | $11,730 | $11,995 | $11,597 | $11,135 | $13,800 | |
| Subtotal Cash from Operations | $11,348 | $10,497 | $12,555 | $14,676 | $14,091 | $15,734 | $14,360 | $14,100 | $14,145 | $13,668 | $13,249 | $15,843 | |
| Additional Cash Received | |||||||||||||
| Sales Tax, VAT, HST/GST Received | 0.00% | $0 | $0 | $0 | $0 | $0 | $0 | $0 | $0 | $0 | $0 | $0 | $0 |
| New Current Borrowing | $0 | $0 | $0 | $0 | $0 | $0 | $0 | $0 | $0 | $0 | $0 | $0 | |
| New Other Liabilities (interest-free) | $0 | $0 | $0 | $0 | $0 | $0 | $0 | $0 | $0 | $0 | $0 | $0 | |
| New Long-term Liabilities | $0 | $0 | $165,000 | $0 | $0 | $0 | $0 | $0 | $0 | $0 | $0 | $0 | |
| Sales of Other Current Assets | $0 | $0 | $0 | $0 | $0 | $0 | $0 | $0 | $0 | $0 | $0 | $0 | |
| Sales of Long-term Assets | $0 | $0 | $0 | $0 | $0 | $0 | $0 | $0 | $0 | $0 | $0 | $0 | |
| New Investment Received | $0 | $0 | $0 | $0 | $0 | $0 | $0 | $0 | $0 | $0 | $0 | $0 | |
| Subtotal Cash Received | $11,348 | $10,497 | $177,555 | $14,676 | $14,091 | $15,734 | $14,360 | $14,100 | $14,145 | $13,668 | $13,249 | $15,843 | |
| Expenditures | Jan | Feb | Mar | Apr | May | Jun | Jul | Aug | Sep | Oct | Nov | Dec | |
| Expenditures from Operations | |||||||||||||
| Cash Spending | $0 | $0 | $0 | $0 | $0 | $0 | $0 | $1,920 | $1,920 | $1,920 | $1,920 | $1,920 | |
| Bill Payments | $264 | $7,912 | $7,793 | $12,694 | $6,694 | $9,106 | $10,407 | $10,092 | $9,463 | $8,054 | $8,914 | $9,652 | |
| Subtotal Spent on Operations | $264 | $7,912 | $7,793 | $12,694 | $6,694 | $9,106 | $10,407 | $12,012 | $11,383 | $9,974 | $10,834 | $11,572 | |
| Additional Cash Spent | |||||||||||||
| Sales Tax, VAT, HST/GST Paid Out | $0 | $0 | $0 | $0 | $0 | $0 | $0 | $0 | $0 | $0 | $0 | $0 | |
| Principal Repayment of Current Borrowing | $100 | $100 | $100 | $100 | $100 | $200 | $200 | $500 | $500 | $500 | $500 | $750 | |
| Other Liabilities Principal Repayment | $0 | $0 | $0 | $0 | $0 | $0 | $0 | $0 | $0 | $0 | $0 | $0 | |
| Long-term Liabilities Principal Repayment | $0 | $0 | $0 | $0 | $0 | $0 | $0 | $1,420 | $1,420 | $1,420 | $1,420 | $1,420 | |
| Purchase Other Current Assets | $0 | $0 | $0 | $0 | $0 | $0 | $0 | $0 | $0 | $0 | $0 | $0 | |
| Purchase Long-term Assets | $0 | $0 | $0 | $0 | $0 | $0 | $0 | $0 | $0 | $0 | $0 | $0 | |
| Dividends | $0 | $0 | $0 | $5,000 | $5,000 | $5,000 | $5,000 | $5,000 | $0 | $0 | $0 | $20,000 | |
| Subtotal Cash Spent | $364 | $8,012 | $7,893 | $17,794 | $11,794 | $14,306 | $15,607 | $18,932 | $13,303 | $11,894 | $12,754 | $33,742 | |
| Net Cash Flow | $10,984 | $2,485 | $169,662 | ($3,119) | $2,297 | $1,428 | ($1,247) | ($4,832) | $842 | $1,775 | $495 | ($17,898) | |
| Cash Balance | $11,110 | $13,595 | $183,257 | $180,139 | $182,436 | $183,864 | $182,617 | $177,785 | $178,627 | $180,401 | $180,896 | $162,998 | |
| Pro Forma Balance Sheet | |||||||||||||
| Jan | Feb | Mar | Apr | May | Jun | Jul | Aug | Sep | Oct | Nov | Dec | ||
| Assets | Starting Balances | ||||||||||||
| Current Assets | |||||||||||||
| Cash | $126 | $11,110 | $13,595 | $183,257 | $180,139 | $182,436 | $183,864 | $182,617 | $177,785 | $178,627 | $180,401 | $180,896 | $162,998 |
| Accounts Receivable | $0 | $2,003 | $3,777 | $3,642 | $4,066 | $4,345 | $4,461 | $4,451 | $4,151 | $4,118 | $4,093 | $3,943 | $4,335 |
| Inventory | $3,492 | $4,379 | $4,099 | $7,616 | $5,125 | $5,602 | $6,177 | $6,518 | $6,790 | $5,844 | $6,050 | $6,463 | $6,745 |
| Other Current Assets | $0 | $0 | $0 | $0 | $0 | $0 | $0 | $0 | $0 | $0 | $0 | $0 | $0 |
| Total Current Assets | $3,618 | $17,492 | $21,471 | $194,516 | $189,330 | $192,383 | $194,502 | $193,585 | $188,726 | $188,589 | $190,544 | $191,302 | $174,078 |
| Long-term Assets | |||||||||||||
| Long-term Assets | $23,368 | $23,368 | $23,368 | $23,368 | $23,368 | $23,368 | $23,368 | $23,368 | $23,368 | $23,368 | $23,368 | $23,368 | $23,368 |
| Accumulated Depreciation | $9,792 | $10,252 | $10,712 | $11,172 | $11,632 | $12,092 | $12,552 | $13,012 | $13,472 | $13,932 | $14,392 | $14,852 | $15,312 |
| Total Long-term Assets | $13,576 | $13,116 | $12,656 | $12,196 | $11,736 | $11,276 | $10,816 | $10,356 | $9,896 | $9,436 | $8,976 | $8,516 | $8,056 |
| Total Assets | $17,194 | $30,608 | $34,127 | $206,712 | $201,066 | $203,659 | $205,318 | $203,941 | $198,622 | $198,025 | $199,520 | $199,818 | $182,134 |
| Liabilities and Capital | Jan | Feb | Mar | Apr | May | Jun | Jul | Aug | Sep | Oct | Nov | Dec | |
| Current Liabilities | |||||||||||||
| Accounts Payable | $0 | $7,658 | $7,363 | $12,474 | $6,392 | $8,759 | $10,070 | $9,775 | $9,196 | $7,757 | $8,593 | $9,312 | $9,849 |
| Current Borrowing | $16,207 | $16,107 | $16,007 | $15,907 | $15,807 | $15,707 | $15,507 | $15,307 | $14,807 | $14,307 | $13,807 | $13,307 | $12,557 |
| Other Current Liabilities | $0 | $0 | $0 | $0 | $0 | $0 | $0 | $0 | $0 | $0 | $0 | $0 | $0 |
| Subtotal Current Liabilities | $16,207 | $23,765 | $23,370 | $28,381 | $22,199 | $24,466 | $25,577 | $25,082 | $24,003 | $22,064 | $22,400 | $22,619 | $22,406 |
| Long-term Liabilities | $0 | $0 | $0 | $165,000 | $165,000 | $165,000 | $165,000 | $165,000 | $163,580 | $162,160 | $160,740 | $159,320 | $157,900 |
| Total Liabilities | $16,207 | $23,765 | $23,370 | $193,381 | $187,199 | $189,466 | $190,577 | $190,082 | $187,583 | $184,224 | $183,140 | $181,939 | $180,306 |
| Paid-in Capital | $25,000 | $25,000 | $25,000 | $25,000 | $25,000 | $25,000 | $25,000 | $25,000 | $25,000 | $25,000 | $25,000 | $25,000 | $25,000 |
| Retained Earnings | ($9,755) | ($24,013) | ($24,013) | ($24,013) | ($29,013) | ($34,013) | ($39,013) | ($44,013) | ($49,013) | ($49,013) | ($49,013) | ($49,013) | ($69,013) |
| Earnings | ($14,258) | $5,856 | $9,770 | $12,345 | $17,880 | $23,207 | $28,753 | $32,872 | $35,052 | $37,814 | $40,393 | $41,892 | $45,841 |
| Total Capital | $987 | $6,843 | $10,757 | $13,332 | $13,867 | $14,194 | $14,740 | $13,859 | $11,039 | $13,801 | $16,380 | $17,879 | $1,828 |
| Total Liabilities and Capital | $17,194 | $30,608 | $34,127 | $206,712 | $201,066 | $203,659 | $205,318 | $203,941 | $198,622 | $198,025 | $199,520 | $199,818 | $182,134 |
| Net Worth | $987 | $6,843 | $10,757 | $13,332 | $13,867 | $14,194 | $14,740 | $13,859 | $11,039 | $13,801 | $16,380 | $17,879 | $1,828 |
| General Assumptions | |||||||||||||
| Jan | Feb | Mar | Apr | May | Jun | Jul | Aug | Sep | Oct | Nov | Dec | ||
| Plan Month | 1 | 2 | 3 | 4 | 5 | 6 | 7 | 8 | 9 | 10 | 11 | 12 | |
| Current Interest Rate | 5.00% | 5.00% | 5.00% | 5.00% | 5.00% | 5.00% | 5.00% | 5.00% | 5.00% | 5.00% | 5.00% | 5.00% | |
| Long-term Interest Rate | 5.00% | 5.00% | 5.00% | 5.00% | 5.00% | 5.00% | 5.00% | 5.00% | 5.00% | 5.00% | 5.00% | 5.00% | |
| Tax Rate | 25.00% | 25.00% | 25.00% | 25.00% | 25.00% | 25.00% | 25.00% | 25.00% | 25.00% | 25.00% | 25.00% | 25.00% | |
| Other | 0 | 0 | 0 | 0 | 0 | 0 | 0 | 0 | 0 | 0 | 0 | 0 | |


