Overture
Executive Summary
Opportunity
Problem
Scope creep. The consulting client uses the approval process to demand more consulting without more payment.
A professional consulting business normally involves a proposal — also called an engagement letter — and acceptance. The accepted proposal becomes the agreement between consultant and client on what’s to be done, when, and for how much money.
During fulfillment, a reference to the original engagement is a valuable tool for tracking progress and managing ongoing work, and avoiding scope creep. It’s a critical missing link for most consultants.
Solution
Overture compiles proposals incorporating building blocks of content including text, tables, and milestones, component tasks, and date and deadline data, with ongoing progress tracking, tickler functions, communication with clients, and billing for progress. The key differentiator, secret sauce, is easily managed tools and a conceptual framework for ending scope creep.
Market
Prospects include single professionals, small professional firms, and individuals in large firms. Pricing makes the software accessible to different levels, as little as $19.95 a month for the individual account.
Competition
Competing software
There are several good proposal management offerings.
- PandaDoc
- RFPIO
- Proposify
- Qwilr
- Bidsketch
- Osmosis
- Loopio
- Nusii
- Quote Roller
- Proposable
- Octiv
- GetAccept
None of them addresses scope creep like Overture. Most are priced well above us, few have the features we have.
The real competition
The real competition is using existing word processing tools combined with project management and billing.
Why Us?
We have a great team including three proven successful startup veterans who are in a position to invest their own funds to cover start-up investment in the middle six figures. All three have strong experience and track records related to software and consulting.
We are value-driven. We believe that we’re doing something that needs doing, will help our users succeed, and will be the best possible way to spend the money they spend.
Expectations
Forecast
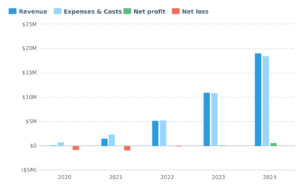
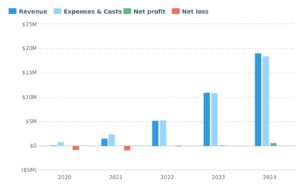
Our priority for the foreseeable future is high growth, not profits. We want to achieve the kind of high valuations that make a good opportunity for us and our investors.
Financial Highlights by Year
Financing Needed
We plan on a capital investment of $2.5 million.
- Our three founders are able to fund $240K of early seed money to build the business enough to secure a round of local angel investment.
- We plan to take in $750K angel investment in the Spring of 2020.
- Series A venture capital in Spring of 2021.
Opportunity
Problem & Solution
Problem Worth Solving
Scope creep. If you’re a serious business professional, you know the problem. You propose one thing, for one price. You deliver, and the client wants more … but for the same price.
A professional consulting business normally involves a proposal — also called an engagement letter — and acceptance. The accepted proposal becomes the agreement between consultant and client on what’s to be done, when, and for how much money. During fulfillment, a reference to the original engagement is a valuable tool for tracking progress and managing ongoing work and avoiding scope creep.
This is a business document that requires a combination of specific and generalized content. For example, most proposals include a section called something like “Background and Qualifications.” That might be standard boilerplate content, but more often it’s a combination of boilerplate and tailored content. For example, a consultant might emphasize primary market research in one proposal and mathematical modeling in another.
This is an opportunity for a software application to combine standard content, customized but repeatable content, and engagement-specific content.
Our Solution
Overture compiles proposals incorporating building blocks of content including text, tables, and milestones, component tasks, and the date and deadline data, with ongoing progress tracking, tickler functions, and communication with clients.
Target Market
Market Size & Segments
Accounting: Firms in this subsector generated $175.4 billion in revenue in 2017 (a 4.4 percent increase from 2015). Firms provided payroll services, financial auditing services, tax preparation services, and other consulting services for individuals and corporate clients. In 2016, the industry was comprised of over 130,000 firms and employed 1.2 million professionals.
Architectural services: This subsector accounted for more than $67.7 billion in revenue in 2017, with a majority of that revenue generated from non-residential construction. This sector includes firms primarily engaged in the planning and design of residential, institutional, leisure, commercial and industrial buildings, and structures. As with engineering firms, many architectural firms are small niche companies that complement the work of larger U.S. firms that have a more global footprint. In 2016, the industry was comprised of 21,600+ firms and employed 170,400 professionals.
Engineering services: This subsector posted $234 billion in revenues in 2017 (a 1.4 percent increase from the prior year). Industrial and manufacturing engineering contributed most significantly to total revenue. Other contributors included commercial and institutional architecture, transportation infrastructure, and power generation and distribution activities. The subsector includes firms primarily engaged in the design, development, and utilization of machines, materials, instruments, structures, processes, and systems.
Engineering services include the preparation of feasibility studies and preliminary and final plans and designs; the provision of technical advice and assistance during the construction or installation phase; and the inspection and evaluation of engineering projects. The industry was comprised of 60,200+ firms and employed over one million professionals in 2016.
Legal services: Legal services generated $292 billion in revenue during 2017 (a 1.6 percent increase from the prior year). Firms in this sector provided a variety of legal services including litigation support, general corporate services, plaintiff and defense work for individuals and companies, patent agent services, paralegal services, and process serving services. In 2016, the industry was comprised of more than 185,300 firms and employed nearly 1.1 million professionals.
Management consulting: This subsector accounted for $254.5 billion in revenue during 2017 (a 1.2 percent decrease from the prior year). Firms provided consulting services in administrative and general management; human resources; marketing; process, physical distribution, and logistics; environmental; and other scientific and technical services. In 2016, the industry was comprised of nearly 171,100 firms and employed over 1.2 million professionals.
Initial Target Market:
- Company size: From the solo consultant to the 10-100 employee size consulting companies.
- Professional service industries with high client communication needs are a strong initial focus.
- Non-tech savvy user looking to solve a specific problem not deploy a complicated system.
Competition
Current Alternatives
Direct Competitors:
Our Advantages
Competitive differentiation: dealing with scope creep. None of these competitors really do. But we do.
Execution
Marketing & Sales
Positioning
Overture is for consultants who want a start-to-finish solution — that manages scope creep — for consulting engagements and client relationships. We address the pain points of:
- Building proposals combining standard components and specific details.
- Transparent engagement management based on progress, steps, deliverables.
- Scope creep as clients use the approval process to expand the scope.
Decision-maker is not inclined to do a lot of competitive comparisons but may do some searching for some solutions to the specific problem. We’ll be targeting these core keywords:
- Scope creep
- Consulting management
- Client management
- Client relationships
Scope creep should be especially productive because this is what we do that no competing software does well.
Marketing and Sales Plan
Initial Strategy:
- Focus on lead generation within our website and social media. Test positioning to learn what potential customers respond to. Find 4-6 target verticals to market. Establish 6-10 local companies, inside the target verticals, to pilot.
- Tailored marketing programs to the 4-6 target verticals using social media and website.
Paid Search
- PPC, remarketing, social, Linkedin, etc.
- App/Review networks: AppSumo, G2 Crowd, TopTenReviews, etc.
Content Marketing
- Goal: Generate leads
- Strategy: Attract target consultants by transparently sharing the problems and solutions related to managing engagements and particularly scope creep. And of course include related client proposal, management, productivity, and email tips.
- Blog
- Business productivity and process optimization
- Email tactics
- Email statistics
- Email productivity hacks
- Communication advice/how-to
- Whitepapers/lead-gen downloads
Outbound
- Traditional prospecting for consultants and consulting firms
- Scrape for content related to scope creep
Secure testimonials or influencers
Self Service Sales
- Web site and sign-up process
- Engagement marketing during free trial
- Sales calls to free trials depending on lead score
Operations
Locations & Facilities
We believe in remote work. Our founders live in the Silicon Valley, Seattle, and Portland. Nobody has to move. We can hire the best of the best, from wherever they live. Two early hires will be living in Slovenia, another in Chile. Our first non-founder marketing hire lives in Austin, TX.
We work with Slack, Skype, Google Docs, email, and phones.
Technology
No need for details here; the demo shows it all. We combine some open-source, some licensable tools, and some proprietary components to bring together the best possible combination of managing content and data together in documents, tables, charts, and alerts and reminders.
Milestones & Metrics
Milestones Table
| Milestone | Due Date | Who’s Responsible |
| Alpha launch | November 05, 2019 | Matt |
| Legal docs 1 | November 29, 2019 | Lupe |
| Beta launch | January 07, 2020 | Matt |
| Angel investment campaign starts | January 15, 2020 | Lupe |
| Subscriber launch | April 08, 2020 | Matt |
| Angel investment initial “yes” | May 05, 2020 | Lupe |
| Reach100 Subscribers | December 15, 2020 | Shanna |
| Begin VC campaign | January 05, 2021 | Lupe |
| Land VC funding | May 26, 2021 | Lupe |
| 500 subscribers | June 15, 2021 | Shanna |
Key Metrics
- Churn
- LTV
- CAC
- Infrastructure cost
- LTV:CAC (unit economics)
- Upgrade revenue
Company
Overview
Ownership & Structure
Nevada C Corp. Initial ownership 1,000 shares 40% Lupe Rocha, 35% Shanna Smith, 25% Matt Kenny.
Located on the web, phones, in slack, and email. We call this remote working. Lupe is in the Silicon Valley in California, Shanna in a suburb of Seattle, and Matt in Portland, OR.
Team
Management Team
We are value-driven. We believe that we’re doing something that needs doing, will help our users succeed, and will be the best possible way to spend the money they spend.
Lupe Rocha, 34
MIT CS and Stanford MBA 10 years experience in 2 software startups including Acme that she led to sale to XYZ at $200M valuation. She was founder and CEO at Acme and took its sales of content management software from zero to $8 million annually.
We have Lupe as interim CEO, meaning she’s CEO but committed to the business, and business success, much more than to a specific title.
Matt Kenny, 52
Decades of successful consulting, early stint with McKinsey, author of a collection of proposal templates, Harvard MBA.
Matt is product lead, which is like an acting Chief Product Office but without the title and with the understanding that he wants to manage the quality, features, and functionality of the product; and that he will be happy to move over and allow room for a CTO in the future.
Shana Smith, 29
Built and successfully sold her social media and marketing software HIJ to ABC. Forbes 30 under 30. Degree in Lit from Northwestern. Shana will run the marketing for the foreseeable future but — as with Lupe and Matt — she will be ready to work with and for a CMO when growth makes that convenient.
Financial Plan
Forecast
Key Assumptions
- We leave an unrealistically high projected cash balance in the fourth and fifth year as a buffer. That’s not going to happen. If things were to go that well, we’d be reinvesting in higher growth instead of leaving that much cash.
- We have placeholders for major expenses in the further-out years. We don’t know the details but we do know we can’t have both high growth and high profits, so we choose growth. We cannot be profitable and grow at the rate we want. That’s why we intend to bring in almost $2 million in investment — to finance the deficits.
Financial Highlights by Year
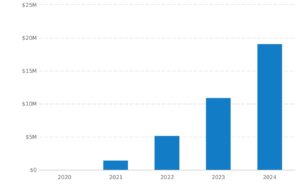
Revenue by Year
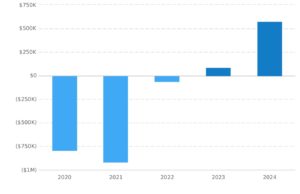
Net Profit (or Loss) by Year
Financing
Use of Funds
Use of funds is available in detail in monthly projections in the appendices. It’s essentially financing deficit spending in product development salaries and marketing expenses as we push growth way beyond the levels that revenue alone could support.
Sources of Funds
Sources and funding
- Founders: Founders expect to put in a total of $240K including $200K in the first year and another $40K to get through some thin months during the second year.
- Angel round: A combination of $750K from two regional angel groups.
- Series A VC: Projected $1.5 million.
Ongoing valuation
By the time we get the angel group funding we plan a valuation of $8 million based on a successful launch, testimonials, funds already raised, traction, and buzz in the market.
For the $1.5 million second angel round we will go for a valuation of $20 million. That will be based on all of the above plus demonstrable traction and pull.
Statements
Projected Profit & Loss
| 2020 | 2021 | 2022 | 2023 | 2024 | |
| Revenue | $50,683 | $1,492,955 | $5,190,137 | $10,978,578 | $19,085,024 |
| Direct Costs | $5,068 | $149,296 | $519,013 | $1,097,858 | $1,908,503 |
| Gross Margin | $45,615 | $1,343,659 | $4,671,123 | $9,880,720 | $17,176,522 |
| Gross Margin % | 90% | 90% | 90% | 90% | 90% |
| Operating Expenses | |||||
| Salaries & Wages | $570,150 | $1,466,900 | $2,482,784 | $4,051,100 | $6,266,240 |
| Employee Related Expenses | $114,030 | $293,380 | $496,557 | $810,220 | $1,253,248 |
| Web Marketing | $71,000 | $225,000 | $1,200,000 | $2,200,000 | $3,200,000 |
| Other Marketing | $24,000 | $36,000 | $600,000 | $2,400,000 | |
| Rent | $36,000 | $72,000 | $96,000 | $120,000 | $140,000 |
| Sales Commission | $1,520 | $44,789 | $155,704 | $329,358 | $572,550 |
| Burden on Commissions | $253 | $7,465 | $25,951 | $54,893 | $95,425 |
| Office equipment | $30,000 | $60,000 | $60,000 | $90,000 | $120,000 |
| Other Expenses | $7,000 | $43,700 | $147,300 | $1,500,000 | $2,500,000 |
| Total Operating Expenses | $829,954 | $2,237,233 | $4,700,296 | $9,755,570 | $16,547,464 |
| Operating Income | ($784,339) | ($893,574) | ($29,173) | $125,150 | $629,059 |
| Interest Incurred | $5,812 | $5,667 | $4,200 | $2,688 | |
| Depreciation and Amortization | $7,306 | $16,111 | $29,444 | $36,722 | $53,611 |
| Gain or Loss from Sale of Assets | |||||
| Income Taxes | $0 | $0 | $0 | $0 | $0 |
| Total Expenses | $842,328 | $2,408,452 | $5,254,421 | $10,894,350 | $18,512,265 |
| Net Profit | ($791,645) | ($915,497) | ($64,284) | $84,228 | $572,759 |
| Net Profit / Sales | (1,562%) | (61%) | (1%) | 1% | 3% |
Projected Balance Sheet
| 2020 | 2021 | 2022 | 2023 | 2024 | |
| Revenue | $50,683 | $1,492,955 | $5,190,137 | $10,978,578 | $19,085,024 |
| Direct Costs | $5,068 | $149,296 | $519,013 | $1,097,858 | $1,908,503 |
| Gross Margin | $45,615 | $1,343,659 | $4,671,123 | $9,880,720 | $17,176,522 |
| Gross Margin % | 90% | 90% | 90% | 90% | 90% |
| Operating Expenses | |||||
| Salaries & Wages | $570,150 | $1,466,900 | $2,482,784 | $4,051,100 | $6,266,240 |
| Employee Related Expenses | $114,030 | $293,380 | $496,557 | $810,220 | $1,253,248 |
| Web Marketing | $71,000 | $225,000 | $1,200,000 | $2,200,000 | $3,200,000 |
| Other Marketing | $24,000 | $36,000 | $600,000 | $2,400,000 | |
| Rent | $36,000 | $72,000 | $96,000 | $120,000 | $140,000 |
| Sales Commission | $1,520 | $44,789 | $155,704 | $329,358 | $572,550 |
| Burden on Commissions | $253 | $7,465 | $25,951 | $54,893 | $95,425 |
| Office equipment | $30,000 | $60,000 | $60,000 | $90,000 | $120,000 |
| Other Expenses | $7,000 | $43,700 | $147,300 | $1,500,000 | $2,500,000 |
| Total Operating Expenses | $829,954 | $2,237,233 | $4,700,296 | $9,755,570 | $16,547,464 |
| Operating Income | ($784,339) | ($893,574) | ($29,173) | $125,150 | $629,059 |
| Interest Incurred | $5,812 | $5,667 | $4,200 | $2,688 | |
| Depreciation and Amortization | $7,306 | $16,111 | $29,444 | $36,722 | $53,611 |
| Gain or Loss from Sale of Assets | |||||
| Income Taxes | $0 | $0 | $0 | $0 | $0 |
| Total Expenses | $842,328 | $2,408,452 | $5,254,421 | $10,894,350 | $18,512,265 |
| Net Profit | ($791,645) | ($915,497) | ($64,284) | $84,228 | $572,759 |
| Net Profit / Sales | (1,562%) | (61%) | (1%) | 1% | 3% |
Projected Cash Flow Statement
| 2020 | 2021 | 2022 | 2023 | 2024 | |
| Net Cash Flow from Operations | |||||
| Net Profit | ($791,645) | ($915,497) | ($64,284) | $84,228 | $572,759 |
| Depreciation & Amortization | $7,306 | $16,111 | $29,444 | $36,722 | $53,611 |
| Change in Accounts Receivable | $0 | $0 | $0 | $0 | $0 |
| Change in Inventory | |||||
| Change in Accounts Payable | $28,964 | $73,738 | $205,784 | $483,718 | $624,266 |
| Change in Income Tax Payable | $0 | $0 | $0 | $0 | $0 |
| Change in Sales Tax Payable | $3,188 | $48,169 | $77,916 | $135,279 | $168,614 |
| Change in Prepaid Revenue | $0 | $0 | $0 | $0 | $0 |
| Net Cash Flow from Operations | ($752,187) | ($777,479) | $248,861 | $739,947 | $1,419,250 |
| Investing & Financing | |||||
| Assets Purchased or Sold | ($25,000) | ($40,000) | ($40,000) | ($50,000) | ($100,000) |
| Net Cash from Investing | ($25,000) | ($40,000) | ($40,000) | ($50,000) | ($100,000) |
| Investments Received | $990,000 | $1,500,000 | |||
| Dividends & Distributions | |||||
| Change in Short-Term Debt | $48,237 | $1,467 | $1,512 | $1,558 | |
| Change in Long-Term Debt | $162,655 | ($49,704) | ($51,216) | ($52,774) | |
| Net Cash from Financing | $990,000 | $1,710,892 | ($48,237) | ($49,704) | ($51,216) |
| Cash at Beginning of Period | $0 | $212,813 | $1,106,226 | $1,266,850 | $1,907,093 |
| Net Change in Cash | $212,813 | $893,413 | $160,624 | $640,243 | $1,268,034 |
| Cash at End of Period | $212,813 | $1,106,226 | $1,266,850 | $1,907,093 | $3,175,127 |


