
McKenzie Roller Rink
Executive Summary
McKenzie Roller Rink is a state of the art facility offering recreational skating to individuals as well as catering to large and small group gatherings. The rink has been at its present location for five years and was formerly known as Roller Kingdom. Due to mismanagement McKenzie Roller Rink has taken over the business with no capital outlay. The rink is located in Eugene, Oregon and has excellent access to major roads and interstates.
With upgraded facilities McKenzie Roller Rink will provide a unique recreational opportunity to the greater Lane County area. A concessions area will serve a wide variety of food choices. Party rooms are available for large groups such as civic organizations, church groups, and school functions. With a dedicated staff McKenzie Roller Rink will be ready to give excellent customer service and would like to see continued growth in dedicated customers. McKenzie Roller Rink will target local markets with special focus given to the large groups looking for a facility to hold their parties and functions.
With an emphasis on customer service McKenzie Roller Rink will differentiate itself from other recreational opportunities in the area by establishing a welcoming friendly atmosphere for the consumers in our target market. It is important to build long-term relationships with civic groups, church groups, and school groups. We will also be involved in community activities. We can’t just market and sell our services, we must deliver those services with a focus on excellence. McKenzie Roller Rink will provide a website that will appeal to all kinds of customers looking for recreational alternatives. Times of operations, descriptions of our facilities, and the costs will be included in the site.
Our management philosophy is based on responsibility and mutual respect. People who work at McKenzie Roller Rink will work in an environment that encourages creativity and having fun. Along with a team of 10 employees, Don Jones will play an active roll in the day to day operations of the facility. Don is the majority owner and has years of experience in running this kind of facility. The other two owners, David Barkley and Paul Robins, will join Don in forming strong leadership for the company. McKenzie Roller Rink would like to see first year sales at over $400,000 with a five to nine percent increase for year two.

1.1 Mission
McKenzie Roller Rink provides recreational skating to the general public as well as private bookings for group activities. With excellent party facilities and concessions that provide a wide choice of food items, McKenzie Roller Rink is dedicated to providing a first class skating facility that will facilitate family-centered activity. Customer service is going to be a focus with the intent of keeping a positive, fun atmosphere. McKenzie Roller Rink will make safety for our patrons a top priority. Employees of McKenzie Roller Rink are considered a valuable asset to the company and will be treated in such a manner.
1.2 Objectives
- Sales increasing to more than $1 million by the third year.
- Bring gross margin back up to above 90%, and maintain that level.
- Increase a customer approval rating by 20% by the second year.
1.3 Keys to Success
The keys to success in this business are:
- Marketing: Increasing the interest in skating as a recreational activity.
- Facilities: Providing an attractive facility that caters to individual and group activities.
- Customer Service: Provide the kind of customer service that makes the patron feel valuable and create the desire to come back.
Company Summary
McKenzie Roller Rink is a new enterprise that has taken over an existing facility and has made several improvements. The company that previously leased the building was called Roller Kingdom. The building was leased and upgraded five years ago by the owners of Roller Kingdom, however Roller Kingdom went out of business due to mismanagement. McKenzie Roller Rink has negotiated a lease with the building owners and were able to take over the business with no capital outlay. With an agressive management style and marketing plan, McKenzie Roller Rink plans to offer a unique recreational opportunity that will cater to families as well as civic organizations, schools, and church youth groups. Therefore the numbers in the start-up table reflect just basic start-up expenses, there are no business purchase expenses.
2.1 Company Ownership
McKenzie Roller Rink is a privately-held C corporation owned in majority by president Don Jones. There are two part owners, David Barkley, our attorney; and Paul Robins, our public relations and marketing consultant. Neither owns more than 15%, but both are active participants in management decisions.
2.2 Start-up Summary
Our start-up costs come to $43,000, which is mostly building renovation and the purchase of new equipment. The start-up costs are to be financed by direct owner investment as well as our other two independent investors.

| Start-up | |
| Requirements | |
| Start-up Expenses | |
| Legal | $1,500 |
| Stationery etc. | $500 |
| Brochures | $1,000 |
| Consultants | $1,500 |
| Insurance | $2,000 |
| Rent | $4,000 |
| Renovations | $10,000 |
| Expensed Equipment | $10,000 |
| Website | $2,500 |
| Total Start-up Expenses | $33,000 |
| Start-up Assets | |
| Cash Required | $94,000 |
| Start-up Inventory | $5,000 |
| Other Current Assets | $2,000 |
| Long-term Assets | $0 |
| Total Assets | $101,000 |
| Total Requirements | $134,000 |
| Start-up Funding | |
| Start-up Expenses to Fund | $33,000 |
| Start-up Assets to Fund | $101,000 |
| Total Funding Required | $134,000 |
| Assets | |
| Non-cash Assets from Start-up | $7,000 |
| Cash Requirements from Start-up | $94,000 |
| Additional Cash Raised | $0 |
| Cash Balance on Starting Date | $94,000 |
| Total Assets | $101,000 |
| Liabilities and Capital | |
| Liabilities | |
| Current Borrowing | $0 |
| Long-term Liabilities | $0 |
| Accounts Payable (Outstanding Bills) | $14,000 |
| Other Current Liabilities (interest-free) | $0 |
| Total Liabilities | $14,000 |
| Capital | |
| Planned Investment | |
| Don Jones | $70,000 |
| David Barkley | $35,000 |
| Paul Robins | $15,000 |
| Additional Investment Requirement | $0 |
| Total Planned Investment | $120,000 |
| Loss at Start-up (Start-up Expenses) | ($33,000) |
| Total Capital | $87,000 |
| Total Capital and Liabilities | $101,000 |
| Total Funding | $134,000 |
Products and Services
McKenzie Roller Rink is a state of the art roller rink providing a unique recreational opportunity to the greater Lane County region. A concessions area will serve a wide variety of food choices and party rooms are available to meet the needs of small and large groups such as church youth groups, school functions, and civic organizations. With a dedicated staff McKenzie Roller Rink is ready to give excellent customer service and would like to see continued growth in dedicated customers.
Market Analysis Summary
McKenzie Roller Rink will focus on local markets including civic groups, school groups and church groups. Special focus will be placed on large group activity such as parties and school functions.
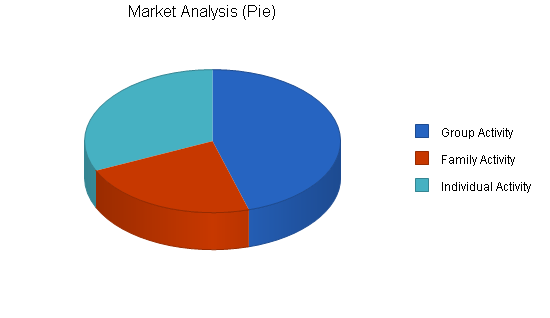
4.1 Market Segmentation
Our market segmentation is broken into three specific groups. Civic organizations, school groups, and church groups are key target markets for McKenzie Roller Rink. Parties with over ten people would be considered a group. It is our intent to create a wholesome family atmosphere and so there will be an effort to encourage families to consider skating as a recreational option. Finally we will target the greater Lane County area to encourage individual activity (groups under ten).
| Market Analysis | |||||||
| Year 1 | Year 2 | Year 3 | Year 4 | Year 5 | |||
| Potential Customers | Growth | CAGR | |||||
| Group Activity | 15% | 10,000 | 11,500 | 13,225 | 15,209 | 17,490 | 15.00% |
| Family Activity | 10% | 5,000 | 5,500 | 6,050 | 6,655 | 7,321 | 10.00% |
| Individual Activity | 10% | 7,000 | 7,700 | 8,470 | 9,317 | 10,249 | 10.00% |
| Total | 12.36% | 22,000 | 24,700 | 27,745 | 31,181 | 35,060 | 12.36% |
4.2 Target Market Segment Strategy
Our choice of target markets is strategic. We believe that with the right facility and the right marketing plan, skating is a recreational activity that still has great potential. Youth groups of all kinds are always planning activities and we intend to provide a choice that will fill the need for a safe, well supervised facility that is fun. In addition, youth attending the facility in groups will experience the facility and activity and the families of those youth will become aware of McKenzie Roller Rink as an entertainment option.

The closest skating facility is over 50 miles away so we will be the only skating facility in the greater Lane County area. Without direct competition it is our intent to market to all segments of Lane County. We are looking for customers who care about having a top notch facility with customer service that will make their night of skating an enjoyable one. Safety will be a priority, we will closely monitor all activity in our facility.
4.3 Service Business Analysis
We are a skating facility which serves the greater Lane County area:
- Groups: People who are looking for a recreational alternative that will accommodate groups for parties and other functions.
- Families: People who are looking for fun activities that they can do together.
- Individual: People who are looking for a place to come and enjoy skating in a great facility. Parents will have a place they can trust to drop their kids off.
4.3.1 Competition and Buying Patterns
The recreational consumer understands the concept of service, and are much more likely to engage in the activity when they are assured the activity is in a safe and fun facility.
Though we do not have any direct competition we will still have to gain the public’s trust and business through an aggressive marketing plan as consumers do have alternative forms of entertainment.
Indirect competition comes from other recreation activities in the area, for example, bowling alleys, movie theatres and restaurants.
Our focus group sessions indicated that our target markets think about quality facilities, customer service, and wholesome family fun. There also is a need for a facility to host group parties and such.
Strategy and Implementation Summary
Differentiate and fulfill the promise.
We must differentiate ourselves from other recreational opportunities in the area. We need to establish a logical and viable alternative for our target market.
Build a relationship-oriented business.
Build long-term relationships with civic groups, school groups, church groups, and the community as a whole. Be supportive and involved in community activities.
Focus on target markets.
We need to focus our efforts on what our facilities have to offer small to large groups of people. Also focus on the outlying target markets in Lane County.
Emphasize customer service and support.
We can’t just market and sell our services, we must actually deliver as well. We need to make sure we have the ability to provide a top-notch facility that will be customer friendly.
5.1 Marketing Strategy
The marketing strategy is the core of the main strategy:
- Emphasize customer service.
- Build relationships with civic groups, church groups, school groups.
- Provide an attractive facility that people will come back to.
5.2 Sales Strategy
We need to sell people on our quality facilities. We sell a quality recreational entertainment option that is affordable and fun.
We have to sell our customer service and safety. Skating is an activity that is conducive to both large groups as well as the individual and we need to give our customers a facility that they can have a quality experience.
5.2.1 Sales Forecast
The important elements of the sales forecast are shown in the following table. The total sales increase to about $515,000 in the third year. The sales forecast table also reflects a slow down in the summer due to school being out and other summer recreational opportunities available to out customers. Concessions will supply a large part of the revenue and we will strive to continue to make improvements in our food choices.


| Sales Forecast | |||
| Year 1 | Year 2 | Year 3 | |
| Sales | |||
| Skate Rental & Sales | $73,000 | $92,000 | $105,000 |
| Skating | $197,000 | $225,000 | $240,000 |
| Concessions | $135,000 | $150,000 | $170,000 |
| Total Sales | $405,000 | $467,000 | $515,000 |
| Direct Cost of Sales | Year 1 | Year 2 | Year 3 |
| Skate Rental & Sales | $2,180 | $1,840 | $2,100 |
| Skating | $0 | $0 | $0 |
| Concessions | $40,500 | $45,000 | $51,000 |
| Subtotal Direct Cost of Sales | $42,680 | $46,840 | $53,100 |
5.3 Competitive Edge
McKenzie Roller Rink does not have any direct competition from another roller rink. This fact will not make us complacent but will make us work that much harder to provide a quality product. We will not only serve people already aware of the benefits of skating, we will concentrate our efforts on a marketing plan that will attract people looking for a recreational option that they may not have considered before. With a top-notch facility and a friendly customer conscious staff, McKenzie Roller Rink intends to become a viable option for families, groups, and the general public.
5.4 Milestones
Mr. Jones will be responsible for the business plan and Web plan. Mr. Robins will be responsible for contracting with the painters, food vendors and for the new equipment. Mr. Barkley will be responsible for the accounting plan.
| Milestones | |||||
| Milestone | Start Date | End Date | Budget | Manager | Department |
| Business Plan | 1/10/2003 | 1/20/2003 | $1,000 | Don Jones | Majority Owner |
| Re-paint Interior | 2/1/2003 | 2/15/2003 | $2,500 | Paul Robins | Administrator |
| Accounting Plan | 2/29/2003 | 3/15/2003 | $1,000 | David Barkley | Accounting |
| Marketing & Advertising | 4/20/2003 | 6/15/2003 | $3,000 | Ken Wise | Consultant |
| Sourcing Food Vendors | 4/5/2003 | 4/30/2003 | $1,000 | Paul Robins | Administrator |
| Sourcing New Equipment | 5/6/2003 | 6/5/2003 | $1,000 | Paul Robins | Administrator |
| Web Plan | 6/8/2003 | 7/2/2003 | $1,000 | Don Jones | Majority Owner |
| Totals | $10,500 | ||||
Web Plan Summary
The McKenzie Roller Rink will focus on providing a website with information that will give a detailed description of our facility, times of operation, and all associated costs.
McKenzie Roller Rink will provide a website that will appeal to all kinds of consumers. A database will be kept that will help in future marketing endeavors. Using Web services provided by our Internet provider, we will be able to track what domain users get to our site from. This will help us decide where our Web marketing dollar is best spent.
6.1 Website Marketing Strategy
More and more people are looking for a recreational opportunity that they can either participate in as a family or a group activity. It is the intent of McKenzie Roller Rink to promote such an opportunity, and through our website we intend to promote our quality facility that is ideal for groups large and small.
The main focus for McKenzie Roller Rink website will be:
- A detailed view of our facilities through photographs.
- A list of all our times of operation.
- A description of what our facility has to offer large and small groups.
- A description of our concessions area and the kinds of food and beverages we serve.
6.2 Development Requirements
McKenzie Roller Rink website will be initially developed with few technical resources. A simple hosting provider, AOL Web services, will host the site.
McKenzie Roller Rink will work with a contracted user interface designer to develop a simple, but informative Internet-focused site. The user interface designer will work with Don Jones to come up with a website logo, and the website graphics. Initially a $1,000 dollars will be invested into the implementation of this site.
The maintenance of the site will be done by McKenzie Roller Rink and as the website evolves it is possible that we will look into developing newsletters and downloadable market research reports. McKenzie Roller Rink can also look into pre-packaged solutions through AOL Web services.
Management Summary
Our management philosophy is based on responsibility and mutual respect. People who work at McKenzie Roller Rink want to work here because we have an environment that encourages creativity and fun. The team includes 10 employees, under one majority owner and two partial owners. Don Jones will play an active role in the day to day business operations of the Rink. Don has owned several ice skating rinks in the Mid-West and has a wealth of experience in successfully running this kind of facility. Both David Barkley and Paul Robins have been working in the Lane County area for years leading successful companies. Together the owners will make a strong team and will lead McKenzie Roller Rink with sound business experience.
7.1 Personnel Plan
The Personnel Plan reflects the need to keep our workforce at no more than nine full and part time employees. Our total employment should not increase the first year. Detailed monthly projections are included in the appendix.
| Personnel Plan | |||
| Year 1 | Year 2 | Year 3 | |
| Don Jones | $42,000 | $44,000 | $46,000 |
| David Barkley | $36,000 | $38,000 | $40,000 |
| Paul Robins | $30,000 | $32,000 | $34,000 |
| Part Time | $10,800 | $12,000 | $13,500 |
| Part Time | $10,800 | $12,000 | $13,500 |
| Part Time | $10,800 | $12,000 | $13,500 |
| Full Time | $21,600 | $23,000 | $24,500 |
| Full Time | $21,600 | $23,000 | $24,500 |
| Full Time | $21,600 | $23,000 | $24,500 |
| Total People | 9 | 9 | 9 |
| Total Payroll | $205,200 | $219,000 | $234,000 |
Financial Plan
The financial plan contains these essential factors:
- A growth rate of 5% for the year 2004.
- Do not depend on credit lines to support cash flow.
- An average sales per business day (305 days per year) in excess of $1,000.
8.1 Important Assumptions
The financial plan depends on Important Assumptions, most of which are shown in the following table. The key underlying assumptions are:
- We assume a slow-growth economy, without major recession.
- We assume there will not be any direct competitors for at least several years.
- We assume access to equity capital and financing sufficient to maintain our financial plan as shown in the tables.
| General Assumptions | |||
| Year 1 | Year 2 | Year 3 | |
| Plan Month | 1 | 2 | 3 |
| Current Interest Rate | 8.00% | 8.00% | 8.00% |
| Long-term Interest Rate | 15.00% | 15.00% | 15.00% |
| Tax Rate | 30.00% | 30.00% | 30.00% |
| Other | 0 | 0 | 0 |
8.2 Break-even Analysis
Our Break-even Analysis is shown below.

| Break-even Analysis | |
| Monthly Revenue Break-even | $35,022 |
| Assumptions: | |
| Average Percent Variable Cost | 11% |
| Estimated Monthly Fixed Cost | $31,332 |
8.3 Projected Profit and Loss
The most important assumption in the Projected Profit and Loss statement is a steady growth into 2006. The increase in gross margin is based on an agressive marketing approach, and it is critical.
Month-by-month assumptions for profit and loss are included in the appendix.


| Pro Forma Profit and Loss | |||
| Year 1 | Year 2 | Year 3 | |
| Sales | $405,000 | $467,000 | $515,000 |
| Direct Cost of Sales | $42,680 | $46,840 | $53,100 |
| Other Costs of Goods | $0 | $0 | $0 |
| Total Cost of Sales | $42,680 | $46,840 | $53,100 |
| Gross Margin | $362,320 | $420,160 | $461,900 |
| Gross Margin % | 89.46% | 89.97% | 89.69% |
| Expenses | |||
| Payroll | $205,200 | $219,000 | $234,000 |
| Sales and Marketing and Other Expenses | $50,000 | $60,000 | $65,000 |
| Depreciation | $0 | $0 | $0 |
| Rent | $42,000 | $45,000 | $48,000 |
| Utilities | $12,000 | $14,000 | $14,000 |
| Insurance | $12,000 | $14,000 | $16,000 |
| Payroll Taxes | $30,780 | $32,850 | $35,100 |
| Other | $24,000 | $30,000 | $35,000 |
| Total Operating Expenses | $375,980 | $414,850 | $447,100 |
| Profit Before Interest and Taxes | ($13,660) | $5,310 | $14,800 |
| EBITDA | ($13,660) | $5,310 | $14,800 |
| Interest Expense | $0 | $0 | $0 |
| Taxes Incurred | $0 | $1,593 | $4,440 |
| Net Profit | ($13,660) | $3,717 | $10,360 |
| Net Profit/Sales | -3.37% | 0.80% | 2.01% |
8.4 Projected Cash Flow
The following table and chart illustrate McKenzie Roller Rink’s cash flow situation. Cash Flow will be negative for year one as we start up the business and slowly create awareness about our facility. We have planned for this with enough extra cash to keep the cash balance positive.

| Pro Forma Cash Flow | |||
| Year 1 | Year 2 | Year 3 | |
| Cash Received | |||
| Cash from Operations | |||
| Cash Sales | $405,000 | $467,000 | $515,000 |
| Subtotal Cash from Operations | $405,000 | $467,000 | $515,000 |
| Additional Cash Received | |||
| Sales Tax, VAT, HST/GST Received | $0 | $0 | $0 |
| New Current Borrowing | $0 | $0 | $0 |
| New Other Liabilities (interest-free) | $0 | $0 | $0 |
| New Long-term Liabilities | $0 | $0 | $0 |
| Sales of Other Current Assets | $0 | $0 | $0 |
| Sales of Long-term Assets | $0 | $0 | $0 |
| New Investment Received | $0 | $0 | $0 |
| Subtotal Cash Received | $405,000 | $467,000 | $515,000 |
| Expenditures | Year 1 | Year 2 | Year 3 |
| Expenditures from Operations | |||
| Cash Spending | $205,200 | $219,000 | $234,000 |
| Bill Payments | $207,429 | $243,718 | $269,060 |
| Subtotal Spent on Operations | $412,629 | $462,718 | $503,060 |
| Additional Cash Spent | |||
| Sales Tax, VAT, HST/GST Paid Out | $0 | $0 | $0 |
| Principal Repayment of Current Borrowing | $0 | $0 | $0 |
| Other Liabilities Principal Repayment | $0 | $0 | $0 |
| Long-term Liabilities Principal Repayment | $0 | $0 | $0 |
| Purchase Other Current Assets | $0 | $0 | $0 |
| Purchase Long-term Assets | $0 | $0 | $0 |
| Dividends | $0 | $0 | $0 |
| Subtotal Cash Spent | $412,629 | $462,718 | $503,060 |
| Net Cash Flow | ($7,629) | $4,282 | $11,940 |
| Cash Balance | $86,371 | $90,653 | $102,593 |
8.5 Projected Balance Sheet
The balance sheet is quite solid. We do not project any real trouble meeting our debt obligations – as long as we can achieve our specific objectives.
| Pro Forma Balance Sheet | |||
| Year 1 | Year 2 | Year 3 | |
| Assets | |||
| Current Assets | |||
| Cash | $86,371 | $90,653 | $102,593 |
| Inventory | $4,114 | $4,515 | $5,118 |
| Other Current Assets | $2,000 | $2,000 | $2,000 |
| Total Current Assets | $92,485 | $97,168 | $109,711 |
| Long-term Assets | |||
| Long-term Assets | $0 | $0 | $0 |
| Accumulated Depreciation | $0 | $0 | $0 |
| Total Long-term Assets | $0 | $0 | $0 |
| Total Assets | $92,485 | $97,168 | $109,711 |
| Liabilities and Capital | Year 1 | Year 2 | Year 3 |
| Current Liabilities | |||
| Accounts Payable | $19,145 | $20,111 | $22,294 |
| Current Borrowing | $0 | $0 | $0 |
| Other Current Liabilities | $0 | $0 | $0 |
| Subtotal Current Liabilities | $19,145 | $20,111 | $22,294 |
| Long-term Liabilities | $0 | $0 | $0 |
| Total Liabilities | $19,145 | $20,111 | $22,294 |
| Paid-in Capital | $120,000 | $120,000 | $120,000 |
| Retained Earnings | ($33,000) | ($46,660) | ($42,943) |
| Earnings | ($13,660) | $3,717 | $10,360 |
| Total Capital | $73,340 | $77,057 | $87,417 |
| Total Liabilities and Capital | $92,485 | $97,168 | $109,711 |
| Net Worth | $73,340 | $77,057 | $87,417 |
8.6 Business Ratios
Business Ratios for the years of this plan are shown below. Industry profile ratios based on the Standard Industrial Classification (SIC) code 7999, Roller Rinks are shown for comparison.
The following will enable us to keep on track. If we fail in any of these areas, we will need to re-evaluate our business model:
- Gross margins at or above 88%.
- Do not depend on credit line to meet cash requirements.
- Month-to-month annual comparisons indicate an increase of 5% or greater.
| Ratio Analysis | ||||
| Year 1 | Year 2 | Year 3 | Industry Profile | |
| Sales Growth | 0.00% | 15.31% | 10.28% | 5.73% |
| Percent of Total Assets | ||||
| Inventory | 4.45% | 4.65% | 4.67% | 2.87% |
| Other Current Assets | 2.16% | 2.06% | 1.82% | 33.26% |
| Total Current Assets | 100.00% | 100.00% | 100.00% | 43.21% |
| Long-term Assets | 0.00% | 0.00% | 0.00% | 56.79% |
| Total Assets | 100.00% | 100.00% | 100.00% | 100.00% |
| Current Liabilities | 20.70% | 20.70% | 20.32% | 21.91% |
| Long-term Liabilities | 0.00% | 0.00% | 0.00% | 28.81% |
| Total Liabilities | 20.70% | 20.70% | 20.32% | 50.72% |
| Net Worth | 79.30% | 79.30% | 79.68% | 49.28% |
| Percent of Sales | ||||
| Sales | 100.00% | 100.00% | 100.00% | 100.00% |
| Gross Margin | 89.46% | 89.97% | 89.69% | 100.00% |
| Selling, General & Administrative Expenses | 92.83% | 89.17% | 87.68% | 76.43% |
| Advertising Expenses | 0.00% | 0.00% | 0.00% | 2.77% |
| Profit Before Interest and Taxes | -3.37% | 1.14% | 2.87% | 1.89% |
| Main Ratios | ||||
| Current | 4.83 | 4.83 | 4.92 | 1.18 |
| Quick | 4.62 | 4.61 | 4.69 | 0.80 |
| Total Debt to Total Assets | 20.70% | 20.70% | 20.32% | 1.76% |
| Pre-tax Return on Net Worth | -18.63% | 6.89% | 16.93% | 61.12% |
| Pre-tax Return on Assets | -14.77% | 5.46% | 13.49% | 4.52% |
| Additional Ratios | Year 1 | Year 2 | Year 3 | |
| Net Profit Margin | -3.37% | 0.80% | 2.01% | n.a |
| Return on Equity | -18.63% | 4.82% | 11.85% | n.a |
| Activity Ratios | ||||
| Inventory Turnover | 10.91 | 10.86 | 11.02 | n.a |
| Accounts Payable Turnover | 11.10 | 12.17 | 12.17 | n.a |
| Payment Days | 29 | 29 | 29 | n.a |
| Total Asset Turnover | 4.38 | 4.81 | 4.69 | n.a |
| Debt Ratios | ||||
| Debt to Net Worth | 0.26 | 0.26 | 0.26 | n.a |
| Current Liab. to Liab. | 1.00 | 1.00 | 1.00 | n.a |
| Liquidity Ratios | ||||
| Net Working Capital | $73,340 | $77,057 | $87,417 | n.a |
| Interest Coverage | 0.00 | 0.00 | 0.00 | n.a |
| Additional Ratios | ||||
| Assets to Sales | 0.23 | 0.21 | 0.21 | n.a |
| Current Debt/Total Assets | 21% | 21% | 20% | n.a |
| Acid Test | 4.62 | 4.61 | 4.69 | n.a |
| Sales/Net Worth | 5.52 | 6.06 | 5.89 | n.a |
| Dividend Payout | 0.00 | 0.00 | 0.00 | n.a |
Appendix
| Sales Forecast | |||||||||||||
| Month 1 | Month 2 | Month 3 | Month 4 | Month 5 | Month 6 | Month 7 | Month 8 | Month 9 | Month 10 | Month 11 | Month 12 | ||
| Sales | |||||||||||||
| Skate Rental & Sales | 0% | $4,000 | $5,000 | $7,000 | $7,000 | $7,000 | $5,000 | $5,000 | $5,000 | $7,000 | $7,000 | $7,000 | $7,000 |
| Skating | 0% | $14,000 | $15,000 | $18,000 | $18,000 | $18,000 | $14,000 | $14,000 | $14,000 | $18,000 | $18,000 | $18,000 | $18,000 |
| Concessions | 0% | $10,000 | $11,000 | $12,000 | $12,000 | $12,000 | $10,000 | $10,000 | $10,000 | $12,000 | $12,000 | $12,000 | $12,000 |
| Total Sales | $28,000 | $31,000 | $37,000 | $37,000 | $37,000 | $29,000 | $29,000 | $29,000 | $37,000 | $37,000 | $37,000 | $37,000 | |
| Direct Cost of Sales | Month 1 | Month 2 | Month 3 | Month 4 | Month 5 | Month 6 | Month 7 | Month 8 | Month 9 | Month 10 | Month 11 | Month 12 | |
| Skate Rental & Sales | $800 | $100 | $140 | $140 | $140 | $100 | $100 | $100 | $140 | $140 | $140 | $140 | |
| Skating | $0 | $0 | $0 | $0 | $0 | $0 | $0 | $0 | $0 | $0 | $0 | $0 | |
| Concessions | $3,000 | $3,300 | $3,600 | $3,600 | $3,600 | $3,000 | $3,000 | $3,000 | $3,600 | $3,600 | $3,600 | $3,600 | |
| Subtotal Direct Cost of Sales | $3,800 | $3,400 | $3,740 | $3,740 | $3,740 | $3,100 | $3,100 | $3,100 | $3,740 | $3,740 | $3,740 | $3,740 | |
| Personnel Plan | |||||||||||||
| Month 1 | Month 2 | Month 3 | Month 4 | Month 5 | Month 6 | Month 7 | Month 8 | Month 9 | Month 10 | Month 11 | Month 12 | ||
| Don Jones | 0% | $3,500 | $3,500 | $3,500 | $3,500 | $3,500 | $3,500 | $3,500 | $3,500 | $3,500 | $3,500 | $3,500 | $3,500 |
| David Barkley | 0% | $3,000 | $3,000 | $3,000 | $3,000 | $3,000 | $3,000 | $3,000 | $3,000 | $3,000 | $3,000 | $3,000 | $3,000 |
| Paul Robins | 0% | $2,500 | $2,500 | $2,500 | $2,500 | $2,500 | $2,500 | $2,500 | $2,500 | $2,500 | $2,500 | $2,500 | $2,500 |
| Part Time | 0% | $900 | $900 | $900 | $900 | $900 | $900 | $900 | $900 | $900 | $900 | $900 | $900 |
| Part Time | 0% | $900 | $900 | $900 | $900 | $900 | $900 | $900 | $900 | $900 | $900 | $900 | $900 |
| Part Time | 0% | $900 | $900 | $900 | $900 | $900 | $900 | $900 | $900 | $900 | $900 | $900 | $900 |
| Full Time | 0% | $1,800 | $1,800 | $1,800 | $1,800 | $1,800 | $1,800 | $1,800 | $1,800 | $1,800 | $1,800 | $1,800 | $1,800 |
| Full Time | 0% | $1,800 | $1,800 | $1,800 | $1,800 | $1,800 | $1,800 | $1,800 | $1,800 | $1,800 | $1,800 | $1,800 | $1,800 |
| Full Time | 0% | $1,800 | $1,800 | $1,800 | $1,800 | $1,800 | $1,800 | $1,800 | $1,800 | $1,800 | $1,800 | $1,800 | $1,800 |
| Total People | 9 | 9 | 9 | 9 | 9 | 9 | 9 | 9 | 9 | 9 | 9 | 9 | |
| Total Payroll | $17,100 | $17,100 | $17,100 | $17,100 | $17,100 | $17,100 | $17,100 | $17,100 | $17,100 | $17,100 | $17,100 | $17,100 | |
| General Assumptions | |||||||||||||
| Month 1 | Month 2 | Month 3 | Month 4 | Month 5 | Month 6 | Month 7 | Month 8 | Month 9 | Month 10 | Month 11 | Month 12 | ||
| Plan Month | 1 | 2 | 3 | 4 | 5 | 6 | 7 | 8 | 9 | 10 | 11 | 12 | |
| Current Interest Rate | 8.00% | 8.00% | 8.00% | 8.00% | 8.00% | 8.00% | 8.00% | 8.00% | 8.00% | 8.00% | 8.00% | 8.00% | |
| Long-term Interest Rate | 15.00% | 15.00% | 15.00% | 15.00% | 15.00% | 15.00% | 15.00% | 15.00% | 15.00% | 15.00% | 15.00% | 15.00% | |
| Tax Rate | 30.00% | 30.00% | 30.00% | 30.00% | 30.00% | 30.00% | 30.00% | 30.00% | 30.00% | 30.00% | 30.00% | 30.00% | |
| Other | 0 | 0 | 0 | 0 | 0 | 0 | 0 | 0 | 0 | 0 | 0 | 0 | |
| Pro Forma Profit and Loss | |||||||||||||
| Month 1 | Month 2 | Month 3 | Month 4 | Month 5 | Month 6 | Month 7 | Month 8 | Month 9 | Month 10 | Month 11 | Month 12 | ||
| Sales | $28,000 | $31,000 | $37,000 | $37,000 | $37,000 | $29,000 | $29,000 | $29,000 | $37,000 | $37,000 | $37,000 | $37,000 | |
| Direct Cost of Sales | $3,800 | $3,400 | $3,740 | $3,740 | $3,740 | $3,100 | $3,100 | $3,100 | $3,740 | $3,740 | $3,740 | $3,740 | |
| Other Costs of Goods | $0 | $0 | $0 | $0 | $0 | $0 | $0 | $0 | $0 | $0 | $0 | $0 | |
| Total Cost of Sales | $3,800 | $3,400 | $3,740 | $3,740 | $3,740 | $3,100 | $3,100 | $3,100 | $3,740 | $3,740 | $3,740 | $3,740 | |
| Gross Margin | $24,200 | $27,600 | $33,260 | $33,260 | $33,260 | $25,900 | $25,900 | $25,900 | $33,260 | $33,260 | $33,260 | $33,260 | |
| Gross Margin % | 86.43% | 89.03% | 89.89% | 89.89% | 89.89% | 89.31% | 89.31% | 89.31% | 89.89% | 89.89% | 89.89% | 89.89% | |
| Expenses | |||||||||||||
| Payroll | $17,100 | $17,100 | $17,100 | $17,100 | $17,100 | $17,100 | $17,100 | $17,100 | $17,100 | $17,100 | $17,100 | $17,100 | |
| Sales and Marketing and Other Expenses | $4,000 | $4,000 | $4,500 | $4,500 | $4,500 | $3,000 | $3,000 | $3,000 | $4,500 | $5,000 | $5,000 | $5,000 | |
| Depreciation | $0 | $0 | $0 | $0 | $0 | $0 | $0 | $0 | $0 | $0 | $0 | $0 | |
| Rent | $3,500 | $3,500 | $3,500 | $3,500 | $3,500 | $3,500 | $3,500 | $3,500 | $3,500 | $3,500 | $3,500 | $3,500 | |
| Utilities | $1,000 | $1,000 | $1,000 | $1,000 | $1,000 | $1,000 | $1,000 | $1,000 | $1,000 | $1,000 | $1,000 | $1,000 | |
| Insurance | $1,000 | $1,000 | $1,000 | $1,000 | $1,000 | $1,000 | $1,000 | $1,000 | $1,000 | $1,000 | $1,000 | $1,000 | |
| Payroll Taxes | 15% | $2,565 | $2,565 | $2,565 | $2,565 | $2,565 | $2,565 | $2,565 | $2,565 | $2,565 | $2,565 | $2,565 | $2,565 |
| Other | $500 | $500 | $2,000 | $2,000 | $2,000 | $2,000 | $2,000 | $2,000 | $2,000 | $3,000 | $3,000 | $3,000 | |
| Total Operating Expenses | $29,665 | $29,665 | $31,665 | $31,665 | $31,665 | $30,165 | $30,165 | $30,165 | $31,665 | $33,165 | $33,165 | $33,165 | |
| Profit Before Interest and Taxes | ($5,465) | ($2,065) | $1,595 | $1,595 | $1,595 | ($4,265) | ($4,265) | ($4,265) | $1,595 | $95 | $95 | $95 | |
| EBITDA | ($5,465) | ($2,065) | $1,595 | $1,595 | $1,595 | ($4,265) | ($4,265) | ($4,265) | $1,595 | $95 | $95 | $95 | |
| Interest Expense | $0 | $0 | $0 | $0 | $0 | $0 | $0 | $0 | $0 | $0 | $0 | $0 | |
| Taxes Incurred | $0 | $0 | $0 | $0 | $0 | $0 | $0 | $0 | $0 | $0 | $0 | $0 | |
| Net Profit | ($5,465) | ($2,065) | $1,595 | $1,595 | $1,595 | ($4,265) | ($4,265) | ($4,265) | $1,595 | $95 | $95 | $95 | |
| Net Profit/Sales | -19.52% | -6.66% | 4.31% | 4.31% | 4.31% | -14.71% | -14.71% | -14.71% | 4.31% | 0.26% | 0.26% | 0.26% | |
| Pro Forma Cash Flow | |||||||||||||
| Month 1 | Month 2 | Month 3 | Month 4 | Month 5 | Month 6 | Month 7 | Month 8 | Month 9 | Month 10 | Month 11 | Month 12 | ||
| Cash Received | |||||||||||||
| Cash from Operations | |||||||||||||
| Cash Sales | $28,000 | $31,000 | $37,000 | $37,000 | $37,000 | $29,000 | $29,000 | $29,000 | $37,000 | $37,000 | $37,000 | $37,000 | |
| Subtotal Cash from Operations | $28,000 | $31,000 | $37,000 | $37,000 | $37,000 | $29,000 | $29,000 | $29,000 | $37,000 | $37,000 | $37,000 | $37,000 | |
| Additional Cash Received | |||||||||||||
| Sales Tax, VAT, HST/GST Received | 0.00% | $0 | $0 | $0 | $0 | $0 | $0 | $0 | $0 | $0 | $0 | $0 | $0 |
| New Current Borrowing | $0 | $0 | $0 | $0 | $0 | $0 | $0 | $0 | $0 | $0 | $0 | $0 | |
| New Other Liabilities (interest-free) | $0 | $0 | $0 | $0 | $0 | $0 | $0 | $0 | $0 | $0 | $0 | $0 | |
| New Long-term Liabilities | $0 | $0 | $0 | $0 | $0 | $0 | $0 | $0 | $0 | $0 | $0 | $0 | |
| Sales of Other Current Assets | $0 | $0 | $0 | $0 | $0 | $0 | $0 | $0 | $0 | $0 | $0 | $0 | |
| Sales of Long-term Assets | $0 | $0 | $0 | $0 | $0 | $0 | $0 | $0 | $0 | $0 | $0 | $0 | |
| New Investment Received | $0 | $0 | $0 | $0 | $0 | $0 | $0 | $0 | $0 | $0 | $0 | $0 | |
| Subtotal Cash Received | $28,000 | $31,000 | $37,000 | $37,000 | $37,000 | $29,000 | $29,000 | $29,000 | $37,000 | $37,000 | $37,000 | $37,000 | |
| Expenditures | Month 1 | Month 2 | Month 3 | Month 4 | Month 5 | Month 6 | Month 7 | Month 8 | Month 9 | Month 10 | Month 11 | Month 12 | |
| Expenditures from Operations | |||||||||||||
| Cash Spending | $17,100 | $17,100 | $17,100 | $17,100 | $17,100 | $17,100 | $17,100 | $17,100 | $17,100 | $17,100 | $17,100 | $17,100 | |
| Bill Payments | $14,518 | $15,544 | $15,630 | $18,667 | $18,305 | $18,210 | $15,484 | $16,165 | $16,260 | $19,036 | $19,805 | $19,805 | |
| Subtotal Spent on Operations | $31,618 | $32,644 | $32,730 | $35,767 | $35,405 | $35,310 | $32,584 | $33,265 | $33,360 | $36,136 | $36,905 | $36,905 | |
| Additional Cash Spent | |||||||||||||
| Sales Tax, VAT, HST/GST Paid Out | $0 | $0 | $0 | $0 | $0 | $0 | $0 | $0 | $0 | $0 | $0 | $0 | |
| Principal Repayment of Current Borrowing | $0 | $0 | $0 | $0 | $0 | $0 | $0 | $0 | $0 | $0 | $0 | $0 | |
| Other Liabilities Principal Repayment | $0 | $0 | $0 | $0 | $0 | $0 | $0 | $0 | $0 | $0 | $0 | $0 | |
| Long-term Liabilities Principal Repayment | $0 | $0 | $0 | $0 | $0 | $0 | $0 | $0 | $0 | $0 | $0 | $0 | |
| Purchase Other Current Assets | $0 | $0 | $0 | $0 | $0 | $0 | $0 | $0 | $0 | $0 | $0 | $0 | |
| Purchase Long-term Assets | $0 | $0 | $0 | $0 | $0 | $0 | $0 | $0 | $0 | $0 | $0 | $0 | |
| Dividends | $0 | $0 | $0 | $0 | $0 | $0 | $0 | $0 | $0 | $0 | $0 | $0 | |
| Subtotal Cash Spent | $31,618 | $32,644 | $32,730 | $35,767 | $35,405 | $35,310 | $32,584 | $33,265 | $33,360 | $36,136 | $36,905 | $36,905 | |
| Net Cash Flow | ($3,618) | ($1,644) | $4,270 | $1,233 | $1,595 | ($6,310) | ($3,584) | ($4,265) | $3,640 | $864 | $95 | $95 | |
| Cash Balance | $90,382 | $88,738 | $93,007 | $94,241 | $95,836 | $89,526 | $85,941 | $81,676 | $85,316 | $86,181 | $86,276 | $86,371 | |
| Pro Forma Balance Sheet | |||||||||||||
| Month 1 | Month 2 | Month 3 | Month 4 | Month 5 | Month 6 | Month 7 | Month 8 | Month 9 | Month 10 | Month 11 | Month 12 | ||
| Assets | Starting Balances | ||||||||||||
| Current Assets | |||||||||||||
| Cash | $94,000 | $90,382 | $88,738 | $93,007 | $94,241 | $95,836 | $89,526 | $85,941 | $81,676 | $85,316 | $86,181 | $86,276 | $86,371 |
| Inventory | $5,000 | $4,180 | $3,740 | $4,114 | $4,114 | $4,114 | $3,410 | $3,410 | $3,410 | $4,114 | $4,114 | $4,114 | $4,114 |
| Other Current Assets | $2,000 | $2,000 | $2,000 | $2,000 | $2,000 | $2,000 | $2,000 | $2,000 | $2,000 | $2,000 | $2,000 | $2,000 | $2,000 |
| Total Current Assets | $101,000 | $96,562 | $94,478 | $99,121 | $100,355 | $101,950 | $94,936 | $91,351 | $87,086 | $91,430 | $92,295 | $92,390 | $92,485 |
| Long-term Assets | |||||||||||||
| Long-term Assets | $0 | $0 | $0 | $0 | $0 | $0 | $0 | $0 | $0 | $0 | $0 | $0 | $0 |
| Accumulated Depreciation | $0 | $0 | $0 | $0 | $0 | $0 | $0 | $0 | $0 | $0 | $0 | $0 | $0 |
| Total Long-term Assets | $0 | $0 | $0 | $0 | $0 | $0 | $0 | $0 | $0 | $0 | $0 | $0 | $0 |
| Total Assets | $101,000 | $96,562 | $94,478 | $99,121 | $100,355 | $101,950 | $94,936 | $91,351 | $87,086 | $91,430 | $92,295 | $92,390 | $92,485 |
| Liabilities and Capital | Month 1 | Month 2 | Month 3 | Month 4 | Month 5 | Month 6 | Month 7 | Month 8 | Month 9 | Month 10 | Month 11 | Month 12 | |
| Current Liabilities | |||||||||||||
| Accounts Payable | $14,000 | $15,027 | $15,008 | $18,056 | $17,695 | $17,695 | $14,946 | $15,626 | $15,626 | $18,375 | $19,145 | $19,145 | $19,145 |
| Current Borrowing | $0 | $0 | $0 | $0 | $0 | $0 | $0 | $0 | $0 | $0 | $0 | $0 | $0 |
| Other Current Liabilities | $0 | $0 | $0 | $0 | $0 | $0 | $0 | $0 | $0 | $0 | $0 | $0 | $0 |
| Subtotal Current Liabilities | $14,000 | $15,027 | $15,008 | $18,056 | $17,695 | $17,695 | $14,946 | $15,626 | $15,626 | $18,375 | $19,145 | $19,145 | $19,145 |
| Long-term Liabilities | $0 | $0 | $0 | $0 | $0 | $0 | $0 | $0 | $0 | $0 | $0 | $0 | $0 |
| Total Liabilities | $14,000 | $15,027 | $15,008 | $18,056 | $17,695 | $17,695 | $14,946 | $15,626 | $15,626 | $18,375 | $19,145 | $19,145 | $19,145 |
| Paid-in Capital | $120,000 | $120,000 | $120,000 | $120,000 | $120,000 | $120,000 | $120,000 | $120,000 | $120,000 | $120,000 | $120,000 | $120,000 | $120,000 |
| Retained Earnings | ($33,000) | ($33,000) | ($33,000) | ($33,000) | ($33,000) | ($33,000) | ($33,000) | ($33,000) | ($33,000) | ($33,000) | ($33,000) | ($33,000) | ($33,000) |
| Earnings | $0 | ($5,465) | ($7,530) | ($5,935) | ($4,340) | ($2,745) | ($7,010) | ($11,275) | ($15,540) | ($13,945) | ($13,850) | ($13,755) | ($13,660) |
| Total Capital | $87,000 | $81,535 | $79,470 | $81,065 | $82,660 | $84,255 | $79,990 | $75,725 | $71,460 | $73,055 | $73,150 | $73,245 | $73,340 |
| Total Liabilities and Capital | $101,000 | $96,562 | $94,478 | $99,121 | $100,355 | $101,950 | $94,936 | $91,351 | $87,086 | $91,430 | $92,295 | $92,390 | $92,485 |
| Net Worth | $87,000 | $81,535 | $79,470 | $81,065 | $82,660 | $84,255 | $79,990 | $75,725 | $71,460 | $73,055 | $73,150 | $73,245 | $73,340 |


