
Galerie de Beaute
Executive Summary
Galerie de Beaute is best described as a mall of beauty professionals. Galerie de Beaute will lease fully equipped units to state-licensed beauty professionals.
Owners of traditional salons face many challenges when starting a new business. Purchasing equipment and finding a location in a high traffic area with reasonable rent is often difficult. Although 40% of beauty professionals own their own business, 60% are employed in a privately-owned shop.
In a traditional salon environment employees are paid 50% commission. These employees are often charged for supplies and products utilized. These issues sometimes lead to high turnover in the industry. Because of these challenges, salon owners have resorted to booth rental in those states in which it is legal. Although booth rentals are attractive to many; there are some drawbacks. To be considered a booth renter and not an employee by the IRS and the state, a signed lease is required. If an audit is performed and there is no signed lease, this could involve significant liability, including back taxes, interest and penalty.
A long-term loan or an additional investment will be sought to supplement owner investment. This will help Galerie de Beaute make the required leasehold improvements to the selected site. Leasehold improvements include installation of equipment, electrical, plumbing and carpentry required to construct 24 suites.
First year profit is estimated at $17,000 growing to $37,500 in year three.

1.1 Mission
- Establish Ourstate’s first salon mall
- Provide high quality suites
- Maintain long-term financial stability
- Provide access to a spectrum of beauty and personal-care professionals
- Maintain the highest levels of professional ethics
- Foster a progressive environment, which attracts talented entrepreneurs
- Stay true to community commitment
1.2 Objectives
- Galerie de Beaute is an alternative for salon professionals who have the goal of salon ownership.
- Galerie de Beaute will provide hairstylists, nail technicians and massage therapists the opportunity to operate a mini-salon with minimal start-up capital expenditures.
1.3 Keys to Success
- Galerie de Beaute is located on the heavily travelled corridor of routes 13 and 40. Average daily traffic exceeds 20,000 vehicles.
- Galerie de Beaute is attractive to salon professionals because the professional pays a set monthly expense. The salon professional is no longer required to work as a commissioned employee.
- Galerie de Beaute gives salon professionals the opportunity to rent fully equipped units. Rent includes the locked unit, utilities, and insurance. Each salon professional will set his/her hours, set his/her pricing, schedule appointments and purchase supplies.
- Owners of traditional salons face many challenges when starting a new business. Purchasing equipment and finding a location in a high traffic area with reasonable rent is often difficult. Although 40% of beauty professionals own their own business, 60% are employed in a privately-owned shop.
- In a traditional salon environment employees are paid 50% commission. In addition these employees are often charged for supplies and products utilized. These issues lead to high turnover in the industry. Because of these challenges, salon owners have resorted to booth rental in those states in which it is legal.
- Although booth rentals are attractive to many; there are some drawbacks. To be considered a booth renter and not an employee by the IRS and the state, a signed lease is required. If an audit is performed and there is no signed lease, this could involve significant liability, including back taxes, interest and penalty.
- Salon malls have been established in several other states (i.e. Maryland, Virginia, Ohio and Nevada). Ourstate, and those immediately adjacent do not, as yet, have any salon malls.
Company Summary
Galerie de Beaute is best described as a mall of beauty salon professionals. Galerie de Beaute will lease fully equipped units to state licensed beauty professionals. The standard Galerie de Beaute lease will include private locking units with telephone jacks, shampoo bowl, styling station, hair dryer, and styling chair. The benefits of doing business at Galerie de Beaute is as follows: the maintenance service of the common area, utilities included in the lease payment, professional liability insurance, and on-site coin operated washer and dryer.
The relationship between Galerie de Beaute and potential applicants will be that of landlord and tenant. The tenant will be responsible for registering their ‘salon’ with the Division of Professional Regulation Board of Cosmetology and Barbering and acquiring business licensure.
2.1 Company Ownership
Galerie de Beaute has been established as a limited liability corporation by partners Marcela Wave and Curley Lockes. The ownership is based on the weight of the partners working capital input.
2.2 Start-up Summary
Equipment will be purchased to furnish each unit. The average cost of equipment to furnish a unit is approximately $1,800. It is estimated that we will have 24 units for rent; thus equipment cost is $44,000. Construction of 24 individual units and the common areas (including restrooms and laundry facilities) has been estimated at $140,000. Other expenses such as incorporation, legal and advertising come to $2,400. The first month’s rent and security totaled $8,000. Office and common areas equipment and furnishings come to $6,000 in expensed equipment and current assets. Total start-up requirements including cash on-hand are estimated at $240,000.

| Start-up | |
| Requirements | |
| Start-up Expenses | |
| Legal | $535 |
| Stationery etc. | $40 |
| Brochures | $300 |
| Consultants | $1,000 |
| Insurance | $125 |
| Rent | $8,000 |
| Leasehold Improvements/Unit Construction | $140,000 |
| Expensed Equipment | $4,000 |
| Other | $0 |
| Total Start-up Expenses | $154,000 |
| Start-up Assets | |
| Cash Required | $40,000 |
| Other Current Assets | $2,000 |
| Long-term Assets | $44,000 |
| Total Assets | $86,000 |
| Total Requirements | $240,000 |
| Start-up Funding | |
| Start-up Expenses to Fund | $154,000 |
| Start-up Assets to Fund | $86,000 |
| Total Funding Required | $240,000 |
| Assets | |
| Non-cash Assets from Start-up | $46,000 |
| Cash Requirements from Start-up | $40,000 |
| Additional Cash Raised | $0 |
| Cash Balance on Starting Date | $40,000 |
| Total Assets | $86,000 |
| Liabilities and Capital | |
| Liabilities | |
| Current Borrowing | $0 |
| Long-term Liabilities | $100,000 |
| Accounts Payable (Outstanding Bills) | $0 |
| Other Current Liabilities (interest-free) | $0 |
| Total Liabilities | $100,000 |
| Capital | |
| Planned Investment | |
| Owner | $100,000 |
| Owner | $40,000 |
| Other | $0 |
| Additional Investment Requirement | $0 |
| Total Planned Investment | $140,000 |
| Loss at Start-up (Start-up Expenses) | ($154,000) |
| Total Capital | ($14,000) |
| Total Capital and Liabilities | $86,000 |
| Total Funding | $240,000 |
Services
Galerie de Beaute will lease fully equipped units to state licensed beauty professionals. The standard beauty salon lease will include private locking units with telephone jacks, shampoo bowl, styling station, hair dryer and styling chair. The benefits of doing business at Galerie de Beaute are: the maintenance service of the common area, utilities included in unit lease, professional liability insurance, and on-site washer and dryer.
Market Analysis Summary
Ourstate has approximately 4,800 licensed cosmetologists, barbers, nail technicians, and aestheticians.
Per the Encyclopedia of American Industries, Third Edition, Volume Two: Service and Non-Manufacturing Industries, p110: “Hairdressing services have proven to be virtually recession proof, as consumers traditionally cut back on other discretionary expenses before decreasing their spending on personal grooming.”
Entities have concentrated on capturing market share through densely populated communities. Ourcounty, Ourstate fits that description. Approximately 64% of Ourstate’s population reside in Ourcounty, per the 2000 U.S. Census.
According to the 1998-1999 Occupational Outlook Handbook, approximately 586,000 hairdressers, hair stylists and cosmetologists were employed in the U.S. in 1996, with 43,000 jobs held by manicurists. The Occupational Outlook Handbook expects employment in the cosmetology industry to increase as fast as the national average for all professions through 2006. Manicurists are expected to experience the fastest growth, as are other such specialists as aestheticians and electrologists.
4.1 Market Segmentation
Galerie de Beaute is making suites available by the following segmentation. The suites are segmented by potential use. Because there are approximately 2,300 licensed cosmetologists in Ourcounty, 18 suites were devoted to hairstylists. With nail technicians growing at a faster rate, we will look to devote more salons to nail technicians in the future. Currently there are approximately 237 nail technicians in Ourcounty, 202 barbers and 123 aestheticians.


| Market Analysis | |||||||
| Year 1 | Year 2 | Year 3 | Year 4 | Year 5 | |||
| Potential Customers | Growth | CAGR | |||||
| Hair Stylist | 5% | 2,300 | 2,415 | 2,536 | 2,663 | 2,796 | 5.00% |
| Manicurist | 12% | 237 | 265 | 297 | 333 | 373 | 12.01% |
| Aestheticians | 10% | 123 | 135 | 149 | 164 | 180 | 9.99% |
| Massage Therapist | 5% | 390 | 410 | 431 | 453 | 476 | 5.11% |
| Barbers | 1% | 202 | 204 | 206 | 208 | 210 | 0.98% |
| Total | 5.54% | 3,252 | 3,429 | 3,619 | 3,821 | 4,035 | 5.54% |
4.2 Target Market Segment Strategy
Based on the growth rate of potential customers, Galerie de Beaute will need to investigate the opportunity to open a second location to service potential customers by year 2008.
4.3 Service Business Analysis
Although Ourcounty, Ourstate has many barber shops, beauty shops, spas and nail salons; the concept of a salon mall is new to Ourstate. There are no hair stylist or nail salons on the half mile heavily travelled route 13/40 from route 141 to the 13/40 split. The closest establishment is located on route 141 in the Sell-O-Mart on route 273.
Ourstate code does not address booth rental, but the advantage of Galerie de Beaute is the privacy of secure, individual leased unit mini-salon versus ‘booth’ rental. Nearbystate does not permit booth rental as an alternative to salon ownership, a point for Galerie de Beaute to consider in future expansion.
4.3.1 Competition and Buying Patterns
The driving factor in choosing one type of arrangement over the other will undoubtedly be cost. Owners of traditional salons face many challenges when starting a new business. Purchasing equipment and finding a location in a high traffic area with reasonable rent is often difficult. Although 40% of beauty professionals own their own business, 60% are employed in a privately owned shop.
In a traditional salon environment employees are paid 50% commission. These employees are often charged for supplies and products utilized. These issues sometimes lead to high turnover in the industry. Because of these challenges, salon owners have resorted to booth rental in those states in which it is legal.
The Solution is Galerie de Beaute
| Galerie de Beaute | Traditional Salon | ||
| Weekly Sales | $800 | Weekly Sales | $800 |
| Weekly Rent | $225 | Weekly Commission |
$400 |
| Telephone | $10 | Telephone |
$0 |
| Supplies | $40 | Supply Charge-back | $80 |
| Income Before Taxes | $525 | Income Before Taxes | $320 |
If a salon professional can increase earnings by making 55% commission rather than 50% commission the income difference will be the determining factor when choosing employment at one salon over another. We can offer an alternative to the commission environment. The qualities of salon ownership with less paperwork will be appealing. In the scenario presented above the potential income is 64% before taxes.
Strategy and Implementation Summary
The funding strategy as it relates to Galerie de Beaute is as follows:
- Management will contribute personal funding towards working capital. The funding from each partner are from various sources (i.e. home equity line of credit, credit for equipment, etc).
- Management will also present the business plan to the small business loan officer at our local bank.
- Management will identify nonprofit organizations which assist start ups (i.e. SCORE, Hometown Economic Development Corporation and First State Community Loan Fund).
Once contact is made with the various funding sources Management will determine which opportunities would best fit our needs. The main point of concern is the long-term interest rate. Management has determined that interest rates 7% or less would best fit our financial plan.
Once funding issues have been resolved Management will turn its attention to leasing the suites. Identifying potential tenants to sign a one year lease is management’s priority. The goal is to have approximately 10 tenants committed by the grand opening; thus placing Galerie de Beaute in the position to break even within the 2nd quarter of operation.
5.1 Competitive Edge
Galerie de Beaute’s competitive edge is that we are the first enterprise of this kind in Ourstate. All other salons are owned and operated by a few individuals that either are sole proprietors or pay employees 50% to 60% commission. Some owners prefer not to have employees, but rent out remaining booths.
To be considered a booth renter and not an employee by the IRS and the state, a signed lease is required. If an audit is performed and there is no signed lease, this could involve significant liability, including back taxes, interest and penalty.
5.2 Marketing Strategy
The initial marketing strategy requires creating a database of licensed beauty professionals in the state. The list of individuals is of public record and listed on Ourstate’s website. Once we have gathered addresses and phone numbers, we will send out direct mail advertisements. We will continue to update our database as information is made available. The second strategy, which will be ongoing, is to acquire tenants by placing advertisements in The News Journal, Community News, and on Galerie de Beaute’s Web page. In the Business Opportunities section of the classifieds, Galerie de Beaute will advertise for licensed beauty professionals (i.e. cosmetologists, nail technicians and massage therapists).
5.3 Sales Strategy
The sales strategy of Galerie de Beaute for year 1 is upon opening to have signed leases for 10 units. Each subsequent quarter increase signed leases by five.
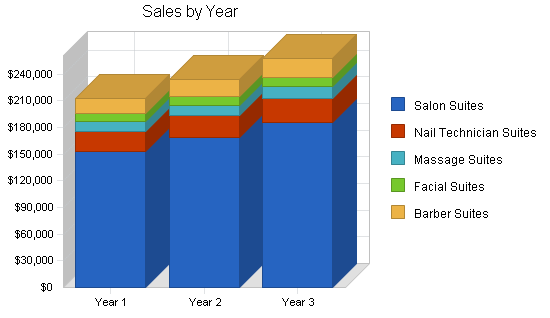
5.3.1 Sales Forecast
The sales forecast for Galerie de Beaute is based on a steady increase in sales in the first year. Sales increase by approximately 8% on the Salon Suites. Because we have more units we expect to sign approximately 1 lease per month after the start up of ten. We anticipate lease renewals for subsequent years thus resulting in 100% occupancy. The direct cost related to each unit is $62.50 per month as it relates to the monthly loan repayment.

| Sales Forecast | |||
| Year 1 | Year 2 | Year 3 | |
| Sales | |||
| Salon Suites | $153,505 | $168,855 | $185,740 |
| Nail Technician Suites | $22,425 | $24,668 | $27,134 |
| Massage Suites | $10,725 | $11,798 | $12,977 |
| Facial Suites | $8,775 | $9,653 | $10,618 |
| Barber Suites | $17,550 | $19,305 | $21,236 |
| Total Sales | $212,980 | $234,277 | $257,705 |
| Direct Cost of Sales | Year 1 | Year 2 | Year 3 |
| Salon Suites | $11,250 | $12,375 | $13,613 |
| Massage Suites | $688 | $756 | $832 |
| Facial Suites | $508 | $558 | $614 |
| Barber Suites | $1,196 | $1,315 | $1,447 |
| Nail Technician Suites | $1,421 | $1,563 | $1,719 |
| Subtotal Direct Cost of Sales | $15,061 | $16,567 | $18,224 |
5.4 Milestones
The lease for 166 S. Fastlane Highway was signed in April 2004, with a start date of June 1, 2004. The month of May has been devoted to investigating additional financing resources, and working with the architect and general contractor to come to an agreement on the best floor plan for this type of environment. This includes taking into consideration the heating and air conditioning of the units, plans that will win approval from the county and plans that will be comfortable for future tenants. June and July will be dedicated to construction, ordering equipment and marketing. We selected the contractor because of his history of getting jobs completed on time. It is crucial that the jobs move quickly. Marketing will be more effective if we can have sample units to show. We will be taking the same approach if we were showing a sample home.
After 3 years of successful operation Galerie de Beaute will research additional sites in Ourstate or Neighboringstate.

| Milestones | |||||
| Milestone | Start Date | End Date | Budget | Manager | Department |
| Negotiate lease for selected site | 3/31/2004 | 4/5/2004 | $8,000 | Curley | Operations |
| Select Architect and complete floor plans | 5/15/2004 | 6/4/2004 | $5,000 | Curley/Marcela | Operations |
| Select Contractors | 6/4/2004 | 7/31/2004 | $135,000 | Marcela | Operations |
| Identify and Order Equipment | 7/15/2004 | 7/21/2004 | $44,000 | Marcela | Operations |
| Direct Mail Advertisment | 6/5/2004 | 7/31/2004 | $150 | Curley | Marketing |
| Grand Opening | 8/1/2004 | 8/1/2004 | $0 | Marcela/Curley | Operations |
| Advertise in the Community News | 8/1/2004 | 9/30/2004 | $600 | Curley | Marketing |
| Direct Mail Advertisment | 10/1/2004 | 10/31/2004 | $150 | Curley | Marketing |
| Totals | $192,900 | ||||
Management Summary
Galerie de Beaute will not require a full staff.
Maintenance: Maintenance of common areas and snow removal will be a contracted expense. The contract will explain in detail the services required (i.e. mopping, cleaning bathrooms and trash removal).
Administrative duties will be shared by the partners. The partners will meet regularly to assign new duties or reassign duties as needed. It has been stated in partnership agreement that accounting duties will be rotated quarterly between the partners.
New Business: Application process, lease agreement, first and security deposit. Marcela Wave/Curley Lockes
Accounts Payable/Receivable: Collection and posting of rent. Disbursement of loan, rent, maintenance and advertising payments. Marcela Wave/Curley Lockes
Site Manager: Meet tenants monthly to address customer service issues. Renegotiate agreements. Walk through site before closing to ensure site is secure. Marcela Wave/Curley Lockes
6.1 Personnel Plan
Because tenants will be responsible for their individual suites, management will make periodic visits throughout the day to ensure maintenance issues and tenants’ concerns are being addressed. The front door will be on a timer, locking at 6:00 p.m. Management will walk through around closing to ensure the building is secure.
Maintenance will be contracted. The contract will require cleaning restrooms and maintaining common areas. Tenants are responsible for maintenance within the suites. We will require approximately 16 hours per week @ approximately $7.00/hour.
The partners have over 20 years combined experience in accounting. Bookkeeping will be handled by partners with periodic review by an Accountant.
| Personnel Plan | |||
| Year 1 | Year 2 | Year 3 | |
| Curley Lockes/Manager | $24,000 | $36,000 | $40,000 |
| Marcela Wave/Manager | $24,000 | $36,000 | $40,000 |
| Other | $0 | $0 | $0 |
| Total People | 2 | 2 | 2 |
| Total Payroll | $48,000 | $72,000 | $80,000 |
Financial Plan
The cash flow projections show a steady growth. The pace and rate is consistent. At this rate this gives the Management the time needed to research other locations, establish a strong position when researching financing related to purchase the next location.
7.1 Important Assumptions
The General Assumptions assumes current interest rates are 5%, long term interest rates are 7% and the tax rate is 30%.
| General Assumptions | |||
| Year 1 | Year 2 | Year 3 | |
| Plan Month | 1 | 2 | 3 |
| Current Interest Rate | 5.00% | 5.00% | 5.00% |
| Long-term Interest Rate | 7.00% | 7.00% | 7.00% |
| Tax Rate | 30.00% | 30.00% | 30.00% |
| Other | 0 | 0 | 0 |
7.2 Projected Profit and Loss
Projected profit and loss assumes long-term interest expense at 7%, it also includes owners’ salaries and taxes. Net profit is calculated after tax. Expenses include triple net lease fees of $2/sq ft, which is approximately $9,600 per year. After several months of operation net profit growth from month to month ranges from approximately 10%-20%. After year 1 net profits continue growth in the range of 10%-15%.


| Pro Forma Profit and Loss | |||
| Year 1 | Year 2 | Year 3 | |
| Sales | $212,980 | $234,277 | $257,705 |
| Direct Cost of Sales | $15,061 | $16,567 | $18,224 |
| Other Costs of Sales | $0 | $0 | $0 |
| Total Cost of Sales | $15,061 | $16,567 | $18,224 |
| Gross Margin | $197,918 | $217,710 | $239,481 |
| Gross Margin % | 92.93% | 92.93% | 92.93% |
| Expenses | |||
| Payroll | $48,000 | $72,000 | $80,000 |
| Sales and Marketing and Other Expenses | $3,600 | $3,600 | $3,600 |
| Depreciation | $9,600 | $9,600 | $9,600 |
| Rent | $47,916 | $52,701 | $55,096 |
| Utilities | $29,450 | $0 | $0 |
| Insurance | $1,500 | $1,500 | $1,500 |
| Maintenance Contract | $6,000 | $6,000 | $6,000 |
| Triple Net Lease Fees | $9,600 | $9,600 | $9,600 |
| Payroll Taxes | $8,100 | $11,700 | $12,900 |
| Other | $2,700 | $2,700 | $2,700 |
| Total Operating Expenses | $166,466 | $169,401 | $180,996 |
| Profit Before Interest and Taxes | $31,452 | $48,309 | $58,485 |
| EBITDA | $41,052 | $57,909 | $68,085 |
| Interest Expense | $6,545 | $5,740 | $4,900 |
| Taxes Incurred | $7,472 | $12,771 | $16,076 |
| Net Profit | $17,435 | $29,798 | $37,510 |
| Net Profit/Sales | 8.19% | 12.72% | 14.56% |
7.3 Break-even Analysis
The break-even analysis of Galerie de Beaute is an illustration of the number of units which are required to be leased at an average rent of $975/month. With 12 units leased, this will cover the fixed costs (i.e. rent, insurance, security, maintenance), variable cost related to triple net leasing of $2/sq ft, water and electricity and the owners’ salaries of $4,000/month.

| Break-even Analysis | |
| Monthly Revenue Break-even | $14,928 |
| Assumptions: | |
| Average Percent Variable Cost | 7% |
| Estimated Monthly Fixed Cost | $13,872 |
7.4 Projected Cash Flow
Cash flow begins with an adequate cash balance; is negative for four months, then becomes positive. One-hundred fifty five thousand dollars has been invested by the partners. The owners will receive year-end dividend payouts beginning in the second fiscal year. The long-term debt of $100,000 will be repaid over the course of eight years at an interest rate of 7%. The net cash flow is listed before interest and taxes.

| Pro Forma Cash Flow | |||
| Year 1 | Year 2 | Year 3 | |
| Cash Received | |||
| Cash from Operations | |||
| Cash Sales | $212,980 | $234,277 | $257,705 |
| Subtotal Cash from Operations | $212,980 | $234,277 | $257,705 |
| Additional Cash Received | |||
| Sales Tax, VAT, HST/GST Received | $0 | $0 | $0 |
| New Current Borrowing | $0 | $0 | $0 |
| New Other Liabilities (interest-free) | $0 | $0 | $0 |
| New Long-term Liabilities | $0 | $0 | $0 |
| Sales of Other Current Assets | $0 | $0 | $0 |
| Sales of Long-term Assets | $0 | $0 | $0 |
| New Investment Received | $0 | $0 | $0 |
| Subtotal Cash Received | $212,980 | $234,277 | $257,705 |
| Expenditures | Year 1 | Year 2 | Year 3 |
| Expenditures from Operations | |||
| Cash Spending | $48,000 | $72,000 | $80,000 |
| Bill Payments | $124,577 | $126,147 | $129,961 |
| Subtotal Spent on Operations | $172,577 | $198,147 | $209,961 |
| Additional Cash Spent | |||
| Sales Tax, VAT, HST/GST Paid Out | $0 | $0 | $0 |
| Principal Repayment of Current Borrowing | $0 | $0 | $0 |
| Other Liabilities Principal Repayment | $0 | $0 | $0 |
| Long-term Liabilities Principal Repayment | $12,000 | $12,000 | $12,000 |
| Purchase Other Current Assets | $0 | $0 | $0 |
| Purchase Long-term Assets | $0 | $0 | $0 |
| Dividends | $0 | $8,000 | $12,000 |
| Subtotal Cash Spent | $184,577 | $218,147 | $233,961 |
| Net Cash Flow | $28,403 | $16,131 | $23,744 |
| Cash Balance | $68,403 | $84,533 | $108,277 |
7.5 Projected Balance Sheet
The nature of Galerie de Beaute’s business is to carry no inventory; salon unit leases are paid current; thus there are no accounts receivables; and limited long-term assets in equipment on the books are depreciated over five years. In the future we may purchase a building for a 2nd location if demand requires.
| Pro Forma Balance Sheet | |||
| Year 1 | Year 2 | Year 3 | |
| Assets | |||
| Current Assets | |||
| Cash | $68,403 | $84,533 | $108,277 |
| Other Current Assets | $2,000 | $2,000 | $2,000 |
| Total Current Assets | $70,403 | $86,533 | $110,277 |
| Long-term Assets | |||
| Long-term Assets | $44,000 | $44,000 | $44,000 |
| Accumulated Depreciation | $9,600 | $19,200 | $28,800 |
| Total Long-term Assets | $34,400 | $24,800 | $15,200 |
| Total Assets | $104,803 | $111,333 | $125,477 |
| Liabilities and Capital | Year 1 | Year 2 | Year 3 |
| Current Liabilities | |||
| Accounts Payable | $13,367 | $10,100 | $10,734 |
| Current Borrowing | $0 | $0 | $0 |
| Other Current Liabilities | $0 | $0 | $0 |
| Subtotal Current Liabilities | $13,367 | $10,100 | $10,734 |
| Long-term Liabilities | $88,000 | $76,000 | $64,000 |
| Total Liabilities | $101,367 | $86,100 | $74,734 |
| Paid-in Capital | $140,000 | $140,000 | $140,000 |
| Retained Earnings | ($154,000) | ($144,565) | ($126,766) |
| Earnings | $17,435 | $29,798 | $37,510 |
| Total Capital | $3,435 | $25,234 | $50,743 |
| Total Liabilities and Capital | $104,803 | $111,333 | $125,477 |
| Net Worth | $3,435 | $25,234 | $50,743 |
7.6 Business Ratios
The ratios are not relevant to Galerie de Beaute for several reasons. Galerie de Beaute does not possess inventory to be evaluated in that fashion. Galerie de Beaute possesses limited equipment long-term assets, but does not carry accounts receivables. Because salon malls are fairly new there are no industry indicators for comparisons; therefore the ratio table is not a good indicator. The Industry Profiles shown correspond to SIC code 6512.0200, Operators of Nonresidential Buildings, chosen because our company is sub-leasing business real estate space to independent business entrepreneurs.
| Ratio Analysis | ||||
| Year 1 | Year 2 | Year 3 | Industry Profile | |
| Sales Growth | 0.00% | 10.00% | 10.00% | 3.46% |
| Percent of Total Assets | ||||
| Other Current Assets | 1.91% | 1.80% | 1.59% | 19.37% |
| Total Current Assets | 67.18% | 77.72% | 87.89% | 22.19% |
| Long-term Assets | 32.82% | 22.28% | 12.11% | 77.81% |
| Total Assets | 100.00% | 100.00% | 100.00% | 100.00% |
| Current Liabilities | 12.75% | 9.07% | 8.55% | 6.80% |
| Long-term Liabilities | 83.97% | 68.26% | 51.01% | 51.69% |
| Total Liabilities | 96.72% | 77.34% | 59.56% | 58.49% |
| Net Worth | 3.28% | 22.66% | 40.44% | 41.51% |
| Percent of Sales | ||||
| Sales | 100.00% | 100.00% | 100.00% | 100.00% |
| Gross Margin | 92.93% | 92.93% | 92.93% | 100.00% |
| Selling, General & Administrative Expenses | 80.50% | 76.48% | 75.05% | 63.74% |
| Advertising Expenses | 0.00% | 0.00% | 0.00% | 0.37% |
| Profit Before Interest and Taxes | 14.77% | 20.62% | 22.69% | 3.52% |
| Main Ratios | ||||
| Current | 5.27 | 8.57 | 10.27 | 1.84 |
| Quick | 5.27 | 8.57 | 10.27 | 1.44 |
| Total Debt to Total Assets | 96.72% | 77.34% | 59.56% | 68.83% |
| Pre-tax Return on Net Worth | 725.08% | 168.70% | 105.60% | 1.15% |
| Pre-tax Return on Assets | 23.77% | 38.24% | 42.71% | 3.68% |
| Additional Ratios | Year 1 | Year 2 | Year 3 | |
| Net Profit Margin | 8.19% | 12.72% | 14.56% | n.a |
| Return on Equity | 507.55% | 118.09% | 73.92% | n.a |
| Activity Ratios | ||||
| Accounts Payable Turnover | 10.32 | 12.17 | 12.17 | n.a |
| Payment Days | 27 | 35 | 29 | n.a |
| Total Asset Turnover | 2.03 | 2.10 | 2.05 | n.a |
| Debt Ratios | ||||
| Debt to Net Worth | 29.51 | 3.41 | 1.47 | n.a |
| Current Liab. to Liab. | 0.13 | 0.12 | 0.14 | n.a |
| Liquidity Ratios | ||||
| Net Working Capital | $57,035 | $76,434 | $99,543 | n.a |
| Interest Coverage | 4.81 | 8.42 | 11.94 | n.a |
| Additional Ratios | ||||
| Assets to Sales | 0.49 | 0.48 | 0.49 | n.a |
| Current Debt/Total Assets | 13% | 9% | 9% | n.a |
| Acid Test | 5.27 | 8.57 | 10.27 | n.a |
| Sales/Net Worth | 62.00 | 9.28 | 5.08 | n.a |
| Dividend Payout | 0.00 | 0.27 | 0.32 | n.a |
Appendix
| Sales Forecast | |||||||||||||
| Month 1 | Month 2 | Month 3 | Month 4 | Month 5 | Month 6 | Month 7 | Month 8 | Month 9 | Month 10 | Month 11 | Month 12 | ||
| Sales | |||||||||||||
| Salon Suites | 0% | $5,850 | $6,786 | $7,872 | $9,131 | $10,592 | $12,287 | $14,253 | $16,533 | $17,550 | $17,550 | $17,550 | $17,550 |
| Nail Technician Suites | 0% | $975 | $1,950 | $1,950 | $1,950 | $1,950 | $1,950 | $1,950 | $1,950 | $1,950 | $1,950 | $1,950 | $1,950 |
| Massage Suites | 0% | $0 | $975 | $975 | $975 | $975 | $975 | $975 | $975 | $975 | $975 | $975 | $975 |
| Facial Suites | 0% | $0 | $0 | $0 | $975 | $975 | $975 | $975 | $975 | $975 | $975 | $975 | $975 |
| Barber Suites | 0% | $0 | $975 | $975 | $0 | $1,950 | $1,950 | $1,950 | $1,950 | $1,950 | $1,950 | $1,950 | $1,950 |
| Total Sales | $6,825 | $10,686 | $11,772 | $13,031 | $16,442 | $18,137 | $20,103 | $22,383 | $23,400 | $23,400 | $23,400 | $23,400 | |
| Direct Cost of Sales | Month 1 | Month 2 | Month 3 | Month 4 | Month 5 | Month 6 | Month 7 | Month 8 | Month 9 | Month 10 | Month 11 | Month 12 | |
| Salon Suites | $625 | $688 | $750 | $813 | $875 | $938 | $1,000 | $1,063 | $1,125 | $1,125 | $1,125 | $1,125 | |
| Massage Suites | $0 | $63 | $63 | $63 | $63 | $63 | $63 | $63 | $63 | $63 | $63 | $63 | |
| Facial Suites | $0 | $0 | $0 | $63 | $35 | $35 | $63 | $63 | $63 | $63 | $63 | $63 | |
| Barber Suites | $0 | $63 | $63 | $63 | $126 | $126 | $126 | $126 | $126 | $126 | $126 | $126 | |
| Nail Technician Suites | $35 | $126 | $126 | $126 | $126 | $126 | $126 | $126 | $126 | $126 | $126 | $126 | |
| Subtotal Direct Cost of Sales | $660 | $939 | $1,001 | $1,126 | $1,225 | $1,287 | $1,377 | $1,440 | $1,502 | $1,502 | $1,502 | $1,502 | |
| Personnel Plan | |||||||||||||
| Month 1 | Month 2 | Month 3 | Month 4 | Month 5 | Month 6 | Month 7 | Month 8 | Month 9 | Month 10 | Month 11 | Month 12 | ||
| Curley Lockes/Manager | 0% | $2,000 | $2,000 | $2,000 | $2,000 | $2,000 | $2,000 | $2,000 | $2,000 | $2,000 | $2,000 | $2,000 | $2,000 |
| Marcela Wave/Manager | 0% | $2,000 | $2,000 | $2,000 | $2,000 | $2,000 | $2,000 | $2,000 | $2,000 | $2,000 | $2,000 | $2,000 | $2,000 |
| Other | 0% | $0 | $0 | $0 | $0 | $0 | $0 | $0 | $0 | $0 | $0 | $0 | $0 |
| Total People | 2 | 2 | 2 | 2 | 2 | 2 | 2 | 2 | 2 | 2 | 2 | 2 | |
| Total Payroll | $4,000 | $4,000 | $4,000 | $4,000 | $4,000 | $4,000 | $4,000 | $4,000 | $4,000 | $4,000 | $4,000 | $4,000 | |
| General Assumptions | |||||||||||||
| Month 1 | Month 2 | Month 3 | Month 4 | Month 5 | Month 6 | Month 7 | Month 8 | Month 9 | Month 10 | Month 11 | Month 12 | ||
| Plan Month | 1 | 2 | 3 | 4 | 5 | 6 | 7 | 8 | 9 | 10 | 11 | 12 | |
| Current Interest Rate | 5.00% | 5.00% | 5.00% | 5.00% | 5.00% | 5.00% | 5.00% | 5.00% | 5.00% | 5.00% | 5.00% | 5.00% | |
| Long-term Interest Rate | 7.00% | 7.00% | 7.00% | 7.00% | 7.00% | 7.00% | 7.00% | 7.00% | 7.00% | 7.00% | 7.00% | 7.00% | |
| Tax Rate | 30.00% | 30.00% | 30.00% | 30.00% | 30.00% | 30.00% | 30.00% | 30.00% | 30.00% | 30.00% | 30.00% | 30.00% | |
| Other | 0 | 0 | 0 | 0 | 0 | 0 | 0 | 0 | 0 | 0 | 0 | 0 | |
| Pro Forma Profit and Loss | |||||||||||||
| Month 1 | Month 2 | Month 3 | Month 4 | Month 5 | Month 6 | Month 7 | Month 8 | Month 9 | Month 10 | Month 11 | Month 12 | ||
| Sales | $6,825 | $10,686 | $11,772 | $13,031 | $16,442 | $18,137 | $20,103 | $22,383 | $23,400 | $23,400 | $23,400 | $23,400 | |
| Direct Cost of Sales | $660 | $939 | $1,001 | $1,126 | $1,225 | $1,287 | $1,377 | $1,440 | $1,502 | $1,502 | $1,502 | $1,502 | |
| Other Costs of Sales | $0 | $0 | $0 | $0 | $0 | $0 | $0 | $0 | $0 | $0 | $0 | $0 | |
| Total Cost of Sales | $660 | $939 | $1,001 | $1,126 | $1,225 | $1,287 | $1,377 | $1,440 | $1,502 | $1,502 | $1,502 | $1,502 | |
| Gross Margin | $6,165 | $9,748 | $10,771 | $11,905 | $15,218 | $16,850 | $18,726 | $20,944 | $21,898 | $21,898 | $21,898 | $21,898 | |
| Gross Margin % | 90.33% | 91.22% | 91.50% | 91.36% | 92.55% | 92.90% | 93.15% | 93.57% | 93.58% | 93.58% | 93.58% | 93.58% | |
| Expenses | |||||||||||||
| Payroll | $4,000 | $4,000 | $4,000 | $4,000 | $4,000 | $4,000 | $4,000 | $4,000 | $4,000 | $4,000 | $4,000 | $4,000 | |
| Sales and Marketing and Other Expenses | $300 | $300 | $300 | $300 | $300 | $300 | $300 | $300 | $300 | $300 | $300 | $300 | |
| Depreciation | $800 | $800 | $800 | $800 | $800 | $800 | $800 | $800 | $800 | $800 | $800 | $800 | |
| Rent | $3,993 | $3,993 | $3,993 | $3,993 | $3,993 | $3,993 | $3,993 | $3,993 | $3,993 | $3,993 | $3,993 | $3,993 | |
| Utilities | $1,400 | $1,400 | $1,400 | $1,800 | $2,100 | $2,800 | $2,800 | $3,150 | $3,150 | $3,150 | $3,150 | $3,150 | |
| Insurance | $125 | $125 | $125 | $125 | $125 | $125 | $125 | $125 | $125 | $125 | $125 | $125 | |
| Maintenance Contract | 0% | $500 | $500 | $500 | $500 | $500 | $500 | $500 | $500 | $500 | $500 | $500 | $500 |
| Triple Net Lease Fees | $2/sqft | $800 | $800 | $800 | $800 | $800 | $800 | $800 | $800 | $800 | $800 | $800 | $800 |
| Payroll Taxes | 15% | $675 | $675 | $675 | $675 | $675 | $675 | $675 | $675 | $675 | $675 | $675 | $675 |
| Other | $225 | $225 | $225 | $225 | $225 | $225 | $225 | $225 | $225 | $225 | $225 | $225 | |
| Total Operating Expenses | $12,818 | $12,818 | $12,818 | $13,218 | $13,518 | $14,218 | $14,218 | $14,568 | $14,568 | $14,568 | $14,568 | $14,568 | |
| Profit Before Interest and Taxes | ($6,653) | ($3,071) | ($2,047) | ($1,313) | $1,700 | $2,632 | $4,508 | $6,376 | $7,330 | $7,330 | $7,330 | $7,330 | |
| EBITDA | ($5,853) | ($2,271) | ($1,247) | ($513) | $2,500 | $3,432 | $5,308 | $7,176 | $8,130 | $8,130 | $8,130 | $8,130 | |
| Interest Expense | $578 | $572 | $566 | $560 | $554 | $548 | $543 | $537 | $531 | $525 | $519 | $513 | |
| Taxes Incurred | ($2,169) | ($1,093) | ($784) | ($562) | $344 | $625 | $1,190 | $1,752 | $2,040 | $2,042 | $2,043 | $2,045 | |
| Net Profit | ($5,061) | ($2,550) | ($1,829) | ($1,311) | $802 | $1,459 | $2,776 | $4,087 | $4,759 | $4,764 | $4,768 | $4,772 | |
| Net Profit/Sales | -74.16% | -23.86% | -15.54% | -10.06% | 4.88% | 8.04% | 13.81% | 18.26% | 20.34% | 20.36% | 20.37% | 20.39% | |
| Pro Forma Cash Flow | |||||||||||||
| Month 1 | Month 2 | Month 3 | Month 4 | Month 5 | Month 6 | Month 7 | Month 8 | Month 9 | Month 10 | Month 11 | Month 12 | ||
| Cash Received | |||||||||||||
| Cash from Operations | |||||||||||||
| Cash Sales | $6,825 | $10,686 | $11,772 | $13,031 | $16,442 | $18,137 | $20,103 | $22,383 | $23,400 | $23,400 | $23,400 | $23,400 | |
| Subtotal Cash from Operations | $6,825 | $10,686 | $11,772 | $13,031 | $16,442 | $18,137 | $20,103 | $22,383 | $23,400 | $23,400 | $23,400 | $23,400 | |
| Additional Cash Received | |||||||||||||
| Sales Tax, VAT, HST/GST Received | 0.00% | $0 | $0 | $0 | $0 | $0 | $0 | $0 | $0 | $0 | $0 | $0 | $0 |
| New Current Borrowing | $0 | $0 | $0 | $0 | $0 | $0 | $0 | $0 | $0 | $0 | $0 | $0 | |
| New Other Liabilities (interest-free) | $0 | $0 | $0 | $0 | $0 | $0 | $0 | $0 | $0 | $0 | $0 | $0 | |
| New Long-term Liabilities | $0 | $0 | $0 | $0 | $0 | $0 | $0 | $0 | $0 | $0 | $0 | $0 | |
| Sales of Other Current Assets | $0 | $0 | $0 | $0 | $0 | $0 | $0 | $0 | $0 | $0 | $0 | $0 | |
| Sales of Long-term Assets | $0 | $0 | $0 | $0 | $0 | $0 | $0 | $0 | $0 | $0 | $0 | $0 | |
| New Investment Received | $0 | $0 | $0 | $0 | $0 | $0 | $0 | $0 | $0 | $0 | $0 | $0 | |
| Subtotal Cash Received | $6,825 | $10,686 | $11,772 | $13,031 | $16,442 | $18,137 | $20,103 | $22,383 | $23,400 | $23,400 | $23,400 | $23,400 | |
| Expenditures | Month 1 | Month 2 | Month 3 | Month 4 | Month 5 | Month 6 | Month 7 | Month 8 | Month 9 | Month 10 | Month 11 | Month 12 | |
| Expenditures from Operations | |||||||||||||
| Cash Spending | $4,000 | $4,000 | $4,000 | $4,000 | $4,000 | $4,000 | $4,000 | $4,000 | $4,000 | $4,000 | $4,000 | $4,000 | |
| Bill Payments | $236 | $7,131 | $8,448 | $8,826 | $9,585 | $10,875 | $11,900 | $12,559 | $13,507 | $13,840 | $13,836 | $13,832 | |
| Subtotal Spent on Operations | $4,236 | $11,131 | $12,448 | $12,826 | $13,585 | $14,875 | $15,900 | $16,559 | $17,507 | $17,840 | $17,836 | $17,832 | |
| Additional Cash Spent | |||||||||||||
| Sales Tax, VAT, HST/GST Paid Out | $0 | $0 | $0 | $0 | $0 | $0 | $0 | $0 | $0 | $0 | $0 | $0 | |
| Principal Repayment of Current Borrowing | $0 | $0 | $0 | $0 | $0 | $0 | $0 | $0 | $0 | $0 | $0 | $0 | |
| Other Liabilities Principal Repayment | $0 | $0 | $0 | $0 | $0 | $0 | $0 | $0 | $0 | $0 | $0 | $0 | |
| Long-term Liabilities Principal Repayment | $1,000 | $1,000 | $1,000 | $1,000 | $1,000 | $1,000 | $1,000 | $1,000 | $1,000 | $1,000 | $1,000 | $1,000 | |
| Purchase Other Current Assets | $0 | $0 | $0 | $0 | $0 | $0 | $0 | $0 | $0 | $0 | $0 | $0 | |
| Purchase Long-term Assets | $0 | $0 | $0 | $0 | $0 | $0 | $0 | $0 | $0 | $0 | $0 | $0 | |
| Dividends | $0 | $0 | $0 | $0 | $0 | $0 | $0 | $0 | $0 | $0 | $0 | $0 | |
| Subtotal Cash Spent | $5,236 | $12,131 | $13,448 | $13,826 | $14,585 | $15,875 | $16,900 | $17,559 | $18,507 | $18,840 | $18,836 | $18,832 | |
| Net Cash Flow | $1,589 | ($1,445) | ($1,676) | ($794) | $1,857 | $2,262 | $3,203 | $4,824 | $4,893 | $4,560 | $4,564 | $4,568 | |
| Cash Balance | $41,589 | $40,144 | $38,468 | $37,673 | $39,530 | $41,792 | $44,995 | $49,819 | $54,712 | $59,271 | $63,835 | $68,403 | |
| Pro Forma Balance Sheet | |||||||||||||
| Month 1 | Month 2 | Month 3 | Month 4 | Month 5 | Month 6 | Month 7 | Month 8 | Month 9 | Month 10 | Month 11 | Month 12 | ||
| Assets | Starting Balances | ||||||||||||
| Current Assets | |||||||||||||
| Cash | $40,000 | $41,589 | $40,144 | $38,468 | $37,673 | $39,530 | $41,792 | $44,995 | $49,819 | $54,712 | $59,271 | $63,835 | $68,403 |
| Other Current Assets | $2,000 | $2,000 | $2,000 | $2,000 | $2,000 | $2,000 | $2,000 | $2,000 | $2,000 | $2,000 | $2,000 | $2,000 | $2,000 |
| Total Current Assets | $42,000 | $43,589 | $42,144 | $40,468 | $39,673 | $41,530 | $43,792 | $46,995 | $51,819 | $56,712 | $61,271 | $65,835 | $70,403 |
| Long-term Assets | |||||||||||||
| Long-term Assets | $44,000 | $44,000 | $44,000 | $44,000 | $44,000 | $44,000 | $44,000 | $44,000 | $44,000 | $44,000 | $44,000 | $44,000 | $44,000 |
| Accumulated Depreciation | $0 | $800 | $1,600 | $2,400 | $3,200 | $4,000 | $4,800 | $5,600 | $6,400 | $7,200 | $8,000 | $8,800 | $9,600 |
| Total Long-term Assets | $44,000 | $43,200 | $42,400 | $41,600 | $40,800 | $40,000 | $39,200 | $38,400 | $37,600 | $36,800 | $36,000 | $35,200 | $34,400 |
| Total Assets | $86,000 | $86,789 | $84,544 | $82,068 | $80,473 | $81,530 | $82,992 | $85,395 | $89,419 | $93,512 | $97,271 | $101,035 | $104,803 |
| Liabilities and Capital | Month 1 | Month 2 | Month 3 | Month 4 | Month 5 | Month 6 | Month 7 | Month 8 | Month 9 | Month 10 | Month 11 | Month 12 | |
| Current Liabilities | |||||||||||||
| Accounts Payable | $0 | $6,850 | $8,154 | $8,508 | $9,224 | $10,479 | $11,482 | $12,110 | $13,046 | $13,379 | $13,375 | $13,371 | $13,367 |
| Current Borrowing | $0 | $0 | $0 | $0 | $0 | $0 | $0 | $0 | $0 | $0 | $0 | $0 | $0 |
| Other Current Liabilities | $0 | $0 | $0 | $0 | $0 | $0 | $0 | $0 | $0 | $0 | $0 | $0 | $0 |
| Subtotal Current Liabilities | $0 | $6,850 | $8,154 | $8,508 | $9,224 | $10,479 | $11,482 | $12,110 | $13,046 | $13,379 | $13,375 | $13,371 | $13,367 |
| Long-term Liabilities | $100,000 | $99,000 | $98,000 | $97,000 | $96,000 | $95,000 | $94,000 | $93,000 | $92,000 | $91,000 | $90,000 | $89,000 | $88,000 |
| Total Liabilities | $100,000 | $105,850 | $106,154 | $105,508 | $105,224 | $105,479 | $105,482 | $105,110 | $105,046 | $104,379 | $103,375 | $102,371 | $101,367 |
| Paid-in Capital | $140,000 | $140,000 | $140,000 | $140,000 | $140,000 | $140,000 | $140,000 | $140,000 | $140,000 | $140,000 | $140,000 | $140,000 | $140,000 |
| Retained Earnings | ($154,000) | ($154,000) | ($154,000) | ($154,000) | ($154,000) | ($154,000) | ($154,000) | ($154,000) | ($154,000) | ($154,000) | ($154,000) | ($154,000) | ($154,000) |
| Earnings | $0 | ($5,061) | ($7,611) | ($9,440) | ($10,751) | ($9,949) | ($8,490) | ($5,714) | ($1,627) | $3,132 | $7,896 | $12,663 | $17,435 |
| Total Capital | ($14,000) | ($19,061) | ($21,611) | ($23,440) | ($24,751) | ($23,949) | ($22,490) | ($19,714) | ($15,627) | ($10,868) | ($6,104) | ($1,337) | $3,435 |
| Total Liabilities and Capital | $86,000 | $86,789 | $84,544 | $82,068 | $80,473 | $81,530 | $82,992 | $85,395 | $89,419 | $93,512 | $97,271 | $101,035 | $104,803 |
| Net Worth | ($14,000) | ($19,061) | ($21,611) | ($23,440) | ($24,751) | ($23,949) | ($22,490) | ($19,714) | ($15,627) | ($10,868) | ($6,104) | ($1,337) | $3,435 |


