
The House of Pine
Executive Summary
Producing and selling furniture is a $12 billion industry. The focus of the industry is on the affluent customer who can spend upwards to $3,000 on furniture purchases. In Richmond, there are fifteen furniture stores that are competing for these customers with deep pockets. Those customers who can’t afford these high prices are left with a poor selection of inferior products.
In the Richmond Metro area, there are approximately 50,000 residents with modest incomes that do not have a furniture store to caters to their needs for affordable quality furniture. This income demographic has grown tremendously over the past five years but has not been responded to by the area furniture stores. Targeting customers with modest incomes is good business. They are expected to make up half of metro population by 2020–making them the fastest-growing segment of the city’s housing market.
There are three modest-income housing renovation projects underway in Richmond with a combined total of 1,500 units that will be sold as affordable housing.
As the Richmond Metro section revives, The House of Pine will offer customized, ready-to-finish pine furniture that’s hand made and surprisingly affordable. We offer:
- Truly Custom Furniture: An unfinished furniture piece that is crafted for the customer. We’ll customize any piece or create a whole new piece from a customer’s rough sketch.
- Heirloom Quality Furniture: The furniture is made to last for generations. It’s hand crafted, so each piece is unique.
- Handmade from Quality Pine: Every piece is made by a professional craftsman from the finest pine available. Every piece of pine is checked for grain and texture before it’s used.

1.1 Mission
The House of Pine’s Mission is simple. The customer gets what he/she wants; furniture (one piece or a whole house full) that fits the customer’s space, taste, budget and style preference, from top to bottom!
1.2 Keys to Success
The Keys to Success for The House of Pine are as follows:
- Offer our customers affordable quality furniture that will last.
- Customize any piece as requested by a customer.
- And if customizing a piece won’t quite work, create a whole new piece from scratch, exactly to the customer’s specifications.
Company Summary
The House of Pine will offer customized, ready-to-finish pine furniture that’s hand made and surprisingly affordable. Our target customers are young families and young adults with modest incomes who are looking for the same selection and quality that the high-end customer receives. Each piece is handcrafted from the finest pine and built to last for generations.
2.1 Company Ownership
The House of Pine is owned by Richard Putnam. Richard has over 10 years of experience in furniture manufacturing.
2.2 Company Locations and Facilities
The House of Pine will be centrally located in the industrial section of the Richmond Metro area.
2.3 Start-up Summary
The House of Pine’s start-up costs consists mostly of furniture manufacturing equipment and transport containers. Richard Putnam will invest $50,000. In addition, he will secure a $130,000 loan.

| Start-up | |
| Requirements | |
| Start-up Expenses | |
| Legal | $1,000 |
| Stationery etc. | $200 |
| Insurance | $1,000 |
| Rent | $2,000 |
| Expensed Equipment | $60,000 |
| Total Start-up Expenses | $64,200 |
| Start-up Assets | |
| Cash Required | $5,800 |
| Start-up Inventory | $50,000 |
| Other Current Assets | $0 |
| Long-term Assets | $60,000 |
| Total Assets | $115,800 |
| Total Requirements | $180,000 |
| Start-up Funding | |
| Start-up Expenses to Fund | $64,200 |
| Start-up Assets to Fund | $115,800 |
| Total Funding Required | $180,000 |
| Assets | |
| Non-cash Assets from Start-up | $110,000 |
| Cash Requirements from Start-up | $5,800 |
| Additional Cash Raised | $0 |
| Cash Balance on Starting Date | $5,800 |
| Total Assets | $115,800 |
| Liabilities and Capital | |
| Liabilities | |
| Current Borrowing | $0 |
| Long-term Liabilities | $130,000 |
| Accounts Payable (Outstanding Bills) | $0 |
| Other Current Liabilities (interest-free) | $0 |
| Total Liabilities | $130,000 |
| Capital | |
| Planned Investment | |
| Richard Putnam | $50,000 |
| Other | $0 |
| Additional Investment Requirement | $0 |
| Total Planned Investment | $50,000 |
| Loss at Start-up (Start-up Expenses) | ($64,200) |
| Total Capital | ($14,200) |
| Total Capital and Liabilities | $115,800 |
| Total Funding | $180,000 |
Products and Services
The House of Pine will offer wood products for the bedroom, living and dining room, and the storage room:
- Beds;
- Dressers;
- Chest;
- Armoires;
- Entertainment centers;
- Bookcases;
- Tables;
- Chairs;
- Benches.
Market Analysis Summary
In the Richmond Metro area, there are approximately 50,000 residents with modest incomes. They are expected to make up half of the metro population by 2020–making them the fastest-growing segment of the city’s housing market.
It is estimated that the Richmond Metro area will need 10,000 units of affordable housing in the next seven years. Currently, there are three renovation projects that represent 1,500 new housing units. Next year, two new construction projects will be completed offering another 1,000 units of affordable housing. Another 1,000 unit project, to be located in the Garden Meadows section downtown, is currently in the planning stages.
There are changes occuring around the State University, located downtown, that will also impact the revival of the Richmond Metro area. Two off-campus housing projects will be completed mid-year that will add an additional 2,000 family housing units to the university area.
4.1 Market Segmentation
The growth of affordable housing in the Richmond Metro area is critical to the success of The House of Pine.
We will aggressively market our target customers who live in the Metro area:
- Young working families;
- Students;
- Young adults.
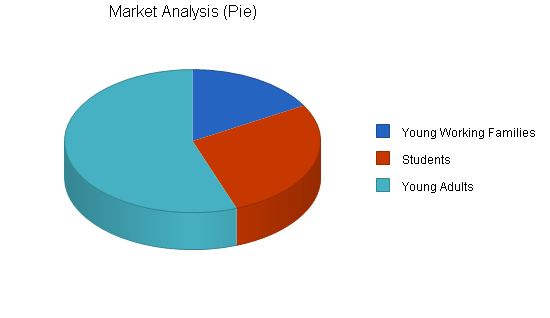
| Market Analysis | |||||||
| Year 1 | Year 2 | Year 3 | Year 4 | Year 5 | |||
| Potential Customers | Growth | CAGR | |||||
| Young Working Families | 12% | 3,000 | 3,360 | 3,763 | 4,215 | 4,721 | 12.00% |
| Students | 10% | 5,000 | 5,500 | 6,050 | 6,655 | 7,321 | 10.00% |
| Young Adults | 10% | 10,000 | 11,000 | 12,100 | 13,310 | 14,641 | 10.00% |
| Total | 10.34% | 18,000 | 19,860 | 21,913 | 24,180 | 26,683 | 10.34% |
Strategy and Implementation Summary
The House of Pine will focus on the modest income furniture customer who live in the Richmond Metro area.
5.1 Competitive Edge
Most of Richmond’s fifteen furniture stores are dispersed throughout the city adjacent to affluent or suburban communities. The stores downtown are high end and offer no affordable products to the Metro residents.
The primary reason for the price of the furniture is the type of wood that is used. A bedroom set made of pine can cost a customer $400. The same set made in oak or maple will cost $800. The profits are higher by focusing on the more expensive wood. When using pine, many manufacturers improve their profits by using cheaper construction techniques. The resulting poor quality of these products have added to a popular misconception that pine is an inferior wood.
The Richmond furniture stores offer a very limited selection of styles in pine. Most products are selected to maximize the store’s profit, not the customer’s satisfaction, since it is believed the customer has few options.
The House of Pine will build its furniture to last generations and will offer the customer all the popular styles.
5.2 Sales Strategy
We will advertise in the university daily student newspaper as well as the Metro area advertising flyer. In the advertisements for the store opening, we will have a 20% off coupon. We will continue this discount for the first month of operation.
The metro area also has six community organizations that send out weekly flyers to all community residents. We will advertise in the these flyers.
5.2.1 Sales Forecast
The following is the sales forecast for the three years.

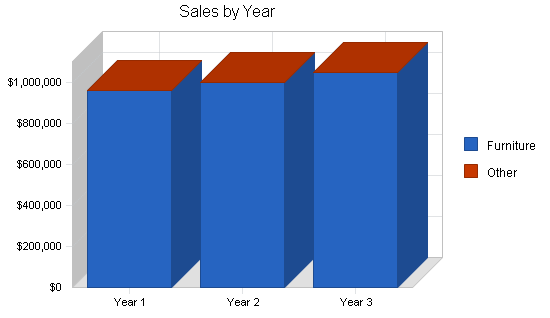
| Sales Forecast | |||
| Year 1 | Year 2 | Year 3 | |
| Sales | |||
| Furniture | $964,000 | $1,000,000 | $1,050,000 |
| Other | $0 | $0 | $0 |
| Total Sales | $964,000 | $1,000,000 | $1,050,000 |
| Direct Cost of Sales | Year 1 | Year 2 | Year 3 |
| Furniture | $432,000 | $430,000 | $450,000 |
| Other | $0 | $0 | $0 |
| Subtotal Direct Cost of Sales | $432,000 | $430,000 | $450,000 |

Management Summary
The store’s owner, Richard Putnam, has worked in the furniture manufacturing industry for over ten years. This experience began at Ingram’s Fine Furniture, where he worked for five years. Within three years, he reached the position of shift manager. Most recently, Richard was the operations manager at Wasserman Furniture Manufacturing.
Richard is an excellent staff supervisor and will do very well in managing the staff of The House of Pine.
6.1 Personnel Plan
The House of Pine will have the following staff members:
- Manager;
- Assistant manager;
- Office manager/accountant;
- Checkers (1.5);
- Production staff (5);
- Stockers (1.5);
| Personnel Plan | |||
| Year 1 | Year 2 | Year 3 | |
| Manager | $36,000 | $40,000 | $45,000 |
| Assistant Manager | $36,000 | $39,000 | $43,000 |
| Office Manager/Bookkeeper | $36,000 | $39,000 | $42,000 |
| Checkers | $32,400 | $35,500 | $40,000 |
| Production Staff | $120,000 | $130,000 | $140,000 |
| Stockers | $39,600 | $43,000 | $46,000 |
| Total People | 9 | 9 | 9 |
| Total Payroll | $300,000 | $326,500 | $356,000 |
Financial Plan
The following is the Financial plan for The House of Pine.
7.1 Break-even Analysis
The following table and chart show our monthly sales break-even point.

| Break-even Analysis | |
| Monthly Revenue Break-even | $69,767 |
| Assumptions: | |
| Average Percent Variable Cost | 45% |
| Estimated Monthly Fixed Cost | $38,502 |
7.2 Projected Profit and Loss
The following table and charts highlight the projected profit and loss for three years.


| Pro Forma Profit and Loss | |||
| Year 1 | Year 2 | Year 3 | |
| Sales | $964,000 | $1,000,000 | $1,050,000 |
| Direct Cost of Sales | $432,000 | $430,000 | $450,000 |
| Other Production Expenses | $0 | $0 | $0 |
| Total Cost of Sales | $432,000 | $430,000 | $450,000 |
| Gross Margin | $532,000 | $570,000 | $600,000 |
| Gross Margin % | 55.19% | 57.00% | 57.14% |
| Expenses | |||
| Payroll | $300,000 | $326,500 | $356,000 |
| Sales and Marketing and Other Expenses | $60,000 | $60,000 | $60,000 |
| Depreciation | $11,424 | $11,424 | $11,424 |
| Leased Equipment | $0 | $0 | $0 |
| Utilities | $9,600 | $9,600 | $9,600 |
| Insurance | $12,000 | $12,000 | $12,000 |
| Rent | $24,000 | $24,000 | $24,000 |
| Payroll Taxes | $45,000 | $48,975 | $53,400 |
| Other | $0 | $0 | $0 |
| Total Operating Expenses | $462,024 | $492,499 | $526,424 |
| Profit Before Interest and Taxes | $69,976 | $77,501 | $73,576 |
| EBITDA | $81,400 | $88,925 | $85,000 |
| Interest Expense | $11,917 | $10,001 | $8,002 |
| Taxes Incurred | $17,418 | $20,250 | $19,672 |
| Net Profit | $40,641 | $47,250 | $45,902 |
| Net Profit/Sales | 4.22% | 4.72% | 4.37% |
7.3 Projected Cash Flow
The following table and chart highlight the projected cash flow for three years.

| Pro Forma Cash Flow | |||
| Year 1 | Year 2 | Year 3 | |
| Cash Received | |||
| Cash from Operations | |||
| Cash Sales | $723,000 | $750,000 | $787,500 |
| Cash from Receivables | $198,158 | $248,400 | $260,278 |
| Subtotal Cash from Operations | $921,158 | $998,400 | $1,047,778 |
| Additional Cash Received | |||
| Sales Tax, VAT, HST/GST Received | $0 | $0 | $0 |
| New Current Borrowing | $0 | $0 | $0 |
| New Other Liabilities (interest-free) | $0 | $0 | $0 |
| New Long-term Liabilities | $0 | $0 | $0 |
| Sales of Other Current Assets | $0 | $0 | $0 |
| Sales of Long-term Assets | $0 | $0 | $0 |
| New Investment Received | $0 | $0 | $0 |
| Subtotal Cash Received | $921,158 | $998,400 | $1,047,778 |
| Expenditures | Year 1 | Year 2 | Year 3 |
| Expenditures from Operations | |||
| Cash Spending | $300,000 | $326,500 | $356,000 |
| Bill Payments | $539,935 | $637,773 | $637,056 |
| Subtotal Spent on Operations | $839,935 | $964,273 | $993,056 |
| Additional Cash Spent | |||
| Sales Tax, VAT, HST/GST Paid Out | $0 | $0 | $0 |
| Principal Repayment of Current Borrowing | $0 | $0 | $0 |
| Other Liabilities Principal Repayment | $0 | $0 | $0 |
| Long-term Liabilities Principal Repayment | $19,992 | $19,992 | $19,992 |
| Purchase Other Current Assets | $0 | $0 | $0 |
| Purchase Long-term Assets | $0 | $0 | $0 |
| Dividends | $0 | $0 | $0 |
| Subtotal Cash Spent | $859,927 | $984,265 | $1,013,048 |
| Net Cash Flow | $61,231 | $14,136 | $34,730 |
| Cash Balance | $67,031 | $81,167 | $115,897 |
7.4 Projected Balance Sheet
The following table highlights the projected balance sheet for three years.
| Pro Forma Balance Sheet | |||
| Year 1 | Year 2 | Year 3 | |
| Assets | |||
| Current Assets | |||
| Cash | $67,031 | $81,167 | $115,897 |
| Accounts Receivable | $42,842 | $44,442 | $46,664 |
| Inventory | $51,700 | $51,461 | $53,854 |
| Other Current Assets | $0 | $0 | $0 |
| Total Current Assets | $161,573 | $177,069 | $216,415 |
| Long-term Assets | |||
| Long-term Assets | $60,000 | $60,000 | $60,000 |
| Accumulated Depreciation | $11,424 | $22,848 | $34,272 |
| Total Long-term Assets | $48,576 | $37,152 | $25,728 |
| Total Assets | $210,149 | $214,221 | $242,143 |
| Liabilities and Capital | Year 1 | Year 2 | Year 3 |
| Current Liabilities | |||
| Accounts Payable | $73,700 | $50,514 | $52,526 |
| Current Borrowing | $0 | $0 | $0 |
| Other Current Liabilities | $0 | $0 | $0 |
| Subtotal Current Liabilities | $73,700 | $50,514 | $52,526 |
| Long-term Liabilities | $110,008 | $90,016 | $70,024 |
| Total Liabilities | $183,708 | $140,530 | $122,550 |
| Paid-in Capital | $50,000 | $50,000 | $50,000 |
| Retained Earnings | ($64,200) | ($23,559) | $23,691 |
| Earnings | $40,641 | $47,250 | $45,902 |
| Total Capital | $26,441 | $73,691 | $119,593 |
| Total Liabilities and Capital | $210,149 | $214,221 | $242,143 |
| Net Worth | $26,441 | $73,691 | $119,593 |
7.5 Business Ratios
Business ratios for the years of this plan are shown below. Industry profile ratios based on the Standard Industrial Classification (SIC) code 5712, Furniture Stores, are shown for comparison.
The following is an explanation of the plans divergence with industry ratio profile.
- Sales Growth – will start below the industry average but will be closer to the average after the third year of operation.
- Accounts Receivable – is slightly below average due to the low use of credit for purchases (25%).
- Inventory – is below the industry average because 20% of the furniture will be built to order.
- Long Term Assets, Long Term Liabilities, and Expense of Sales – are higher because The House Of Pine builds furniture on site.
| Ratio Analysis | ||||
| Year 1 | Year 2 | Year 3 | Industry Profile | |
| Sales Growth | 0.00% | 3.73% | 5.00% | 6.20% |
| Percent of Total Assets | ||||
| Accounts Receivable | 20.39% | 20.75% | 19.27% | 21.00% |
| Inventory | 24.60% | 24.02% | 22.24% | 38.80% |
| Other Current Assets | 0.00% | 0.00% | 0.00% | 21.70% |
| Total Current Assets | 76.88% | 82.66% | 89.37% | 81.50% |
| Long-term Assets | 23.12% | 17.34% | 10.63% | 18.50% |
| Total Assets | 100.00% | 100.00% | 100.00% | 100.00% |
| Current Liabilities | 35.07% | 23.58% | 21.69% | 44.90% |
| Long-term Liabilities | 52.35% | 42.02% | 28.92% | 13.70% |
| Total Liabilities | 87.42% | 65.60% | 50.61% | 58.60% |
| Net Worth | 12.58% | 34.40% | 49.39% | 41.40% |
| Percent of Sales | ||||
| Sales | 100.00% | 100.00% | 100.00% | 100.00% |
| Gross Margin | 55.19% | 57.00% | 57.14% | 37.60% |
| Selling, General & Administrative Expenses | 50.97% | 52.28% | 52.77% | 20.80% |
| Advertising Expenses | 6.22% | 6.00% | 5.71% | 4.40% |
| Profit Before Interest and Taxes | 7.26% | 7.75% | 7.01% | 1.60% |
| Main Ratios | ||||
| Current | 2.19 | 3.51 | 4.12 | 1.82 |
| Quick | 1.49 | 2.49 | 3.09 | 0.76 |
| Total Debt to Total Assets | 87.42% | 65.60% | 50.61% | 58.60% |
| Pre-tax Return on Net Worth | 219.58% | 91.60% | 54.83% | 3.80% |
| Pre-tax Return on Assets | 27.63% | 31.51% | 27.08% | 9.20% |
| Additional Ratios | Year 1 | Year 2 | Year 3 | |
| Net Profit Margin | 4.22% | 4.72% | 4.37% | n.a |
| Return on Equity | 153.70% | 64.12% | 38.38% | n.a |
| Activity Ratios | ||||
| Accounts Receivable Turnover | 5.63 | 5.63 | 5.63 | n.a |
| Collection Days | 57 | 64 | 63 | n.a |
| Inventory Turnover | 10.73 | 8.34 | 8.55 | n.a |
| Accounts Payable Turnover | 8.33 | 12.17 | 12.17 | n.a |
| Payment Days | 27 | 37 | 29 | n.a |
| Total Asset Turnover | 4.59 | 4.67 | 4.34 | n.a |
| Debt Ratios | ||||
| Debt to Net Worth | 6.95 | 1.91 | 1.02 | n.a |
| Current Liab. to Liab. | 0.40 | 0.36 | 0.43 | n.a |
| Liquidity Ratios | ||||
| Net Working Capital | $87,873 | $126,555 | $163,889 | n.a |
| Interest Coverage | 5.87 | 7.75 | 9.19 | n.a |
| Additional Ratios | ||||
| Assets to Sales | 0.22 | 0.21 | 0.23 | n.a |
| Current Debt/Total Assets | 35% | 24% | 22% | n.a |
| Acid Test | 0.91 | 1.61 | 2.21 | n.a |
| Sales/Net Worth | 36.46 | 13.57 | 8.78 | n.a |
| Dividend Payout | 0.00 | 0.00 | 0.00 | n.a |
Appendix
| Sales Forecast | |||||||||||||
| Month 1 | Month 2 | Month 3 | Month 4 | Month 5 | Month 6 | Month 7 | Month 8 | Month 9 | Month 10 | Month 11 | Month 12 | ||
| Sales | |||||||||||||
| Furniture | 0% | $50,000 | $60,000 | $70,000 | $75,000 | $85,000 | $90,000 | $100,000 | $85,000 | $90,000 | $85,000 | $79,000 | $95,000 |
| Other | 0% | $0 | $0 | $0 | $0 | $0 | $0 | $0 | $0 | $0 | $0 | $0 | $0 |
| Total Sales | $50,000 | $60,000 | $70,000 | $75,000 | $85,000 | $90,000 | $100,000 | $85,000 | $90,000 | $85,000 | $79,000 | $95,000 | |
| Direct Cost of Sales | Month 1 | Month 2 | Month 3 | Month 4 | Month 5 | Month 6 | Month 7 | Month 8 | Month 9 | Month 10 | Month 11 | Month 12 | |
| Furniture | $20,000 | $22,000 | $31,000 | $34,000 | $40,000 | $42,000 | $45,000 | $38,000 | $41,000 | $37,000 | $35,000 | $47,000 | |
| Other | $0 | $0 | $0 | $0 | $0 | $0 | $0 | $0 | $0 | $0 | $0 | $0 | |
| Subtotal Direct Cost of Sales | $20,000 | $22,000 | $31,000 | $34,000 | $40,000 | $42,000 | $45,000 | $38,000 | $41,000 | $37,000 | $35,000 | $47,000 | |
| Personnel Plan | |||||||||||||
| Month 1 | Month 2 | Month 3 | Month 4 | Month 5 | Month 6 | Month 7 | Month 8 | Month 9 | Month 10 | Month 11 | Month 12 | ||
| Manager | 0% | $3,000 | $3,000 | $3,000 | $3,000 | $3,000 | $3,000 | $3,000 | $3,000 | $3,000 | $3,000 | $3,000 | $3,000 |
| Assistant Manager | 0% | $3,000 | $3,000 | $3,000 | $3,000 | $3,000 | $3,000 | $3,000 | $3,000 | $3,000 | $3,000 | $3,000 | $3,000 |
| Office Manager/Bookkeeper | 0% | $3,000 | $3,000 | $3,000 | $3,000 | $3,000 | $3,000 | $3,000 | $3,000 | $3,000 | $3,000 | $3,000 | $3,000 |
| Checkers | 0% | $2,700 | $2,700 | $2,700 | $2,700 | $2,700 | $2,700 | $2,700 | $2,700 | $2,700 | $2,700 | $2,700 | $2,700 |
| Production Staff | 0% | $10,000 | $10,000 | $10,000 | $10,000 | $10,000 | $10,000 | $10,000 | $10,000 | $10,000 | $10,000 | $10,000 | $10,000 |
| Stockers | 0% | $3,300 | $3,300 | $3,300 | $3,300 | $3,300 | $3,300 | $3,300 | $3,300 | $3,300 | $3,300 | $3,300 | $3,300 |
| Total People | 9 | 9 | 9 | 9 | 9 | 9 | 9 | 9 | 9 | 9 | 9 | 9 | |
| Total Payroll | $25,000 | $25,000 | $25,000 | $25,000 | $25,000 | $25,000 | $25,000 | $25,000 | $25,000 | $25,000 | $25,000 | $25,000 | |
| General Assumptions | |||||||||||||
| Month 1 | Month 2 | Month 3 | Month 4 | Month 5 | Month 6 | Month 7 | Month 8 | Month 9 | Month 10 | Month 11 | Month 12 | ||
| Plan Month | 1 | 2 | 3 | 4 | 5 | 6 | 7 | 8 | 9 | 10 | 11 | 12 | |
| Current Interest Rate | 10.00% | 10.00% | 10.00% | 10.00% | 10.00% | 10.00% | 10.00% | 10.00% | 10.00% | 10.00% | 10.00% | 10.00% | |
| Long-term Interest Rate | 10.00% | 10.00% | 10.00% | 10.00% | 10.00% | 10.00% | 10.00% | 10.00% | 10.00% | 10.00% | 10.00% | 10.00% | |
| Tax Rate | 30.00% | 30.00% | 30.00% | 30.00% | 30.00% | 30.00% | 30.00% | 30.00% | 30.00% | 30.00% | 30.00% | 30.00% | |
| Other | 0 | 0 | 0 | 0 | 0 | 0 | 0 | 0 | 0 | 0 | 0 | 0 | |
| Pro Forma Profit and Loss | |||||||||||||
| Month 1 | Month 2 | Month 3 | Month 4 | Month 5 | Month 6 | Month 7 | Month 8 | Month 9 | Month 10 | Month 11 | Month 12 | ||
| Sales | $50,000 | $60,000 | $70,000 | $75,000 | $85,000 | $90,000 | $100,000 | $85,000 | $90,000 | $85,000 | $79,000 | $95,000 | |
| Direct Cost of Sales | $20,000 | $22,000 | $31,000 | $34,000 | $40,000 | $42,000 | $45,000 | $38,000 | $41,000 | $37,000 | $35,000 | $47,000 | |
| Other Production Expenses | $0 | $0 | $0 | $0 | $0 | $0 | $0 | $0 | $0 | $0 | $0 | $0 | |
| Total Cost of Sales | $20,000 | $22,000 | $31,000 | $34,000 | $40,000 | $42,000 | $45,000 | $38,000 | $41,000 | $37,000 | $35,000 | $47,000 | |
| Gross Margin | $30,000 | $38,000 | $39,000 | $41,000 | $45,000 | $48,000 | $55,000 | $47,000 | $49,000 | $48,000 | $44,000 | $48,000 | |
| Gross Margin % | 60.00% | 63.33% | 55.71% | 54.67% | 52.94% | 53.33% | 55.00% | 55.29% | 54.44% | 56.47% | 55.70% | 50.53% | |
| Expenses | |||||||||||||
| Payroll | $25,000 | $25,000 | $25,000 | $25,000 | $25,000 | $25,000 | $25,000 | $25,000 | $25,000 | $25,000 | $25,000 | $25,000 | |
| Sales and Marketing and Other Expenses | $5,000 | $5,000 | $5,000 | $5,000 | $5,000 | $5,000 | $5,000 | $5,000 | $5,000 | $5,000 | $5,000 | $5,000 | |
| Depreciation | $952 | $952 | $952 | $952 | $952 | $952 | $952 | $952 | $952 | $952 | $952 | $952 | |
| Leased Equipment | $0 | $0 | $0 | $0 | $0 | $0 | $0 | $0 | $0 | $0 | $0 | $0 | |
| Utilities | $800 | $800 | $800 | $800 | $800 | $800 | $800 | $800 | $800 | $800 | $800 | $800 | |
| Insurance | $1,000 | $1,000 | $1,000 | $1,000 | $1,000 | $1,000 | $1,000 | $1,000 | $1,000 | $1,000 | $1,000 | $1,000 | |
| Rent | $2,000 | $2,000 | $2,000 | $2,000 | $2,000 | $2,000 | $2,000 | $2,000 | $2,000 | $2,000 | $2,000 | $2,000 | |
| Payroll Taxes | 15% | $3,750 | $3,750 | $3,750 | $3,750 | $3,750 | $3,750 | $3,750 | $3,750 | $3,750 | $3,750 | $3,750 | $3,750 |
| Other | $0 | $0 | $0 | $0 | $0 | $0 | $0 | $0 | $0 | $0 | $0 | $0 | |
| Total Operating Expenses | $38,502 | $38,502 | $38,502 | $38,502 | $38,502 | $38,502 | $38,502 | $38,502 | $38,502 | $38,502 | $38,502 | $38,502 | |
| Profit Before Interest and Taxes | ($8,502) | ($502) | $498 | $2,498 | $6,498 | $9,498 | $16,498 | $8,498 | $10,498 | $9,498 | $5,498 | $9,498 | |
| EBITDA | ($7,550) | $450 | $1,450 | $3,450 | $7,450 | $10,450 | $17,450 | $9,450 | $11,450 | $10,450 | $6,450 | $10,450 | |
| Interest Expense | $1,069 | $1,056 | $1,042 | $1,028 | $1,014 | $1,000 | $986 | $972 | $958 | $945 | $931 | $917 | |
| Taxes Incurred | ($2,871) | ($467) | ($163) | $441 | $1,645 | $2,549 | $4,654 | $2,258 | $2,862 | $2,566 | $1,370 | $2,574 | |
| Net Profit | ($6,700) | ($1,090) | ($381) | $1,029 | $3,839 | $5,949 | $10,858 | $5,268 | $6,678 | $5,987 | $3,197 | $6,007 | |
| Net Profit/Sales | -13.40% | -1.82% | -0.54% | 1.37% | 4.52% | 6.61% | 10.86% | 6.20% | 7.42% | 7.04% | 4.05% | 6.32% | |
| Pro Forma Cash Flow | |||||||||||||
| Month 1 | Month 2 | Month 3 | Month 4 | Month 5 | Month 6 | Month 7 | Month 8 | Month 9 | Month 10 | Month 11 | Month 12 | ||
| Cash Received | |||||||||||||
| Cash from Operations | |||||||||||||
| Cash Sales | $37,500 | $45,000 | $52,500 | $56,250 | $63,750 | $67,500 | $75,000 | $63,750 | $67,500 | $63,750 | $59,250 | $71,250 | |
| Cash from Receivables | $0 | $417 | $12,583 | $15,083 | $17,542 | $18,833 | $21,292 | $22,583 | $24,875 | $21,292 | $22,458 | $21,200 | |
| Subtotal Cash from Operations | $37,500 | $45,417 | $65,083 | $71,333 | $81,292 | $86,333 | $96,292 | $86,333 | $92,375 | $85,042 | $81,708 | $92,450 | |
| Additional Cash Received | |||||||||||||
| Sales Tax, VAT, HST/GST Received | 0.00% | $0 | $0 | $0 | $0 | $0 | $0 | $0 | $0 | $0 | $0 | $0 | $0 |
| New Current Borrowing | $0 | $0 | $0 | $0 | $0 | $0 | $0 | $0 | $0 | $0 | $0 | $0 | |
| New Other Liabilities (interest-free) | $0 | $0 | $0 | $0 | $0 | $0 | $0 | $0 | $0 | $0 | $0 | $0 | |
| New Long-term Liabilities | $0 | $0 | $0 | $0 | $0 | $0 | $0 | $0 | $0 | $0 | $0 | $0 | |
| Sales of Other Current Assets | $0 | $0 | $0 | $0 | $0 | $0 | $0 | $0 | $0 | $0 | $0 | $0 | |
| Sales of Long-term Assets | $0 | $0 | $0 | $0 | $0 | $0 | $0 | $0 | $0 | $0 | $0 | $0 | |
| New Investment Received | $0 | $0 | $0 | $0 | $0 | $0 | $0 | $0 | $0 | $0 | $0 | $0 | |
| Subtotal Cash Received | $37,500 | $45,417 | $65,083 | $71,333 | $81,292 | $86,333 | $96,292 | $86,333 | $92,375 | $85,042 | $81,708 | $92,450 | |
| Expenditures | Month 1 | Month 2 | Month 3 | Month 4 | Month 5 | Month 6 | Month 7 | Month 8 | Month 9 | Month 10 | Month 11 | Month 12 | |
| Expenditures from Operations | |||||||||||||
| Cash Spending | $25,000 | $25,000 | $25,000 | $25,000 | $25,000 | $25,000 | $25,000 | $25,000 | $25,000 | $25,000 | $25,000 | $25,000 | |
| Bill Payments | $358 | $11,368 | $30,171 | $54,228 | $51,669 | $61,759 | $60,506 | $65,809 | $46,566 | $60,270 | $48,627 | $48,604 | |
| Subtotal Spent on Operations | $25,358 | $36,368 | $55,171 | $79,228 | $76,669 | $86,759 | $85,506 | $90,809 | $71,566 | $85,270 | $73,627 | $73,604 | |
| Additional Cash Spent | |||||||||||||
| Sales Tax, VAT, HST/GST Paid Out | $0 | $0 | $0 | $0 | $0 | $0 | $0 | $0 | $0 | $0 | $0 | $0 | |
| Principal Repayment of Current Borrowing | $0 | $0 | $0 | $0 | $0 | $0 | $0 | $0 | $0 | $0 | $0 | $0 | |
| Other Liabilities Principal Repayment | $0 | $0 | $0 | $0 | $0 | $0 | $0 | $0 | $0 | $0 | $0 | $0 | |
| Long-term Liabilities Principal Repayment | $1,666 | $1,666 | $1,666 | $1,666 | $1,666 | $1,666 | $1,666 | $1,666 | $1,666 | $1,666 | $1,666 | $1,666 | |
| Purchase Other Current Assets | $0 | $0 | $0 | $0 | $0 | $0 | $0 | $0 | $0 | $0 | $0 | $0 | |
| Purchase Long-term Assets | $0 | $0 | $0 | $0 | $0 | $0 | $0 | $0 | $0 | $0 | $0 | $0 | |
| Dividends | $0 | $0 | $0 | $0 | $0 | $0 | $0 | $0 | $0 | $0 | $0 | $0 | |
| Subtotal Cash Spent | $27,024 | $38,034 | $56,837 | $80,894 | $78,335 | $88,425 | $87,172 | $92,475 | $73,232 | $86,936 | $75,293 | $75,270 | |
| Net Cash Flow | $10,476 | $7,383 | $8,246 | ($9,561) | $2,957 | ($2,091) | $9,120 | ($6,142) | $19,143 | ($1,894) | $6,415 | $17,180 | |
| Cash Balance | $16,276 | $23,659 | $31,905 | $22,344 | $25,301 | $23,209 | $32,329 | $26,187 | $45,330 | $43,436 | $49,851 | $67,031 | |
| Pro Forma Balance Sheet | |||||||||||||
| Month 1 | Month 2 | Month 3 | Month 4 | Month 5 | Month 6 | Month 7 | Month 8 | Month 9 | Month 10 | Month 11 | Month 12 | ||
| Assets | Starting Balances | ||||||||||||
| Current Assets | |||||||||||||
| Cash | $5,800 | $16,276 | $23,659 | $31,905 | $22,344 | $25,301 | $23,209 | $32,329 | $26,187 | $45,330 | $43,436 | $49,851 | $67,031 |
| Accounts Receivable | $0 | $12,500 | $27,083 | $32,000 | $35,667 | $39,375 | $43,042 | $46,750 | $45,417 | $43,042 | $43,000 | $40,292 | $42,842 |
| Inventory | $50,000 | $30,000 | $24,200 | $34,100 | $37,400 | $44,000 | $46,200 | $49,500 | $41,800 | $45,100 | $40,700 | $38,500 | $51,700 |
| Other Current Assets | $0 | $0 | $0 | $0 | $0 | $0 | $0 | $0 | $0 | $0 | $0 | $0 | $0 |
| Total Current Assets | $55,800 | $58,776 | $74,942 | $98,005 | $95,410 | $108,676 | $112,451 | $128,579 | $113,404 | $133,472 | $127,136 | $128,643 | $161,573 |
| Long-term Assets | |||||||||||||
| Long-term Assets | $60,000 | $60,000 | $60,000 | $60,000 | $60,000 | $60,000 | $60,000 | $60,000 | $60,000 | $60,000 | $60,000 | $60,000 | $60,000 |
| Accumulated Depreciation | $0 | $952 | $1,904 | $2,856 | $3,808 | $4,760 | $5,712 | $6,664 | $7,616 | $8,568 | $9,520 | $10,472 | $11,424 |
| Total Long-term Assets | $60,000 | $59,048 | $58,096 | $57,144 | $56,192 | $55,240 | $54,288 | $53,336 | $52,384 | $51,432 | $50,480 | $49,528 | $48,576 |
| Total Assets | $115,800 | $117,824 | $133,038 | $155,149 | $151,602 | $163,916 | $166,739 | $181,915 | $165,788 | $184,904 | $177,616 | $178,171 | $210,149 |
| Liabilities and Capital | Month 1 | Month 2 | Month 3 | Month 4 | Month 5 | Month 6 | Month 7 | Month 8 | Month 9 | Month 10 | Month 11 | Month 12 | |
| Current Liabilities | |||||||||||||
| Accounts Payable | $0 | $10,390 | $28,360 | $52,518 | $49,608 | $59,749 | $58,289 | $64,273 | $44,544 | $58,648 | $47,039 | $46,062 | $73,700 |
| Current Borrowing | $0 | $0 | $0 | $0 | $0 | $0 | $0 | $0 | $0 | $0 | $0 | $0 | $0 |
| Other Current Liabilities | $0 | $0 | $0 | $0 | $0 | $0 | $0 | $0 | $0 | $0 | $0 | $0 | $0 |
| Subtotal Current Liabilities | $0 | $10,390 | $28,360 | $52,518 | $49,608 | $59,749 | $58,289 | $64,273 | $44,544 | $58,648 | $47,039 | $46,062 | $73,700 |
| Long-term Liabilities | $130,000 | $128,334 | $126,668 | $125,002 | $123,336 | $121,670 | $120,004 | $118,338 | $116,672 | $115,006 | $113,340 | $111,674 | $110,008 |
| Total Liabilities | $130,000 | $138,724 | $155,028 | $177,520 | $172,944 | $181,419 | $178,293 | $182,611 | $161,216 | $173,654 | $160,379 | $157,736 | $183,708 |
| Paid-in Capital | $50,000 | $50,000 | $50,000 | $50,000 | $50,000 | $50,000 | $50,000 | $50,000 | $50,000 | $50,000 | $50,000 | $50,000 | $50,000 |
| Retained Earnings | ($64,200) | ($64,200) | ($64,200) | ($64,200) | ($64,200) | ($64,200) | ($64,200) | ($64,200) | ($64,200) | ($64,200) | ($64,200) | ($64,200) | ($64,200) |
| Earnings | $0 | ($6,700) | ($7,790) | ($8,171) | ($7,142) | ($3,303) | $2,646 | $13,504 | $18,772 | $25,450 | $31,437 | $34,634 | $40,641 |
| Total Capital | ($14,200) | ($20,900) | ($21,990) | ($22,371) | ($21,342) | ($17,503) | ($11,554) | ($696) | $4,572 | $11,250 | $17,237 | $20,434 | $26,441 |
| Total Liabilities and Capital | $115,800 | $117,824 | $133,038 | $155,149 | $151,602 | $163,916 | $166,739 | $181,915 | $165,788 | $184,904 | $177,616 | $178,171 | $210,149 |
| Net Worth | ($14,200) | ($20,900) | ($21,990) | ($22,371) | ($21,342) | ($17,503) | ($11,554) | ($696) | $4,572 | $11,250 | $17,237 | $20,434 | $26,441 |

