
University Cycle Works
Executive Summary
University Cycle Works is an established bicycle specialty store, offering retail sales of new bicycles, parts and accessories, clothing, and maintenance and repair service. It is located in a heavily trafficked, university-focused area.
The primary market for University Cycle Works is the university student population, which normally has a turnover/growth of approximately 25% each year. The secondary market is the university faculty and staff, and the tertiary market is the greater Metroburg community.
Hubert “Hub” Freewheeler has been the assistant manager of University Cycle Works for five years, with an additional seven years of bicycle industry retail sales and service experience. Hub first began investigating the ownership of a bike business two years ago, however, the local Metroburg market seemed saturated with shops. Realizing that a more practical option would be to buy an existing shop, Hub approached his current boss. The result of two years of negotiations will be the sale of University Cycle Works to Hub taking effect July 1, 2001. The goal will be a seamless transfer of ownership, with staff, bike lines, location, and operations unchanged.
This business plan is being prepared for presentation to Metroburg Business Bank, and to the store’s major suppliers of new bicycles, accessories, and parts. A substantial part of the past year’s planning has been negotiations with these suppliers to maintain the current financial agreements as the business changed hands. These negotiations benefited greatly by the good working relationships Hub had developed with the various suppliers’ sales representatives, who advocated on Hub’s behalf. The suppliers have provisionally granted continuation of existing terms and dating programs, pending review of this business plan.
Note: Names, proprietary information, and some financials have been disguised in this sample plan.

1.1 Objectives
The objectives for University Cycle Works are:
- Continue to provide the high quality of sales and services that University Cycle Works is known for.
- Manage a seamless transfer of ownership.
- Maintain a financially healthy business and validate the trust and advocacy of other people in support of this business purchase.
- Repay the start-up loan provided by family members within the first year.
- Achieve monthly and yearly sales equal to or better than the previous year under the former owner.
- Aim to improve sales of bicycle specific garments and rainwear over the year.
- Focus marketing on new student influx to maintain current growth in sales and service revenue.
1.2 Keys to Success
Our premier, high visibility location immediately adjacent to the State University in Metroburg has been critical to our success as the bicycle sales and service purveyor of choice to the university community.
The continuance of established accounts payable, sales programs, and co-op advertising resources by suppliers of bicycles, accessories, and parts makes the financial plan reasonable and attainable. Without this support, the purchase of the business would be unacceptably risky.
Buying and continuing to use the recognized, well respected name University Cycle Works provides continuity for the customers, the owner, and the employees.
Retaining and promoting the current employees of the shop is as important as any other item here. They are the life of University Cycle Works. Long-term relationships with customers have always been a hallmark of the University Cycle Works experience. We recognize and address our customers by name, and want to be part of their university experience.
Company Summary
University Cycle Works is a subchapter S corporation, and is currently owned by Han Delbar. Hubert “Hub” Freewheeler, current assistant manager of University Cycle Works, is purchasing University Cycle Works from Delbar, acquiring existing inventory, and assuming outstanding accounts payable and dating program debts to suppliers, location lease, customer base and information, and University Cycle Works’ business name and goodwill. The business will continue to be a subchapter S corporation. Exchange of ownership will occur on July 1, of this year.
To establish an accurate accounting of existing inventory and outstanding debts, the prior year’s closing inventory and year end financial statement as reviewed by the business’ CPA were used as benchmarks. The sales, orders placed, deliveries received, and accounts payable payments made have been tracked each month, and a trial balance of these will be run June 15 to establish the final purchase price for inventory on hand, and the amount of Accounts Payable assumed. The figures presented here are conservative, realistic estimates used for planning purposes.
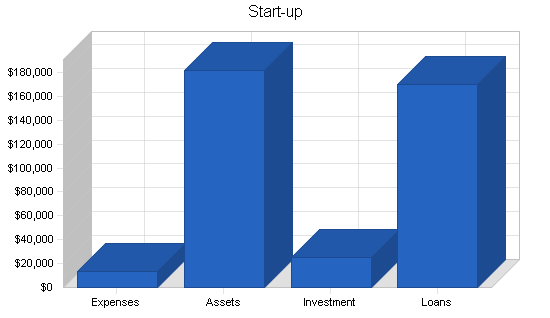
2.1 Start-up Summary
The current owner, Han Delbar, has sold the business to Hub for $140,000. To help determine this price, a business valuation specialist was hired. This professional priced existing store fixtures, tools, and mobile leasehold improvements. These included bicycle wall racks, display cases, track lighting, repair and assembly tools, supply cabinets and storage shelving, air compressor, etc., and are part of the purchase price.
The value of the existing company, its reputation, assumption of the business name, existing client base, etc. is recognized as part of the purchase. It appears as a start-up expense in the following table as Down Payment. The balance appears as a long-term liability. Additional payments shall be made monthly.
Inventory, accounts payable, and invoices were tracked for five months to determine an accurate price of current inventory and amounts of accounts payable assumed.
A deposit equal to one month rent was required by the landlord as assurance in continuing the current lease to the new owner. It appears as a short-term asset.
Hub is investing some of his own money, partially a home equity loan, in the company. An additional amount is being invested, as short-term interest free loans, by family members. This plan calls for these loans to be repaid in the first year.
| Start-up | |
| Requirements | |
| Start-up Expenses | |
| Legal | $1,600 |
| Stationery etc. | $250 |
| Promotional Materials | $300 |
| Consultants | $800 |
| Insurance | $350 |
| Down Payment | $10,000 |
| Total Start-up Expenses | $13,300 |
| Start-up Assets | |
| Cash Required | $95,000 |
| Start-up Inventory | $17,000 |
| Other Current Assets | $8,000 |
| Long-term Assets | $61,500 |
| Total Assets | $181,500 |
| Total Requirements | $194,800 |
| Start-up Funding | |
| Start-up Expenses to Fund | $13,300 |
| Start-up Assets to Fund | $181,500 |
| Total Funding Required | $194,800 |
| Assets | |
| Non-cash Assets from Start-up | $86,500 |
| Cash Requirements from Start-up | $95,000 |
| Additional Cash Raised | $0 |
| Cash Balance on Starting Date | $95,000 |
| Total Assets | $181,500 |
| Liabilities and Capital | |
| Liabilities | |
| Current Borrowing | $2,000 |
| Long-term Liabilities | $130,000 |
| Accounts Payable (Outstanding Bills) | $27,800 |
| Other Current Liabilities (interest-free) | $10,000 |
| Total Liabilities | $169,800 |
| Capital | |
| Planned Investment | |
| New Owner | $25,000 |
| Investor 2 | $0 |
| Other | $0 |
| Additional Investment Requirement | $0 |
| Total Planned Investment | $25,000 |
| Loss at Start-up (Start-up Expenses) | ($13,300) |
| Total Capital | $11,700 |
| Total Capital and Liabilities | $181,500 |
| Total Funding | $194,800 |
2.2 Company Locations and Facilities
University Cycle Works is located in Metroburg, a major city on the east/west Interstate. Metroburg is also home to the main univeristy campus. Outdoor recreation is very popular in the area; there are bicycle friendly country roads leading to parks and lakes, as well as an extensive array of mountain biking trails for the more adventurous.
Located in the first block off campus, University Cycle Works is in a premier location to be the major supplier of bicycles, accessories, and repair services to university students and staff. The street is locally known as “the Beach,” and is the major student thoroughfare to and from campus. Parking for cars is scarce around campus, therefore bicycles and feet are the preferred mode of transportation.

The store is 2,000 sq. ft. of interior space with covered outside space adjacent to the heavily trafficked sidewalk. Used bicycles are displayed in this space. One or two new bikes are displayed as well as a visual draw. All are secured with lock and cable. As a service to all cyclists, a hose from the air compressor and a pressure gauge are present under the overhang next to the sidewalk. This primes the pump for quite a bit of spontaneous walk-in business.
Products and Services
Retail Sales
- Bicycles. We sell new bicycles, predominantly in the mountain bike style, retro-cruiser is a close second, and sport/touring/racing road bikes a distant third. We also sell some used bikes which we take in on trade as a service to our customers who are buying new bikes.
- Accessories. We offer a wide variety of accessories. Locks, computer speedometers, fenders, cargo racks, comfortable seats, headlights, helmets, water bottles, panniers/back packs/messenger bags, child seats and trailers, bike storage racks, and auto roof rack systems all fall in this category. It is not possible to carry every possible accessory, so we try to carefully chose those which will be most useful or desired by our target markets. When we receive special requests for a new item, we’ll often order several to test the local demand, and if adequate, will add it to our regular stock.
- Clothing. Clothing appeals to all cyclists, whether it is a logo emblazoned T-shirt or a piece of waterproof rainwear. At University Cycle Works, we rotate our clothing based on the season. Just before the autumn rains we stock jackets and Gore-Tex. Come winter we offer helmet covers and liners, insulated jerseys and pants, gloves, and shoe covers. And when spring arrives and the first crocus appears through the melting snow, we start displaying summer jerseys, and racing shorts.
- Parts. Parts generally refers to pieces or materials necessary to the basic functioning of the bicycle. Generally, parts are installed during service [see below] and are an additional charge beyond the service fees. Some, like cranksets, pedals, tires, derailleurs or brakes, are both integral parts and upgrade accessories. Others, such as headsets, bottom brackets, spokes, chains, cables, and cable housings are strictly maintenance, though some will be sold to cyclists who prefer to work on their bikes themselves.
Service
University Cycle Works is a full-service specialized bicycle shop. Our service offering includes, but is not limited to:
- Free 30-day/100-mile tune up with every new bike sold.
- Quick repairs for flat tires, broken chains, brake cables, etc.
- Scheduled tune-ups, replacement of all bearing surfaces, repacking of lubricants, and adjustments of derailleurs and brake systems.
- Installation of all accessories.
- Authorized warranty repairs on the bikes.
- Custom wheel building.
- Frameset repairs by outsourcing to Via Porco custom frame builders.
3.1 Competitive Comparison
In almost any retail industry a specialty shop will be slightly more expensive than a mass retailer, due to the higher prices charged by suppliers. University Cycle Works is no exception. The prices we charge for bicycles, parts, and accessories is higher than the prices charged by a K-Mart, GI Joe’s, Target, or by mail-order.
What we do offer, which these large retail outlets cannot match, is friendly, knowledgeable service. We are passionate about bicycles. People do not go into the bicycle business because they want to get rich quickly. They enter the bicycle industry because they love bicycles. That kind of passion and committment comes across to customers when they find a sales person who can fit them to a bicycle so they feel comfortable and want to ride it. Someone who recognizes you and remembers your name is a welcome feature at a specialty store.
Local service is a major drawing factor for a specialty store such as ourselves. A mega retail can sell a bicycle, but it takes a trained service technician to keep it in fine running order. University Cycle Works staff provides the kind of personal, professional service people want, and are willing to pay for. We base our shop time fees on an industry standard, which we then adjust for our target market. This shop rate is comparable to other specialty bicycle shops in Metroburg.
Our location is a competitive advantage for us. Our customer base is predominantly university students and staff. We are almost part of the campus. They walk and ride past us every day, often several times. The convenience of local sales and service brings our customers in. They know they can get the service they need by dropping their bike off on the way to campus and picking it up on their way home: fast, convenient, reliable service.
3.2 Fulfillment
There are three mainstream bike lines and three specialty brands carried at University Cycle Works.
- Specialized–Widely recognized national brand, full line of road, mountain, and cruiser bikes. Price ranges meet everyone’s budget. Substantial national marketing programs, as well as local co-op advertising.
- Kona–Technology heavy mountain bike line, with features for the serious off-road cyclist. The bike nob is drawn to this line for its cache, light weight, high-end component gruppos. Priced upward accordingly.
- Raleigh/Diamondback–Great value for the price. No glitz or heavy marketing. Some name recognition.
- Terry Precision Bicycles–Designed and manufactured by and for women. Price varies by model.
- Litespeed Titanium–Serious top-of-the-line bicycles of unique materials and the very best components for road racers, tourists, and mountain bikers who will spend whatever they need to get the performance enhancing machine they want.
- Via Porco (Road Hog)–Custom sizes and framesets, fillet brazed by a local frame builder, for cyclists looking for the perfect fit and a long-term investment.
Parts for the repair and maintenance of bicycles are available from a variety of suppliers. Four that we regularly order from are listed here.
-
Quality Bicycle Products
-
Trek Bicycle Corporation
-
United Bicycle Parts
-
United Bicycle Tools–a supplier of specialty tools for the bicycle industry. They sell shop grade tools, and consumer grade tools for retail sales by bike shops.
Accessories are a huge part of the retail sales in the bike industry. Everything from helmets to headlights, panniers to computer speedometers, water bottles to locks and cables. Three of the largest suppliers are listed here.
-
Bell Sports
-
Specialized Bicycle Components
-
Trek Bicycle Corporation
Bicycling clothing can be either technology-oriented or simple. Anything from cotton cargo shorts to gel padded, multi-panel cycling shorts is acceptable for cycling. T-shirts and moisture wicking nano-fiber jerseys ride side by side, and when the weather turns inclement, there are nylon shells, plastic ponchos, and Gore-Tex jackets, pants, gloves, and shoe covers for the commuter who needs dry office attire, or the continental tourist who needs thousand-mile protection. University Cycle Works regularly stocks these brands. We also regularly purchase small lots of other brands to test their popularity in our market.
- Burley Design
- Pearl Izumi
- Sierra Designs
- Trek Bicycle Corporation
3.3 Future Products and Services
The bicycle industry is a mix of old and new technologies. Frame sets are made of various lightweight materials: T-6 aluminum, 4130 chromium-molybdenum steel, titanium, and/or carbon fiber matrix mixes. And yet the drive train is still a linked chain moving over cog gears, on axles supported by ball bearings.
Wheels can be anything from wire spokes to aerodynamic discs. Clothes range from high-tech moisture wicking synthetic fiber jerseys and Gore-Tex rainwear to traditional wool or cotton shorts.
Each year the major component companies such as Shimano, Mavic, and Campagnolo introduce new parts gruppos. The marketing has become as strident as that of the automobile industry. This means that the bike shop must maintain replacement parts to repair old groups, stock parts for early replacements of new models, and have an inventory of high priced gruppos for the equipment-focused bike nobs who want to upgrade their bikes with the newest and greatest. Additionally, the shop must regularly order manuals and specialty tools to service the new bikes and components.
Following the trends in technology and futuristic products is as much fun as it is work for Hub and his staff. They work on bicycles because they love bicycling.
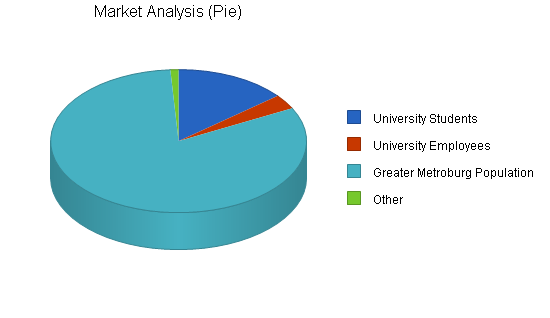
Market Analysis Summary
The predominant market segment for University Cycle Works is the university student population. We also cater to the university staff, local business employees, and, along with every other bicycle shop in town, the greater Metroburg population.
In part the local market is driven by the lack of parking. Bicycle transportation is more economical, as well as time and space efficient in the university neighborhood. Part of the market is price constrained and another part is hooked on the latest fad, be it frame style, number of gears, or portrayed image. As long as new students arrive each year at the State University at Metroburg, our market segment growth is assured.
4.1 Market Segmentation
The university students are our main target market.
- They are mostly undergraduates, so there is a 25% annual turnover.
- The lack of parking in the university area and the general ease of bike mobility throughout Metroburg motivates them to use bicycles as inexpensive transport. Athletic pursuits draw them, and the nearby areas for use of mountain and trail bikes provides a great place to ride.
- There is a new enthusiasm for retro Cruiser bikes, and higher tech cruiser-style bikes with multiple gears, good brakes, etc. among the college age population.
- Also, main market for racks, locks, throughout, pannier/bags, fenders, rainwear, etc.
- They want convenience for sales and service.
University employees are another prime market segment.
- Small growth and turnover, but on the whole, the group is pretty stable.
- Are willing to commute by bicycle to work.
- They want a stable, comfortable bike and a full range of accessories.
- When their bikes need service and maintenance, local drop off/pickup convenience is important.
- They have families who ride bicycles also, and will patronize a shop that gives personal service.
Greater Metroburg population.
This segment has a choice of going to any bike shop in Metroburg, and will probably choose a shop located closer to their home. They are not the main target market segment of University Cycle Works, and we market to them casually, only as a collateral effect to our university-oriented efforts.
| Market Analysis | |||||||
| Year 1 | Year 2 | Year 3 | Year 4 | Year 5 | |||
| Potential Customers | Growth | CAGR | |||||
| University Students | 4% | 27,500 | 28,600 | 29,744 | 30,934 | 32,171 | 4.00% |
| University Employees | 1% | 6,500 | 6,533 | 6,566 | 6,599 | 6,632 | 0.50% |
| Greater Metroburg Population | 2% | 160,000 | 163,200 | 166,464 | 169,793 | 173,189 | 2.00% |
| Other | 0% | 2,000 | 2,000 | 2,000 | 2,000 | 2,000 | 0.00% |
| Total | 2.22% | 196,000 | 200,333 | 204,774 | 209,326 | 213,992 | 2.22% |
4.2 Target Market Segment Strategy
We’ve chosen our target market segments, the greater university population because:
- They are contained in one area with a high daily population density.
- Are easily reached with advertising, such as outdoor displays on main street next to campus.
- Have discretionary income.
- They have a regular turnover of population/influx of new potential customers.
- Are, in general, athletically/physically active, and often performance oriented.
- In need of quick, efficient, maneuverable, alternative transportation.
- Like toys, especially expensive toys.
- Are image and brand conscious.
- Respond to convenience, especially highly visible, easy access convenience, with impulsive purchases.
4.2.1 Market Trends
Trends in the bicycle industry usually last for a time. Some of them have been:
- 1960s – Big rush on 10 speeds.
- 1970s – Touring bikes became popular.
- 1980s and 1990s – Huge growth of mountain bikes
- 1990s – The rumored but exaggerated death of “road bikes” and the unfulfilled prophesy of a boom in the tandem market.
- 2000s – Popularity of retro ‘cruisers.’
4.2.2 Market Growth
The bulk of University Cycle Works’ market growth is the regular matriculation of students from the State University in Metroburg. While the overall market numbers change in small increments, usually less than 10%, the market has a turnover of 22-26% yearly. In a longer time frame the number of students and the number of university employees grows and shrinks with economic changes, and with population demographics.
For the next three years we foresee a slow but steady growth in the overall university population as well as continued growth of Metroburg as a desirable place to live.
4.2.3 Market Needs
Our market niche has several needs which we strive to meet:
- Quality bikes at several price points.
- Various styles and sizes of bikes, leaning heavily toward the styles most popular with the student population.
- Range of accessories most practical in the local setting, such as locks, fenders, lights, tires, seats, rainwear, etc.
- Plenty of replacement components and service parts.
- Friendly personal relationships between cyclists and shop staff.
- Prompt and convenient service from on-the-spot flat tire fix, to drop in repairs, to scheduled major maintenance, where the rider can drop their bike off, head to class or work, and be assured that their bike will be ready for the ride home.
4.3 Service Business Analysis
The bicycle industry is a world wide concern. The Pacific Rim is a huge producer of framesets, components, tires, and accessories. European countries have a long and honored tradition of producing the finest in road touring and racing bikes and parts. The United States has probably the largest number of producers of high-tech, exotic metal, jewelry components, and handbuilt custom framesets.
Transportation of all these various pieces and fully assembled bikes across continents and oceans brings the industry its international flavor. It also adds a certain cost all products. Interestingly enough, some of the least expensive bicycles are imported from the People’s Republic of China, and some of the most outrageously expensive pieces are made in the U.S. and are handbuilt at a small shop that uses CNC machining to make titanium bolt, nut, and screw sets for the bike nob who wants to reduce the weight of his bike that last 143 grams.
4.3.1 Main Competitors
Setting aside the discount department stores, University Cycle Works has the following direct competitors.
- 1 local multi-sport store at the local megamall
- 1 statewide chain of bicycle shops which started out as Schwinn-only shops, but has had to take on other brands and products.
- 1 used bike store that has made a fine business reputation for itself, dealing strictly in used bikes.
- 3 local, including the oldest shop in town.
- 1 local multi-location chain, that has specialized in opening shops in small local malls in areas of new housing development.
- Several garage mechanics offering service only.
None of these competitors is within two miles of the university, and so, for the present, we have first access to our chosen market segments. One of the local shops has chosen to target the burgeoning young road racer segment, another is focusing on recumbents and folding travel cycles.
The two strongest competitors are the Oldest Shop in Town which carries the cache of being the most stable, and most well known — a Metroburg institution. The Mountain Bike Specialist targets the same athletic, young, performance and image conscious rider that we target in the university student population. These cyclists are particular about their bike and will go where the name brand they want is sold, or will try every bike and then buy the one that fits best, regardless of store loyalty.
4.3.2 Business Participants
The bicycle industry has many players large and small all over the world. A few are listed below.
Big bicycle manufactures
- Giant – one of the largest manufacturers in China. Private label manufacturer that sells under its own name.
- Huffy – The largest manufacturer and seller of bikes in the U.S. under its own private labels.
- Cannondale – U.S. company that was in early on the “Made in USA” movement in the 1970s.
- Trek – Heavily marketed U.S. company that has expanded to offer bikes, clothes, accessories, road support for events, training for shops, and other services.
Big component manufacturers
- Shimano – largest manufacturer of cranksets, derailleurs, drive trains, brake sets, hubs. HQ in Japan with offices, distribution, and factories world wide.
- Campagnolo – Premier Italian producer of the finest component gruppos for almost 100 years.
Big accessory distributors
- Specialized
- Bell Sports
- Quality Bike Parts
Mail order/Online companies who began selling through the mail and now have extensive Web presence as well. They offer great prices, but no installation or services.
- Performance
- Bike Nashbar
- REI
Discount stores are the usual outlet for Huffy bikes in several guises. These are the $100 bikes which are assembled by minimally trained clerks, and frequently end up at specialty shops being reassembled and serviced for the owners. The price bargain usually isn’t by the time the bike rides well and safely.
- Wal-Mart
- K-Mart
- GI Joe’s
Specialty bike store such as University Cycle Works, where bicycles are our focus and passion. Trained and knowledgeable sales people, service techs, and avid riders in their own right.
Custom frame builders, smaller specialized manufacturers of folding bikes, tandems, trailers, racing bikes, and custom components.
Strategy and Implementation Summary
Information on our sales and marketing efforts are discussed in the following sections.
5.1 Competitive Edge
The foremost competitive advantage of University Cycle Works is our university location. The State University at Metroburg is over 100 years old and as it has grown, Metroburg has grown around it. Parking is almost nonexistent, with all campus parking permit or meter controlled, and local streets filled to capacity with the vehicles of residents. Bicycles are an obvious and popular transportation solution.
Our location, in the first block off campus in a commercial area featuring the university Bookstore, a private bookstore, bank, cafes, coffee shops and popular watering holes is ideal. We get constant, daily visual exposure. Students and staff throng the sidewalk outside our door, and we reap the benefits. Our nearest competitor is almost a mile away. For the student customer, on foot, in a hurry, University Cycle Works is the immediate solution to their needs.
After that first parking ticket, we are the first bike shop the new pedestrian sees. We are conveniently located when a cyclist gets a flat tire on the way to class. The first time a rider gets to class with a wet back they come in at lunch for a set of fenders and a rain jacket.
The negotiations of the past two years also brings the advantage of continued financial agreements with major suppliers. This is an advantage over a start-up bicycle shop, but, is more a leveling of the bike path when compared to other established shop in Metroburg. Traditionally a start-up store will be placed on a Cash On Delivery (COD) status by bicycle manufacturers and parts/accessories suppliers. The COD status stays in effect until the new shop demonstrates its ability to manage its orders and cash flow. This also means the new shop must have more funding to be able to write checks on a moments notice, for large amounts.
University Cycle Works will be continuing an established system of dating programs, ordering, delivery, and invoicing/accounts payable, stabilizing our funding needs and monthly cash flow.
5.2 Marketing Strategy
Our marketing strategy seeks to optimize our advantage of prime location. We want the university population to see us as their bike shop, even our name says so, University Cycle Works. We want them to see us as part of their daily experience, and a shop they can depend on for quick repair and maintenance service.
5.2.1 Marketing Programs
Our marketing programs are locally focused, where we can effect our main target market.
Back to school specials, at the beginning of each term, including perhaps a free Kryptonite lock with a new bike purchase. We will try to have a special purchase of an economy value bike for each term.
Spring special. This coincides with the beginning of spring term, but we will direct some of our advertising at the wider population as people hang up their skis and tune up their bikes.
Coupons. Once every other month we will run a coupon for a service special in the university newspaper, the Daily Hyperbole. We also run this coupon as a banner ad in the Daily Hyperbole Online.
Website. Our content site will also serve as a marketing medium. We offer downloadable maps of the city bike routes, maps of rides outside the city area, give information about the store, and announce sales. We believe that cyclists will regularly access our site for the valuable information we will provide, and this will reinforce their of awareness of University Cycle Works, and we will become their bike shop of choice.
Print advertising. In addition to our coupons, we will keep a small 3 column inch ad appearing on a recurring schedule in the Daily Hyperbole. To boost citywide awareness of our sales specials we will also run slightly larger ads in the Metroburg Bombast-Obfuscator during the weekends prior to the sale.
5.2.2 Web Plan Summary
University Cycle Works’ website is designed to be a content site. We have neither the desire nor the time to attempt a full-blown e-commerce site. There are several large mail order/e-commerce companies, such as Performance, Bike Nashbar, and REI, and many smaller companies who are well established in the marketplace. We could never compete successfully against them.
Our target markets are immediate. They are within cycling and walking distance of us, so we are providing locally topical information to them. We are using HooDaThunkIt Search Engine Consultants for the design and upkeep of our site, and especially for their expertise in gaining favorable listings of our website in the Internet search engines. Just putting up a website is not enough. Without the proper coding and search engine linking, a website will never appear in a Yahoo! or Hotbot search. We don’t have the money to buy our way to a top three listing on every search, but HooDaThunkIt can get us into the search engines, and appearing higher than our local competitors.
First, we will have our store information: hours, location, phone number, brands sold, etc. Sales and current promotions will also be featured.
Resources
Downloadable files:
- University bike paths, parking areas and campus bike rules, provided by the University Security Office.
- Metroburg city bike path map.
- DMV/Statutes synopsis of rules of the road for bicyclists.
- University bike map and rules.
- Monthly maps and directions for both a road and a mountain bike ride.
Links:
- University Security Office-Bicycle information
- Metroburg Parks Department-Bicycle information
- Department of Motor Vehicles/State Laws about bicycles on the public roads.
- National Forest Bike Trails
- Bureau of Land Management Bike Trails
- Bicycling Magazines
5.2.3 Pricing Strategy
Retail
Pricing of bicycles is very tight with a markup of between 30% and 40% depending upon the brand and model. Many people believe that bicycles are priced like automobiles and are open for negotiation, and make almost insulting offers. The shops have little leeway here.
Parts and accessories are generally keystone priced. Some small items cost more in handling and sales than they do to buy from supplier. These can be double and triple keystoned, because customers won’t buy them if they don’t have a minimum perceived value. On the plus side, these are great “throw-in” items used to close the sale of a bike. When new technology arrives in bicycles, and if the supply is limited, almost any price can be demanded. This was the case in the mid-1990s when RockShox introduced suspension forks for mountain bikes. The bike nobs would pay whatever was asked just to get those forks. Of course, in this type of situation the price, both wholesale and retail, lowers.
Other accessories, such as step-in pedals, pannier racks, helmets, or headlights are sometimes heavily marketed by the manufacturers. While this drives demand and brings people into the shop to get these items, the suggested manufacturer’s retail price may limit markup.
The markup on clothes, shoes, jackets, gloves can vary from keystone to triple keystone, depending upon product, manufacturer, country of origin, and customer perception of value. Pearl Izumi and Burley Design rainwear can demand premium prices as top-of-the-line garments, but many budget conscious students can only afford a $35 nylon windbreaker. It has been and always will be a demanding job for us to adequately stock garments at the various price points.
Service
We try to maintain a basic “Hourly shop rate” at $45/hour. Standard repairs are then priced based upon an average time for completion. Some repairs, such as a flat tire, are limited by customer perception of difficulty. Examples:
- Flat Tire — $7.50
- Install Fenders — $10.00
- Brake Adjustment — $25.00
- Tune-up — $65.00
- Overhaul — $100.00
All parts used in repairs are priced at keystone, and added to the labor service charge.
With several other bicycle shops in the city, there are some price constraints based on competition. Coupons and specials can balance price ceilings by drawing in customers.
5.3 Sales Strategy
Sales vary season to season and with the academic school year. Surprisingly, summer is the slowest season because there are fewer students in town. Business picks up in August with the return of the students and staff, and flourishes in September. Accessories and rainwear sales increase in the autumn and early winter. Repairs and maintenance are steady. Holiday sales are brisk, though generally leaning again to accessories, parts, rainwear, gloves, helmets, headlights, etc. Winter sales are moderate, and then pick up in springtime as people put away their skies and look forward to local outdoor activities, longer daylight hours, and drier weather.
We have three large sales promotions each year.
- Back to school in August/September. This is our biggest sale of the year. New bicycles, locks, helmets, racks, fenders, backpacks. We always search for a special purchase of good quality, but value priced bikes for this sale such as year end models, slow sellers, new line looks to break into the market. These bikes will almost always sell out to students seeking great values.
- Year-end holidays. This also overlaps the beginning of Winter term. The retail market demands some participation in this annual buying frenzy, yet, this sale produces lower revenue than our other two events. We sell fewer bikes, and more accessories and clothing.
- Spring. This coincides with both the return of nice weather, and beginning of Spring term. We feature new bicycles, and repair/maintenance/tune-up specials. It is important to us to have a good selection on hand at this time. When people decide they want that new bike, they want it now. If we don’t have the bike then, and make the sale immediately, many riders will decide that they really can get another season out of their old bike, and will spend their discretionary income on some other purchase.
Additionally, we have some special buys available for June graduation.
We get some small monthly revenue from these sources:
- Sale of used bicycles taken in on trade.
- Repair classes taught at the University Outdoor Center, once a term.
- Monthly service contract for repairs and parts with the University Security Office.
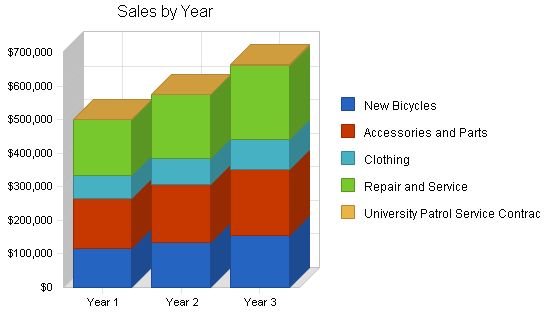
| Sales Forecast | |||
| Year 1 | Year 2 | Year 3 | |
| Sales | |||
| New Bicycles | $116,000 | $133,400 | $153,410 |
| Accessories and Parts | $150,000 | $172,500 | $198,375 |
| Clothing | $68,000 | $78,200 | $89,930 |
| Repair and Service | $166,000 | $190,900 | $219,535 |
| University Patrol Service Contract | $1,200 | $1,380 | $1,587 |
| Total Sales | $501,200 | $576,380 | $662,837 |
| Direct Cost of Sales | Year 1 | Year 2 | Year 3 |
| New Bicycles | $78,880 | $90,712 | $104,319 |
| Accessories and Parts | $75,000 | $86,250 | $99,188 |
| Clothing | $23,800 | $27,370 | $31,476 |
| Repair and Service | $0 | $0 | $0 |
| University Patrol Service Contract | $0 | $0 | $0 |
| Subtotal Direct Cost of Sales | $177,680 | $204,332 | $234,982 |
5.4 Strategic Alliances
- Bicycle manufacturers – continuation of dating programs and financial agreements.
- Accessory suppliers – continuation of financial agreements.
- Metroburg Parks Dept. – we sponsor printed map of city bike paths to publish on our website.
- University Security Office – maintenance, supply service contract for cycle security.
- HooDaThunkIt – website design and maintenance, search engine placement.
Management Summary
The current assistant manager, Hub Freewheeler, is buying University Cycle Works, and will manage the business. Hub has a B.S. degree in Economics and an M.A. in Comparative Literature. His passion however has always been cycling. He originally worked at his local bike shop when he was in college. After several years trying to find suitable work in his degree field, Hub gave up chasing the chimera of these fields and decided to work with something substantial, and returned to his youthful enjoyment of bicycles.
He attended two of the major bicycle mechanic training programs, at New England Bicycle Academy and the United Bicycle Institute. These courses covered mechanical service and maintenance, frame building and repair, wheel building, and shop organization, sales, and management. He has 12 years of progressively responsible experience in bicycle shops with the last five at University Cycle Works.
One of the other full-time employees, Vel O’Cipede has expressed interest in learning more about the bike industry and she will be promoted to be the new assistant manager. Vel has been with us for three years. She graduated from State University at Metroburg with tandem B.S. degrees in Exercise Physiology and Recreation Management. She loves to cycle, and has kept her contacts at the university active. Her knowledge and expertise draws many women bicyclists to our store where they know they will get the care and attention which is usually missing from traditionally male staffed shops.
The current owner, Han Delbar will be available as a resource.
Additional resources are:
- Order Out of Chaos, our full-cycle bookkeeping service.
- Continental Shelf Bank.
- Newt Ria, a partner at Weasel, Stoat, Muskrat who advised on the sale/purchase arrangements.
6.1 Personnel Plan
The staff will consist of Hub Freewheeler, the new assistant manager, Vel O’Cipede, and two other full-time employees Dee Raylure, and Jean-Baptiste Kapsyze.
To meet the need for additional help during the year, University Cycle Works hires two to four part-time employees from the university population. We look for people who are enthusiastic about cycling, and who have a mechanical aptitude. Some of these folks have worked for us throughout their entire college sojourn. Their hours vary depending on the stores’ needs and their class schedules.
| Personnel Plan | |||
| Year 1 | Year 2 | Year 3 | |
| Hub Freewheeler | $34,800 | $36,540 | $60,000 |
| Vel O’Cipede | $27,000 | $28,350 | $30,000 |
| Dee Raylure | $23,400 | $24,570 | $25,799 |
| Jean-Baptiste Kapsyze | $19,800 | $20,790 | $21,830 |
| Part-time Employees | $18,900 | $25,200 | $25,200 |
| Total People | 5 | 7 | 7 |
| Total Payroll | $123,900 | $135,450 | $162,828 |
Financial Plan
This financial plan was developed based upon previous years’ data for the existing store, tracking trends in revenues and expenses. A five-month track of sales, accounts receivables and payables, and inventory from a year-end benchmark was made.
The seller, buyer, and the accountant worked together on the plan to balance optimism with reality.
An attorney was consulted on specifics of the sale contract.
The topics which follow present specific projections.
7.1 Important Assumptions
Payment days are averaged at 45. This is an average figure used for planning purposes. Bicycle manufacturers and some accessories suppliers offer dating programs where shops order product at the annual trade show in September for delivery in February or March so that new product will be available to customers at the beginning of the cycling season. Shops are invoiced for payment due, depending upon the program, somewhere between May and July.
The financial projections presented here are based on the assumption that suppliers will continue their current invoicing programs with University Cycle Works. We are thankful for the active support and advocacy of the various sales representatives who deal with us.
Other products are ordered on a monthly basis to replace items sold, such as tires, tubes, aptitude and cages, ball bearings, drive chains, etc. These are invoiced at net 30. Some special orders are C.O.D.
We also assume that:
- Interest rates will fluctuate only slightly.
- The level of discretionary income will remain steady or increase.
- The current enrollment at the university will continue at or above its current level.
- That the lack of auto parking in the university area will continue.
- That gasoline prices will continue to encourage alternative transportation, e.g. bicycle commuting.
- World trade treaties will continue to allow shipping of material and product across all borders, continents and oceans.
| General Assumptions | |||
| Year 1 | Year 2 | Year 3 | |
| Plan Month | 1 | 2 | 3 |
| Current Interest Rate | 10.00% | 10.00% | 10.00% |
| Long-term Interest Rate | 7.00% | 7.00% | 7.00% |
| Tax Rate | 25.42% | 25.00% | 25.42% |
| Other | 0 | 0 | 0 |
7.2 Key Financial Indicators
The following chart compares five key indicators as they change over time. The indicators include sales, gross margin, operating expenses, inventory turnover, and collection days. The chart uses indicator values that are set to compare changes with the base year showing up as 1.00 and all other years showing up as multiples from the base.

7.3 Break-even Analysis
The Average Percent Variable Cost and Estimated Monthly Fixed Cost figures in the break-even table and chart below are drawn from data in the Profit and Loss and Sales Forecast tables. The table and chart give us a rough estimate on how much product and service we need to sell each month to cover all our expenses.

| Break-even Analysis | |
| Monthly Revenue Break-even | $37,354 |
| Assumptions: | |
| Average Percent Variable Cost | 35% |
| Estimated Monthly Fixed Cost | $24,112 |
7.4 Projected Profit and Loss
In negotiating the smooth transition in ownership, the landlord agreed with Hub to continue the current lease unchanged. As surety, one month’s rent was required as a deposit at the time of sale. This is shown in the Start-up table. Further, the landlord agreed that if, after 11 months operation the new company was solvent and current in lease payments, that the deposit could be applied to the twelfth month’s rent.
The mid-summer months of July and August are slow months when a large part of the university population is gone on summer break. The mid-winter months are traditionally loss months. The weather is the most inclement and discretionary income is at its lowest after the holiday binges. However, we try to keep our entire staff on board to work on our own inventory, store refurbishing, and staff training.


| Pro Forma Profit and Loss | |||
| Year 1 | Year 2 | Year 3 | |
| Sales | $501,200 | $576,380 | $662,837 |
| Direct Cost of Sales | $177,680 | $204,332 | $234,982 |
| Other | $0 | $0 | $0 |
| Total Cost of Sales | $177,680 | $204,332 | $234,982 |
| Gross Margin | $323,520 | $372,048 | $427,855 |
| Gross Margin % | 64.55% | 64.55% | 64.55% |
| Expenses | |||
| Payroll | $123,900 | $135,450 | $162,828 |
| Sales and Marketing and Other Expenses | $24,866 | $27,420 | $30,521 |
| Depreciation | $12,000 | $13,500 | $15,000 |
| Leased Equipment | $1,800 | $1,800 | $1,800 |
| Utilities | $3,600 | $3,600 | $3,780 |
| Insurance | $4,200 | $4,500 | $4,725 |
| Rent | $88,000 | $88,000 | $88,000 |
| Payroll Taxes | $30,975 | $33,863 | $40,707 |
| Other | $0 | $0 | $0 |
| Total Operating Expenses | $289,341 | $308,132 | $347,361 |
| Profit Before Interest and Taxes | $34,179 | $63,916 | $80,494 |
| EBITDA | $46,179 | $77,416 | $95,494 |
| Interest Expense | $8,433 | $6,730 | $5,040 |
| Taxes Incurred | $6,445 | $14,296 | $19,178 |
| Net Profit | $19,302 | $42,889 | $56,276 |
| Net Profit/Sales | 3.85% | 7.44% | 8.49% |
7.5 Projected Cash Flow
The Cash Flow chart and table reflect the seasonality of bicycle sales and the varying payment programs. At times, the business is inventory heavy, stocking up for the beginning of school rush, or specific sales. At other times, there is substantial negative cash flow as long-term accounts payable, net 90, net 60 payments coincide with regular net 30 invoices.

| Pro Forma Cash Flow | |||
| Year 1 | Year 2 | Year 3 | |
| Cash Received | |||
| Cash from Operations | |||
| Cash Sales | $501,200 | $576,380 | $662,837 |
| Subtotal Cash from Operations | $501,200 | $576,380 | $662,837 |
| Additional Cash Received | |||
| Sales Tax, VAT, HST/GST Received | $0 | $0 | $0 |
| New Current Borrowing | $0 | $0 | $0 |
| New Other Liabilities (interest-free) | $0 | $0 | $0 |
| New Long-term Liabilities | $0 | $0 | $0 |
| Sales of Other Current Assets | $8,000 | $0 | $0 |
| Sales of Long-term Assets | $0 | $0 | $0 |
| New Investment Received | $0 | $0 | $0 |
| Subtotal Cash Received | $509,200 | $576,380 | $662,837 |
| Expenditures | Year 1 | Year 2 | Year 3 |
| Expenditures from Operations | |||
| Cash Spending | $123,900 | $135,450 | $162,828 |
| Bill Payments | $335,368 | $377,512 | $426,127 |
| Subtotal Spent on Operations | $459,268 | $512,962 | $588,955 |
| Additional Cash Spent | |||
| Sales Tax, VAT, HST/GST Paid Out | $0 | $0 | $0 |
| Principal Repayment of Current Borrowing | $1,800 | $200 | $0 |
| Other Liabilities Principal Repayment | $10,000 | $0 | $0 |
| Long-term Liabilities Principal Repayment | $22,000 | $24,000 | $24,000 |
| Purchase Other Current Assets | $0 | $0 | $0 |
| Purchase Long-term Assets | $1,200 | $0 | $0 |
| Dividends | $0 | $0 | $0 |
| Subtotal Cash Spent | $494,268 | $537,162 | $612,955 |
| Net Cash Flow | $14,932 | $39,218 | $49,882 |
| Cash Balance | $109,932 | $149,150 | $199,033 |
7.6 Projected Balance Sheet
Our goal is to repay the loans from our family within the first year, and we project paying Han Delbar his entire purchase price within five years. Other balance sheet information is shown in the table below.
| Pro Forma Balance Sheet | |||
| Year 1 | Year 2 | Year 3 | |
| Assets | |||
| Current Assets | |||
| Cash | $109,932 | $149,150 | $199,033 |
| Inventory | $16,748 | $19,260 | $22,149 |
| Other Current Assets | $0 | $0 | $0 |
| Total Current Assets | $126,680 | $168,410 | $221,181 |
| Long-term Assets | |||
| Long-term Assets | $62,700 | $62,700 | $62,700 |
| Accumulated Depreciation | $12,000 | $25,500 | $40,500 |
| Total Long-term Assets | $50,700 | $37,200 | $22,200 |
| Total Assets | $177,380 | $205,610 | $243,381 |
| Liabilities and Capital | Year 1 | Year 2 | Year 3 |
| Current Liabilities | |||
| Accounts Payable | $38,178 | $47,719 | $53,214 |
| Current Borrowing | $200 | $0 | $0 |
| Other Current Liabilities | $0 | $0 | $0 |
| Subtotal Current Liabilities | $38,378 | $47,719 | $53,214 |
| Long-term Liabilities | $108,000 | $84,000 | $60,000 |
| Total Liabilities | $146,378 | $131,719 | $113,214 |
| Paid-in Capital | $25,000 | $25,000 | $25,000 |
| Retained Earnings | ($13,300) | $6,002 | $48,891 |
| Earnings | $19,302 | $42,889 | $56,276 |
| Total Capital | $31,002 | $73,891 | $130,167 |
| Total Liabilities and Capital | $177,380 | $205,610 | $243,381 |
| Net Worth | $31,002 | $73,891 | $130,167 |
7.7 Business Ratios
Business ratio analysis for our first three years appears in the table below. For comparison, industry standard ratios for Standard Industrial Classification (SIC) code 5941, Sporting Goods and Bicycle Shops, are presented as well.
| Ratio Analysis | ||||
| Year 1 | Year 2 | Year 3 | Industry Profile | |
| Sales Growth | 0.00% | 15.00% | 15.00% | 4.20% |
| Percent of Total Assets | ||||
| Inventory | 9.44% | 9.37% | 9.10% | 40.20% |
| Other Current Assets | 0.00% | 0.00% | 0.00% | 24.30% |
| Total Current Assets | 71.42% | 81.91% | 90.88% | 81.10% |
| Long-term Assets | 28.58% | 18.09% | 9.12% | 18.90% |
| Total Assets | 100.00% | 100.00% | 100.00% | 100.00% |
| Current Liabilities | 21.64% | 23.21% | 21.86% | 44.70% |
| Long-term Liabilities | 60.89% | 40.85% | 24.65% | 13.00% |
| Total Liabilities | 82.52% | 64.06% | 46.52% | 57.70% |
| Net Worth | 17.48% | 35.94% | 53.48% | 42.30% |
| Percent of Sales | ||||
| Sales | 100.00% | 100.00% | 100.00% | 100.00% |
| Gross Margin | 64.55% | 64.55% | 64.55% | 31.80% |
| Selling, General & Administrative Expenses | 60.70% | 57.11% | 56.01% | 19.00% |
| Advertising Expenses | 0.75% | 0.69% | 0.68% | 1.90% |
| Profit Before Interest and Taxes | 6.82% | 11.09% | 12.14% | 1.40% |
| Main Ratios | ||||
| Current | 3.30 | 3.53 | 4.16 | 1.97 |
| Quick | 2.86 | 3.13 | 3.74 | 0.75 |
| Total Debt to Total Assets | 82.52% | 64.06% | 46.52% | 57.70% |
| Pre-tax Return on Net Worth | 83.05% | 77.39% | 57.97% | 3.40% |
| Pre-tax Return on Assets | 14.51% | 27.81% | 31.00% | 8.20% |
| Additional Ratios | Year 1 | Year 2 | Year 3 | |
| Net Profit Margin | 3.85% | 7.44% | 8.49% | n.a |
| Return on Equity | 62.26% | 58.04% | 43.23% | n.a |
| Activity Ratios | ||||
| Inventory Turnover | 10.91 | 11.35 | 11.35 | n.a |
| Accounts Payable Turnover | 9.06 | 8.11 | 8.11 | n.a |
| Payment Days | 44 | 41 | 43 | n.a |
| Total Asset Turnover | 2.83 | 2.80 | 2.72 | n.a |
| Debt Ratios | ||||
| Debt to Net Worth | 4.72 | 1.78 | 0.87 | n.a |
| Current Liab. to Liab. | 0.26 | 0.36 | 0.47 | n.a |
| Liquidity Ratios | ||||
| Net Working Capital | $88,302 | $120,691 | $167,967 | n.a |
| Interest Coverage | 4.05 | 9.50 | 15.97 | n.a |
| Additional Ratios | ||||
| Assets to Sales | 0.35 | 0.36 | 0.37 | n.a |
| Current Debt/Total Assets | 22% | 23% | 22% | n.a |
| Acid Test | 2.86 | 3.13 | 3.74 | n.a |
| Sales/Net Worth | 16.17 | 7.80 | 5.09 | n.a |
| Dividend Payout | 0.00 | 0.00 | 0.00 | n.a |
Appendix
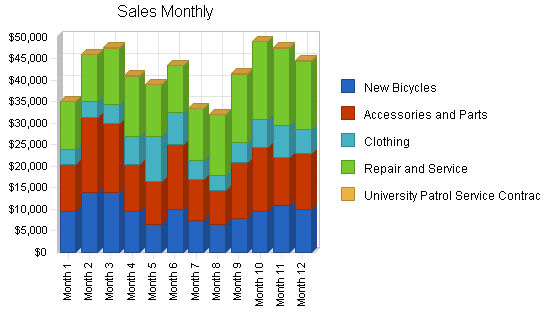
| Sales Forecast | |||||||||||||
| Month 1 | Month 2 | Month 3 | Month 4 | Month 5 | Month 6 | Month 7 | Month 8 | Month 9 | Month 10 | Month 11 | Month 12 | ||
| Sales | |||||||||||||
| New Bicycles | 0% | $9,500 | $14,000 | $14,000 | $9,500 | $6,500 | $10,000 | $7,500 | $6,500 | $8,000 | $9,500 | $11,000 | $10,000 |
| Accessories and Parts | 0% | $11,000 | $17,500 | $16,000 | $11,000 | $10,000 | $15,000 | $9,500 | $8,000 | $13,000 | $15,000 | $11,000 | $13,000 |
| Clothing | 0% | $3,500 | $3,500 | $4,500 | $6,500 | $10,500 | $7,500 | $4,500 | $3,500 | $4,500 | $6,500 | $7,500 | $5,500 |
| Repair and Service | 0% | $11,000 | $11,000 | $13,000 | $14,000 | $12,000 | $11,000 | $12,000 | $14,000 | $16,000 | $18,000 | $18,000 | $16,000 |
| University Patrol Service Contract | 0% | $100 | $100 | $100 | $100 | $100 | $100 | $100 | $100 | $100 | $100 | $100 | $100 |
| Total Sales | $35,100 | $46,100 | $47,600 | $41,100 | $39,100 | $43,600 | $33,600 | $32,100 | $41,600 | $49,100 | $47,600 | $44,600 | |
| Direct Cost of Sales | Month 1 | Month 2 | Month 3 | Month 4 | Month 5 | Month 6 | Month 7 | Month 8 | Month 9 | Month 10 | Month 11 | Month 12 | |
| New Bicycles | 68% | $6,460 | $9,520 | $9,520 | $6,460 | $4,420 | $6,800 | $5,100 | $4,420 | $5,440 | $6,460 | $7,480 | $6,800 |
| Accessories and Parts | 50% | $5,500 | $8,750 | $8,000 | $5,500 | $5,000 | $7,500 | $4,750 | $4,000 | $6,500 | $7,500 | $5,500 | $6,500 |
| Clothing | 35% | $1,225 | $1,225 | $1,575 | $2,275 | $3,675 | $2,625 | $1,575 | $1,225 | $1,575 | $2,275 | $2,625 | $1,925 |
| Repair and Service | $0 | $0 | $0 | $0 | $0 | $0 | $0 | $0 | $0 | $0 | $0 | $0 | |
| University Patrol Service Contract | $0 | $0 | $0 | $0 | $0 | $0 | $0 | $0 | $0 | $0 | $0 | $0 | |
| Subtotal Direct Cost of Sales | $13,185 | $19,495 | $19,095 | $14,235 | $13,095 | $16,925 | $11,425 | $9,645 | $13,515 | $16,235 | $15,605 | $15,225 | |
| Personnel Plan | |||||||||||||
| Month 1 | Month 2 | Month 3 | Month 4 | Month 5 | Month 6 | Month 7 | Month 8 | Month 9 | Month 10 | Month 11 | Month 12 | ||
| Hub Freewheeler | 0% | $1,800 | $3,000 | $3,000 | $3,000 | $3,000 | $3,000 | $3,000 | $3,000 | $3,000 | $3,000 | $3,000 | $3,000 |
| Vel O’Cipede | 0% | $2,250 | $2,250 | $2,250 | $2,250 | $2,250 | $2,250 | $2,250 | $2,250 | $2,250 | $2,250 | $2,250 | $2,250 |
| Dee Raylure | 0% | $1,950 | $1,950 | $1,950 | $1,950 | $1,950 | $1,950 | $1,950 | $1,950 | $1,950 | $1,950 | $1,950 | $1,950 |
| Jean-Baptiste Kapsyze | 0% | $1,650 | $1,650 | $1,650 | $1,650 | $1,650 | $1,650 | $1,650 | $1,650 | $1,650 | $1,650 | $1,650 | $1,650 |
| Part-time Employees | 0% | $0 | $700 | $1,400 | $2,100 | $2,100 | $2,100 | $2,100 | $2,100 | $2,100 | $2,100 | $1,400 | $700 |
| Total People | 4 | 5 | 6 | 7 | 7 | 7 | 7 | 7 | 7 | 7 | 6 | 5 | |
| Total Payroll | $7,650 | $9,550 | $10,250 | $10,950 | $10,950 | $10,950 | $10,950 | $10,950 | $10,950 | $10,950 | $10,250 | $9,550 | |
| General Assumptions | |||||||||||||
| Month 1 | Month 2 | Month 3 | Month 4 | Month 5 | Month 6 | Month 7 | Month 8 | Month 9 | Month 10 | Month 11 | Month 12 | ||
| Plan Month | 1 | 2 | 3 | 4 | 5 | 6 | 7 | 8 | 9 | 10 | 11 | 12 | |
| Current Interest Rate | 10.00% | 10.00% | 10.00% | 10.00% | 10.00% | 10.00% | 10.00% | 10.00% | 10.00% | 10.00% | 10.00% | 10.00% | |
| Long-term Interest Rate | 7.00% | 7.00% | 7.00% | 7.00% | 7.00% | 7.00% | 7.00% | 7.00% | 7.00% | 7.00% | 7.00% | 7.00% | |
| Tax Rate | 30.00% | 25.00% | 25.00% | 25.00% | 25.00% | 25.00% | 25.00% | 25.00% | 25.00% | 25.00% | 25.00% | 25.00% | |
| Other | 0 | 0 | 0 | 0 | 0 | 0 | 0 | 0 | 0 | 0 | 0 | 0 | |
| Pro Forma Profit and Loss | |||||||||||||
| Month 1 | Month 2 | Month 3 | Month 4 | Month 5 | Month 6 | Month 7 | Month 8 | Month 9 | Month 10 | Month 11 | Month 12 | ||
| Sales | $35,100 | $46,100 | $47,600 | $41,100 | $39,100 | $43,600 | $33,600 | $32,100 | $41,600 | $49,100 | $47,600 | $44,600 | |
| Direct Cost of Sales | $13,185 | $19,495 | $19,095 | $14,235 | $13,095 | $16,925 | $11,425 | $9,645 | $13,515 | $16,235 | $15,605 | $15,225 | |
| Other | $0 | $0 | $0 | $0 | $0 | $0 | $0 | $0 | $0 | $0 | $0 | $0 | |
| Total Cost of Sales | $13,185 | $19,495 | $19,095 | $14,235 | $13,095 | $16,925 | $11,425 | $9,645 | $13,515 | $16,235 | $15,605 | $15,225 | |
| Gross Margin | $21,915 | $26,605 | $28,505 | $26,865 | $26,005 | $26,675 | $22,175 | $22,455 | $28,085 | $32,865 | $31,995 | $29,375 | |
| Gross Margin % | 62.44% | 57.71% | 59.88% | 65.36% | 66.51% | 61.18% | 66.00% | 69.95% | 67.51% | 66.93% | 67.22% | 65.86% | |
| Expenses | |||||||||||||
| Payroll | $7,650 | $9,550 | $10,250 | $10,950 | $10,950 | $10,950 | $10,950 | $10,950 | $10,950 | $10,950 | $10,250 | $9,550 | |
| Sales and Marketing and Other Expenses | $1,618 | $2,073 | $4,268 | $1,798 | $1,738 | $1,998 | $1,698 | $1,528 | $1,813 | $2,313 | $1,993 | $2,028 | |
| Depreciation | $1,000 | $1,000 | $1,000 | $1,000 | $1,000 | $1,000 | $1,000 | $1,000 | $1,000 | $1,000 | $1,000 | $1,000 | |
| Leased Equipment | $150 | $150 | $150 | $150 | $150 | $150 | $150 | $150 | $150 | $150 | $150 | $150 | |
| Utilities | $300 | $300 | $300 | $300 | $300 | $300 | $300 | $300 | $300 | $300 | $300 | $300 | |
| Insurance | $350 | $350 | $350 | $350 | $350 | $350 | $350 | $350 | $350 | $350 | $350 | $350 | |
| Rent | $8,000 | $8,000 | $8,000 | $8,000 | $8,000 | $8,000 | $8,000 | $8,000 | $8,000 | $8,000 | $8,000 | $0 | |
| Payroll Taxes | 25% | $1,913 | $2,388 | $2,563 | $2,738 | $2,738 | $2,738 | $2,738 | $2,738 | $2,738 | $2,738 | $2,563 | $2,388 |
| Other | $0 | $0 | $0 | $0 | $0 | $0 | $0 | $0 | $0 | $0 | $0 | $0 | |
| Total Operating Expenses | $20,981 | $23,811 | $26,881 | $25,286 | $25,226 | $25,486 | $25,186 | $25,016 | $25,301 | $25,801 | $24,606 | $15,766 | |
| Profit Before Interest and Taxes | $935 | $2,795 | $1,625 | $1,580 | $780 | $1,190 | ($3,011) | ($2,561) | $2,785 | $7,065 | $7,390 | $13,610 | |
| EBITDA | $1,935 | $3,795 | $2,625 | $2,580 | $1,780 | $2,190 | ($2,011) | ($1,561) | $3,785 | $8,065 | $8,390 | $14,610 | |
| Interest Expense | $774 | $761 | $748 | $735 | $722 | $709 | $696 | $683 | $670 | $658 | $645 | $632 | |
| Taxes Incurred | $48 | $508 | $219 | $211 | $14 | $120 | ($927) | ($811) | $529 | $1,602 | $1,686 | $3,244 | |
| Net Profit | $113 | $1,525 | $657 | $633 | $43 | $360 | ($2,780) | ($2,433) | $1,586 | $4,805 | $5,059 | $9,733 | |
| Net Profit/Sales | 0.32% | 3.31% | 1.38% | 1.54% | 0.11% | 0.83% | -8.27% | -7.58% | 3.81% | 9.79% | 10.63% | 21.82% | |
| Pro Forma Cash Flow | |||||||||||||
| Month 1 | Month 2 | Month 3 | Month 4 | Month 5 | Month 6 | Month 7 | Month 8 | Month 9 | Month 10 | Month 11 | Month 12 | ||
| Cash Received | |||||||||||||
| Cash from Operations | |||||||||||||
| Cash Sales | $35,100 | $46,100 | $47,600 | $41,100 | $39,100 | $43,600 | $33,600 | $32,100 | $41,600 | $49,100 | $47,600 | $44,600 | |
| Subtotal Cash from Operations | $35,100 | $46,100 | $47,600 | $41,100 | $39,100 | $43,600 | $33,600 | $32,100 | $41,600 | $49,100 | $47,600 | $44,600 | |
| Additional Cash Received | |||||||||||||
| Sales Tax, VAT, HST/GST Received | 0.00% | $0 | $0 | $0 | $0 | $0 | $0 | $0 | $0 | $0 | $0 | $0 | $0 |
| New Current Borrowing | $0 | $0 | $0 | $0 | $0 | $0 | $0 | $0 | $0 | $0 | $0 | $0 | |
| New Other Liabilities (interest-free) | $0 | $0 | $0 | $0 | $0 | $0 | $0 | $0 | $0 | $0 | $0 | $0 | |
| New Long-term Liabilities | $0 | $0 | $0 | $0 | $0 | $0 | $0 | $0 | $0 | $0 | $0 | $0 | |
| Sales of Other Current Assets | $0 | $0 | $0 | $0 | $0 | $0 | $0 | $0 | $0 | $0 | $0 | $8,000 | |
| Sales of Long-term Assets | $0 | $0 | $0 | $0 | $0 | $0 | $0 | $0 | $0 | $0 | $0 | $0 | |
| New Investment Received | $0 | $0 | $0 | $0 | $0 | $0 | $0 | $0 | $0 | $0 | $0 | $0 | |
| Subtotal Cash Received | $35,100 | $46,100 | $47,600 | $41,100 | $39,100 | $43,600 | $33,600 | $32,100 | $41,600 | $49,100 | $47,600 | $52,600 | |
| Expenditures | Month 1 | Month 2 | Month 3 | Month 4 | Month 5 | Month 6 | Month 7 | Month 8 | Month 9 | Month 10 | Month 11 | Month 12 | |
| Expenditures from Operations | |||||||||||||
| Cash Spending | $7,650 | $9,550 | $10,250 | $10,950 | $10,950 | $10,950 | $10,950 | $10,950 | $10,950 | $10,950 | $10,250 | $9,550 | |
| Bill Payments | $18,533 | $18,893 | $36,063 | $37,919 | $28,809 | $24,601 | $31,000 | $26,371 | $19,577 | $26,863 | $33,930 | $32,810 | |
| Subtotal Spent on Operations | $26,183 | $28,443 | $46,313 | $48,869 | $39,759 | $35,551 | $41,950 | $37,321 | $30,527 | $37,813 | $44,180 | $42,360 | |
| Additional Cash Spent | |||||||||||||
| Sales Tax, VAT, HST/GST Paid Out | $0 | $0 | $0 | $0 | $0 | $0 | $0 | $0 | $0 | $0 | $0 | $0 | |
| Principal Repayment of Current Borrowing | $150 | $150 | $150 | $150 | $150 | $150 | $150 | $150 | $150 | $150 | $150 | $150 | |
| Other Liabilities Principal Repayment | $0 | $0 | $0 | $1,000 | $1,500 | $2,500 | $1,000 | $0 | $0 | $0 | $2,500 | $1,500 | |
| Long-term Liabilities Principal Repayment | $0 | $2,000 | $2,000 | $2,000 | $2,000 | $2,000 | $2,000 | $2,000 | $2,000 | $2,000 | $2,000 | $2,000 | |
| Purchase Other Current Assets | $0 | $0 | $0 | $0 | $0 | $0 | $0 | $0 | $0 | $0 | $0 | $0 | |
| Purchase Long-term Assets | $100 | $100 | $100 | $100 | $100 | $100 | $100 | $100 | $100 | $100 | $100 | $100 | |
| Dividends | $0 | $0 | $0 | $0 | $0 | $0 | $0 | $0 | $0 | $0 | $0 | $0 | |
| Subtotal Cash Spent | $26,433 | $30,693 | $48,563 | $52,119 | $43,509 | $40,301 | $45,200 | $39,571 | $32,777 | $40,063 | $48,930 | $46,110 | |
| Net Cash Flow | $8,667 | $15,407 | ($963) | ($11,019) | ($4,409) | $3,299 | ($11,600) | ($7,471) | $8,823 | $9,037 | ($1,330) | $6,490 | |
| Cash Balance | $103,667 | $119,074 | $118,111 | $107,092 | $102,683 | $105,982 | $94,382 | $86,912 | $95,734 | $104,771 | $103,442 | $109,932 | |
| Pro Forma Balance Sheet | |||||||||||||
| Month 1 | Month 2 | Month 3 | Month 4 | Month 5 | Month 6 | Month 7 | Month 8 | Month 9 | Month 10 | Month 11 | Month 12 | ||
| Assets | Starting Balances | ||||||||||||
| Current Assets | |||||||||||||
| Cash | $95,000 | $103,667 | $119,074 | $118,111 | $107,092 | $102,683 | $105,982 | $94,382 | $86,912 | $95,734 | $104,771 | $103,442 | $109,932 |
| Inventory | $17,000 | $14,504 | $21,445 | $21,005 | $15,659 | $14,405 | $18,618 | $12,568 | $10,610 | $14,867 | $17,859 | $17,166 | $16,748 |
| Other Current Assets | $8,000 | $8,000 | $8,000 | $8,000 | $8,000 | $8,000 | $8,000 | $8,000 | $8,000 | $8,000 | $8,000 | $8,000 | $0 |
| Total Current Assets | $120,000 | $126,170 | $148,518 | $147,115 | $130,750 | $125,088 | $132,599 | $114,950 | $105,521 | $118,601 | $130,630 | $128,607 | $126,680 |
| Long-term Assets | |||||||||||||
| Long-term Assets | $61,500 | $61,600 | $61,700 | $61,800 | $61,900 | $62,000 | $62,100 | $62,200 | $62,300 | $62,400 | $62,500 | $62,600 | $62,700 |
| Accumulated Depreciation | $0 | $1,000 | $2,000 | $3,000 | $4,000 | $5,000 | $6,000 | $7,000 | $8,000 | $9,000 | $10,000 | $11,000 | $12,000 |
| Total Long-term Assets | $61,500 | $60,600 | $59,700 | $58,800 | $57,900 | $57,000 | $56,100 | $55,200 | $54,300 | $53,400 | $52,500 | $51,600 | $50,700 |
| Total Assets | $181,500 | $186,770 | $208,218 | $205,915 | $188,650 | $182,088 | $188,699 | $170,150 | $159,821 | $172,001 | $183,130 | $180,207 | $177,380 |
| Liabilities and Capital | Month 1 | Month 2 | Month 3 | Month 4 | Month 5 | Month 6 | Month 7 | Month 8 | Month 9 | Month 10 | Month 11 | Month 12 | |
| Current Liabilities | |||||||||||||
| Accounts Payable | $27,800 | $33,108 | $55,180 | $54,370 | $39,622 | $36,666 | $47,567 | $34,948 | $29,202 | $41,946 | $50,420 | $47,089 | $38,178 |
| Current Borrowing | $2,000 | $1,850 | $1,700 | $1,550 | $1,400 | $1,250 | $1,100 | $950 | $800 | $650 | $500 | $350 | $200 |
| Other Current Liabilities | $10,000 | $10,000 | $10,000 | $10,000 | $9,000 | $7,500 | $5,000 | $4,000 | $4,000 | $4,000 | $4,000 | $1,500 | $0 |
| Subtotal Current Liabilities | $39,800 | $44,958 | $66,880 | $65,920 | $50,022 | $45,416 | $53,667 | $39,898 | $34,002 | $46,596 | $54,920 | $48,939 | $38,378 |
| Long-term Liabilities | $130,000 | $130,000 | $128,000 | $126,000 | $124,000 | $122,000 | $120,000 | $118,000 | $116,000 | $114,000 | $112,000 | $110,000 | $108,000 |
| Total Liabilities | $169,800 | $174,958 | $194,880 | $191,920 | $174,022 | $167,416 | $173,667 | $157,898 | $150,002 | $160,596 | $166,920 | $158,939 | $146,378 |
| Paid-in Capital | $25,000 | $25,000 | $25,000 | $25,000 | $25,000 | $25,000 | $25,000 | $25,000 | $25,000 | $25,000 | $25,000 | $25,000 | $25,000 |
| Retained Earnings | ($13,300) | ($13,300) | ($13,300) | ($13,300) | ($13,300) | ($13,300) | ($13,300) | ($13,300) | ($13,300) | ($13,300) | ($13,300) | ($13,300) | ($13,300) |
| Earnings | $0 | $113 | $1,638 | $2,295 | $2,929 | $2,972 | $3,332 | $552 | ($1,881) | ($295) | $4,510 | $9,568 | $19,302 |
| Total Capital | $11,700 | $11,813 | $13,338 | $13,995 | $14,629 | $14,672 | $15,032 | $12,252 | $9,819 | $11,405 | $16,210 | $21,268 | $31,002 |
| Total Liabilities and Capital | $181,500 | $186,770 | $208,218 | $205,915 | $188,650 | $182,088 | $188,699 | $170,150 | $159,821 | $172,001 | $183,130 | $180,207 | $177,380 |
| Net Worth | $11,700 | $11,813 | $13,338 | $13,995 | $14,629 | $14,672 | $15,032 | $12,252 | $9,819 | $11,405 | $16,210 | $21,268 | $31,002 |

