
Silver Bear Lodge
Executive Summary
The Silver Bear Lodge is located three blocks from Crest Lake Village, mid-mountain at Bear Valley Resort and on the free shuttle system. Located in the recently expanded Crest Canyon area, Silver Bear Lodge will offer customers 12 two-bedroom units with underground parking, fully-equipped kitchens, laundry facilities and stone fireplaces. Silver Bear Lodge also will offer a common-area outdoor hot tub as well as a on-site store and on-site front desk service.
Each year, over 150,000 skiers and nature lovers visit the Bear Valley Resort area. On average, visitors spend over $250 million, annually, for lodging, food, and recreational activities at Bear Valley Resort.
Marty Snyderman and Luke Roth, co-owners of the Silver Bear Lodge, will operate the lodge as a ski resort during the months of November to April. During the Spring and Summer months (May to August), the Silver Bear Lodge will operate as a summer resort. The lodge will be closed during the months of September and October.
1.1 Objectives
The objectives of the Silver Bear Lodge for the first three years of operation include:
- Exceeding customer’s expectations for luxury apres ski accommodations.
- Maintaining an 90% occupancy rate during the peak periods.
- Assembling an experienced and effective staff.
1.2 Mission
The mission of Silver Bear Lodge is to become the number one lodge of choice with visitors to Bear Valley Resort.
Company Summary
The Silver Bear Lodge, located in the recently opened Crest Canyon area, has 12 two-bedroom units with underground parking, fully-equipped kitchens, laundry facilities and stone fireplaces. Silver Bear Lodge also has a common-area outdoor hot tub as well as an on-site store and on-site front desk service.
2.1 Company Ownership
Marty Snyderman and Luke Roth are co-owners of the Silver Bear Lodge.
2.2 Start-up Summary
Marty Snyderman and Luke Roth will each invest $100,000. They will also secure a mortgage to purchase the property for $250,000 and an SBA loan for $100,000.

| Start-up Funding | |
| Start-up Expenses to Fund | $185,400 |
| Start-up Assets to Fund | $364,600 |
| Total Funding Required | $550,000 |
| Assets | |
| Non-cash Assets from Start-up | $350,000 |
| Cash Requirements from Start-up | $14,600 |
| Additional Cash Raised | $0 |
| Cash Balance on Starting Date | $14,600 |
| Total Assets | $364,600 |
| Liabilities and Capital | |
| Liabilities | |
| Current Borrowing | $0 |
| Long-term Liabilities | $350,000 |
| Accounts Payable (Outstanding Bills) | $0 |
| Other Current Liabilities (interest-free) | $0 |
| Total Liabilities | $350,000 |
| Capital | |
| Planned Investment | |
| Marty Snyderman | $100,000 |
| Luke Roth | $100,000 |
| Additional Investment Requirement | $0 |
| Total Planned Investment | $200,000 |
| Loss at Start-up (Start-up Expenses) | ($185,400) |
| Total Capital | $14,600 |
| Total Capital and Liabilities | $364,600 |
| Total Funding | $550,000 |
| Start-up | |
| Requirements | |
| Start-up Expenses | |
| Legal | $5,000 |
| Stationery etc. | $400 |
| Brochures | $6,000 |
| Rental Shop Setup | $50,000 |
| Property Downpayment | $50,000 |
| Lodge Setup | $20,000 |
| Store Setup | $50,000 |
| Insurance | $4,000 |
| Total Start-up Expenses | $185,400 |
| Start-up Assets | |
| Cash Required | $14,600 |
| Other Current Assets | $0 |
| Long-term Assets | $350,000 |
| Total Assets | $364,600 |
| Total Requirements | $550,000 |
2.3 Company Locations and Facilities
The charm and solitude of Bear Valley’s secluded mountain setting is found just 36 miles from the Richmond International Airport.
Products
Silver Bear Lodge will offer customers 12 two-bedroom units, fully-equipped kitchens, laundry facilities and stone fireplaces. Silver Bear Lodge will offer a common-area outdoor hot tub as well as the following services on-site:
- Food store
- Ski rental/clothing shop
- Front desk service
Market Analysis Summary
Resort hotel development and operation in the Bear Valley Resort area has been very profitable and successful due to the economic upturn experienced in the early and mid 90’s. Time-share / resort hotel development and investments into ski resorts nationwide are currently going strong. In the past two years, sales of time-shares in the Bear Valley Resort area have increased by over 35 percent. There are forty condominiums, lodges, inns and hotels within two miles of the resort. Each year, room occupancy is close to 100% during the peak skiing season. New construction is planned in the spring for two condo complexes and a hotel.
4.1 Market Segmentation
Our customers can be broadly divided into two groups:
- Skiers. The Bear Valley Resort area is quickly becoming one of the best ski resorts in the U.S. The resort is located 36 miles from Richmond International Airport and is easily accessible.
- Summer Visitors. During the summer months, the Bear Valley Resort area is a beautiful wilderness retreat with over 50 hiking trails and other outdoor recreational activities.

| Market Analysis | |||||||
| Year 1 | Year 2 | Year 3 | Year 4 | Year 5 | |||
| Potential Customers | Growth | CAGR | |||||
| Skiers | 15% | 90,000 | 103,500 | 119,025 | 136,879 | 157,411 | 15.00% |
| Summer Visitors | 15% | 60,000 | 69,000 | 79,350 | 91,253 | 104,941 | 15.00% |
| Total | 15.00% | 150,000 | 172,500 | 198,375 | 228,132 | 262,352 | 15.00% |
Strategy and Implementation Summary
Silver Bear Lodge will aggressively market to both winter and summer visitors of the Bear Valley Resort area. The Bear Valley Resort has activities occuring year round. During the winter there is skiing but in the summer months, the resort has hot-air balloon trips, white water adventures, day hikes into Bear Valley, and other recreational activities that take advantage of valley’s spectacular beauty.
There are only thirteen lodges and inns in the Bear Valley Resort. These facilities represent only 580 room units of the total of 4,000 room units in the resort area. The majority of room units in the area are condos.
Our customers are looking for a different lodging experience that cannot be found in any of the area’s condo complexes or hotels. We will offer our customers a comfortable, congenial environment that will assure return visits to the Silver Bear Lodge.
The lodge will cost a little more but we will offer our customers all the services they need to make their stay memorable. We will offer a food shop that will be able to take special orders daily. There will be a ski rental shop where customers can outfit themselves and purchase ski passes. Each evening, guests can gather in the lodge’s main room where there is a large fireplace, drinks and light music.
5.1 Competitive Edge
The competitive edge of Silver Bear Lodge is the service, first and foremost. Marty Snyderman and Luke Roth, co-owners of the Silver Bear Lodge, have over twenty years experience in managing ski lodging facilities.
Marty is the manager-owner of the Crest Lake Inn. He has owned the inn for ten years.
Luke recently was the manager of the Village Resort Hotel. He held that position for the last five years. Before this position, Luke was the manager of The Ridge, a 60 unit condo complex in Silver Lake Village.
Another significant advantage for the Silver Bear Lodge is its location. Being located in the recently opened Crest Canyon area, Silver Bear Lodge is uniquely positioned to be centrally located to both Crest Lake Village (.5 miles) and the Bear Valley Resort ski area (.5 miles).
5.2 Sales Strategy
The Silver Bear Lodge’s sales strategy is to harness the existing Bear Valley Resort booking system that has been critical to the success of all of the area’s lodges and inns. Room rates for the lodge will range from $150 – $250 per night in peak season. In the off season prices will range from $100 to $175 per night.
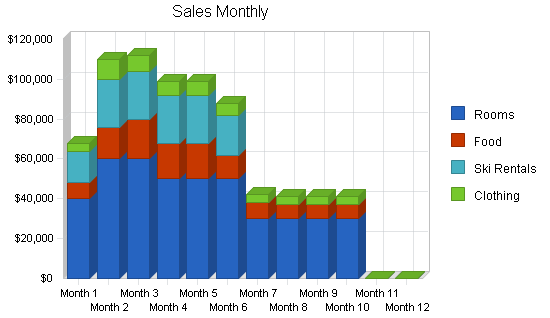
5.2.1 Sales Forecast
The following is the sales forecast for three years.
| Sales Forecast | |||
| Year 1 | Year 2 | Year 3 | |
| Sales | |||
| Rooms | $430,000 | $560,000 | $600,000 |
| Food | $121,000 | $140,000 | $180,000 |
| Ski Rentals | $132,000 | $145,000 | $160,000 |
| Clothing | $58,000 | $70,000 | $82,000 |
| Total Sales | $741,000 | $915,000 | $1,022,000 |
| Direct Cost of Sales | Year 1 | Year 2 | Year 3 |
| Rooms | $0 | $0 | $0 |
| Food | $59,500 | $71,000 | $90,000 |
| Ski Rentals | $0 | $0 | $0 |
| Clothing | $23,700 | $30,000 | $38,000 |
| Subtotal Direct Cost of Sales | $83,200 | $101,000 | $128,000 |

5.3 Marketing Strategy
The Bear Valley Resort area has its own website and advertising/promotion program that promotes the area’s lodging. Currently, 70% of the area’s visitors use the website to identify lodging and service options.
The Silver Bear Lodge is positioned as a new upscale facility that is focused on the high-income visitors to Bear Valley Resort. The area’s lodges and inns receive approximately 80% of their guests from the Bear Valley Resort booking system. Since the total number of room units are few with the area’s lodges and inns, these lodging units fill up quickly.
In addition, the Silver Bear Lodge will be highlighted in a promotional piece for Bear Valley Resort in the December issue of Ski Magazine.
Management Summary
Luke Roth will be the manager of the daily operations of the Silver Bear Lodge.
6.1 Personnel Plan
The personnel needed for the Silver Bear Lodge are the following:
- Manager.
- Assistant manager.
- Lodge staff (7).
- Food store staff (3).
- Ski rental/clothing store (3).
- Maintenance staff (3).
- Cleaning staff (4).
| Personnel Plan | |||
| Year 1 | Year 2 | Year 3 | |
| Manager | $36,000 | $39,000 | $42,000 |
| Assistant Manager | $42,000 | $45,000 | $48,000 |
| Lodge Staff | $110,000 | $120,000 | $126,000 |
| Food Store Staff | $39,000 | $43,000 | $46,000 |
| Ski Rental/Clothing Store Staff | $35,000 | $39,000 | $42,000 |
| Maintenance Staff | $48,000 | $52,000 | $55,000 |
| Cleaning Staff | $72,000 | $76,000 | $79,000 |
| Total People | 9 | 22 | 22 |
| Total Payroll | $382,000 | $414,000 | $438,000 |
Financial Plan
The following is the financial plan for the Silver Bear Lodge.
7.1 Break-even Analysis
The monthly break-even point is approximately $52,900.

| Break-even Analysis | |
| Monthly Revenue Break-even | $52,905 |
| Assumptions: | |
| Average Percent Variable Cost | 11% |
| Estimated Monthly Fixed Cost | $46,965 |
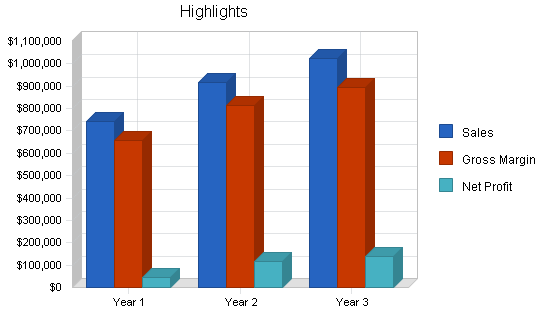
7.2 Projected Profit and Loss
The following is the projected profit and loss for three years.

| Pro Forma Profit and Loss | |||
| Year 1 | Year 2 | Year 3 | |
| Sales | $741,000 | $915,000 | $1,022,000 |
| Direct Cost of Sales | $83,200 | $101,000 | $128,000 |
| Other Production Expenses | $0 | $0 | $0 |
| Total Cost of Sales | $83,200 | $101,000 | $128,000 |
| Gross Margin | $657,800 | $814,000 | $894,000 |
| Gross Margin % | 88.77% | 88.96% | 87.48% |
| Expenses | |||
| Payroll | $382,000 | $414,000 | $438,000 |
| Sales and Marketing and Other Expenses | $60,000 | $80,000 | $100,000 |
| Depreciation | $14,280 | $14,280 | $14,280 |
| Leased Equipment | $0 | $0 | $0 |
| Utilities | $26,000 | $26,000 | $26,000 |
| Insurance | $24,000 | $24,000 | $24,000 |
| Lease | $0 | $0 | $0 |
| Payroll Taxes | $57,300 | $62,100 | $65,700 |
| Other | $0 | $0 | $0 |
| Total Operating Expenses | $563,580 | $620,380 | $667,980 |
| Profit Before Interest and Taxes | $94,220 | $193,620 | $226,020 |
| EBITDA | $108,500 | $207,900 | $240,300 |
| Interest Expense | $33,375 | $30,500 | $27,500 |
| Taxes Incurred | $18,254 | $48,936 | $59,556 |
| Net Profit | $42,592 | $114,184 | $138,964 |
| Net Profit/Sales | 5.75% | 12.48% | 13.60% |
7.3 Projected Balance Sheet
The following is the projected balance sheet for three years.
| Pro Forma Balance Sheet | |||
| Year 1 | Year 2 | Year 3 | |
| Assets | |||
| Current Assets | |||
| Cash | $31,437 | $118,555 | $165,584 |
| Other Current Assets | $14,000 | $32,000 | $53,000 |
| Total Current Assets | $45,437 | $150,555 | $218,584 |
| Long-term Assets | |||
| Long-term Assets | $350,000 | $370,000 | $430,000 |
| Accumulated Depreciation | $14,280 | $28,560 | $42,840 |
| Total Long-term Assets | $335,720 | $341,440 | $387,160 |
| Total Assets | $381,157 | $491,995 | $605,744 |
| Liabilities and Capital | Year 1 | Year 2 | Year 3 |
| Current Liabilities | |||
| Accounts Payable | $3,965 | $30,619 | $35,405 |
| Current Borrowing | $0 | $0 | $0 |
| Other Current Liabilities | $0 | $0 | $0 |
| Subtotal Current Liabilities | $3,965 | $30,619 | $35,405 |
| Long-term Liabilities | $320,000 | $290,000 | $260,000 |
| Total Liabilities | $323,965 | $320,619 | $295,405 |
| Paid-in Capital | $200,000 | $200,000 | $200,000 |
| Retained Earnings | ($185,400) | ($142,809) | ($28,625) |
| Earnings | $42,592 | $114,184 | $138,964 |
| Total Capital | $57,192 | $171,376 | $310,340 |
| Total Liabilities and Capital | $381,157 | $491,995 | $605,744 |
| Net Worth | $57,192 | $171,376 | $310,340 |
7.4 Projected Cash Flow
The following is the projected cash flow for three years.

| Pro Forma Cash Flow | |||
| Year 1 | Year 2 | Year 3 | |
| Cash Received | |||
| Cash from Operations | |||
| Cash Sales | $741,000 | $915,000 | $1,022,000 |
| Subtotal Cash from Operations | $741,000 | $915,000 | $1,022,000 |
| Additional Cash Received | |||
| Sales Tax, VAT, HST/GST Received | $0 | $0 | $0 |
| New Current Borrowing | $0 | $0 | $0 |
| New Other Liabilities (interest-free) | $0 | $0 | $0 |
| New Long-term Liabilities | $0 | $0 | $0 |
| Sales of Other Current Assets | $0 | $0 | $0 |
| Sales of Long-term Assets | $0 | $0 | $0 |
| New Investment Received | $0 | $0 | $0 |
| Subtotal Cash Received | $741,000 | $915,000 | $1,022,000 |
| Expenditures | Year 1 | Year 2 | Year 3 |
| Expenditures from Operations | |||
| Cash Spending | $382,000 | $414,000 | $438,000 |
| Bill Payments | $298,163 | $345,882 | $425,971 |
| Subtotal Spent on Operations | $680,163 | $759,882 | $863,971 |
| Additional Cash Spent | |||
| Sales Tax, VAT, HST/GST Paid Out | $0 | $0 | $0 |
| Principal Repayment of Current Borrowing | $0 | $0 | $0 |
| Other Liabilities Principal Repayment | $0 | $0 | $0 |
| Long-term Liabilities Principal Repayment | $30,000 | $30,000 | $30,000 |
| Purchase Other Current Assets | $14,000 | $18,000 | $21,000 |
| Purchase Long-term Assets | $0 | $20,000 | $60,000 |
| Dividends | $0 | $0 | $0 |
| Subtotal Cash Spent | $724,163 | $827,882 | $974,971 |
| Net Cash Flow | $16,837 | $87,118 | $47,029 |
| Cash Balance | $31,437 | $118,555 | $165,584 |
7.5 Business Ratios
Business ratios for the years of this plan are shown below. Industry profile ratios based on the Standard Industrial Classification (SIC) code 7011, Hotels and Motels, are shown for comparison.
| Ratio Analysis | ||||
| Year 1 | Year 2 | Year 3 | Industry Profile | |
| Sales Growth | 0.00% | 23.48% | 11.69% | 5.90% |
| Percent of Total Assets | ||||
| Other Current Assets | 3.67% | 6.50% | 8.75% | 26.00% |
| Total Current Assets | 11.92% | 30.60% | 36.09% | 32.00% |
| Long-term Assets | 88.08% | 69.40% | 63.91% | 68.00% |
| Total Assets | 100.00% | 100.00% | 100.00% | 100.00% |
| Current Liabilities | 1.04% | 6.22% | 5.84% | 19.40% |
| Long-term Liabilities | 83.95% | 58.94% | 42.92% | 34.60% |
| Total Liabilities | 85.00% | 65.17% | 48.77% | 54.00% |
| Net Worth | 15.00% | 34.83% | 51.23% | 46.00% |
| Percent of Sales | ||||
| Sales | 100.00% | 100.00% | 100.00% | 100.00% |
| Gross Margin | 88.77% | 88.96% | 87.48% | 0.00% |
| Selling, General & Administrative Expenses | 83.02% | 76.48% | 73.88% | 75.10% |
| Advertising Expenses | 8.10% | 8.74% | 9.78% | 1.90% |
| Profit Before Interest and Taxes | 12.72% | 21.16% | 22.12% | 2.50% |
| Main Ratios | ||||
| Current | 11.46 | 4.92 | 6.17 | 1.45 |
| Quick | 11.46 | 4.92 | 6.17 | 1.05 |
| Total Debt to Total Assets | 85.00% | 65.17% | 48.77% | 54.00% |
| Pre-tax Return on Net Worth | 106.39% | 95.18% | 63.97% | 1.70% |
| Pre-tax Return on Assets | 15.96% | 33.15% | 32.77% | 3.70% |
| Additional Ratios | Year 1 | Year 2 | Year 3 | |
| Net Profit Margin | 5.75% | 12.48% | 13.60% | n.a |
| Return on Equity | 74.47% | 66.63% | 44.78% | n.a |
| Activity Ratios | ||||
| Accounts Payable Turnover | 76.19 | 12.17 | 12.17 | n.a |
| Payment Days | 27 | 17 | 28 | n.a |
| Total Asset Turnover | 1.94 | 1.86 | 1.69 | n.a |
| Debt Ratios | ||||
| Debt to Net Worth | 5.66 | 1.87 | 0.95 | n.a |
| Current Liab. to Liab. | 0.01 | 0.10 | 0.12 | n.a |
| Liquidity Ratios | ||||
| Net Working Capital | $41,472 | $119,936 | $183,180 | n.a |
| Interest Coverage | 2.82 | 6.35 | 8.22 | n.a |
| Additional Ratios | ||||
| Assets to Sales | 0.51 | 0.54 | 0.59 | n.a |
| Current Debt/Total Assets | 1% | 6% | 6% | n.a |
| Acid Test | 11.46 | 4.92 | 6.17 | n.a |
| Sales/Net Worth | 12.96 | 5.34 | 3.29 | n.a |
| Dividend Payout | 0.00 | 0.00 | 0.00 | n.a |
Appendix
| Sales Forecast | |||||||||||||
| Month 1 | Month 2 | Month 3 | Month 4 | Month 5 | Month 6 | Month 7 | Month 8 | Month 9 | Month 10 | Month 11 | Month 12 | ||
| Sales | |||||||||||||
| Rooms | 0% | $40,000 | $60,000 | $60,000 | $50,000 | $50,000 | $50,000 | $30,000 | $30,000 | $30,000 | $30,000 | $0 | $0 |
| Food | 0% | $8,000 | $16,000 | $20,000 | $18,000 | $18,000 | $12,000 | $8,000 | $7,000 | $7,000 | $7,000 | $0 | $0 |
| Ski Rentals | 0% | $16,000 | $24,000 | $24,000 | $24,000 | $24,000 | $20,000 | $0 | $0 | $0 | $0 | $0 | $0 |
| Clothing | 0% | $4,000 | $10,000 | $8,000 | $7,000 | $7,000 | $6,000 | $4,000 | $4,000 | $4,000 | $4,000 | $0 | $0 |
| Total Sales | $68,000 | $110,000 | $112,000 | $99,000 | $99,000 | $88,000 | $42,000 | $41,000 | $41,000 | $41,000 | $0 | $0 | |
| Direct Cost of Sales | Month 1 | Month 2 | Month 3 | Month 4 | Month 5 | Month 6 | Month 7 | Month 8 | Month 9 | Month 10 | Month 11 | Month 12 | |
| Rooms | $0 | $0 | $0 | $0 | $0 | $0 | $0 | $0 | $0 | $0 | $0 | $0 | |
| Food | $4,000 | $8,000 | $10,000 | $9,000 | $9,000 | $6,000 | $3,000 | $3,500 | $3,500 | $3,500 | $0 | $0 | |
| Ski Rentals | $0 | $0 | $0 | $0 | $0 | $0 | $0 | $0 | $0 | $0 | $0 | $0 | |
| Clothing | $1,400 | $4,000 | $3,600 | $3,000 | $3,000 | $2,700 | $1,500 | $1,500 | $1,500 | $1,500 | $0 | $0 | |
| Subtotal Direct Cost of Sales | $5,400 | $12,000 | $13,600 | $12,000 | $12,000 | $8,700 | $4,500 | $5,000 | $5,000 | $5,000 | $0 | $0 | |
| Personnel Plan | |||||||||||||
| Month 1 | Month 2 | Month 3 | Month 4 | Month 5 | Month 6 | Month 7 | Month 8 | Month 9 | Month 10 | Month 11 | Month 12 | ||
| Manager | 0% | $3,000 | $3,000 | $3,000 | $3,000 | $3,000 | $3,000 | $3,000 | $3,000 | $3,000 | $3,000 | $3,000 | $3,000 |
| Assistant Manager | 0% | $3,500 | $3,500 | $3,500 | $3,500 | $3,500 | $3,500 | $3,500 | $3,500 | $3,500 | $3,500 | $3,500 | $3,500 |
| Lodge Staff | 0% | $13,000 | $13,000 | $13,000 | $13,000 | $13,000 | $13,000 | $8,000 | $8,000 | $8,000 | $8,000 | $0 | $0 |
| Food Store Staff | 0% | $4,500 | $4,500 | $4,500 | $4,500 | $4,500 | $4,500 | $3,000 | $3,000 | $3,000 | $3,000 | $0 | $0 |
| Ski Rental/Clothing Store Staff | 0% | $4,500 | $4,500 | $4,500 | $4,500 | $4,500 | $4,500 | $2,000 | $2,000 | $2,000 | $2,000 | $0 | $0 |
| Maintenance Staff | 0% | $4,000 | $4,000 | $4,000 | $4,000 | $4,000 | $4,000 | $4,000 | $4,000 | $4,000 | $4,000 | $4,000 | $4,000 |
| Cleaning Staff | 0% | $6,000 | $6,000 | $6,000 | $6,000 | $6,000 | $6,000 | $6,000 | $6,000 | $6,000 | $6,000 | $6,000 | $6,000 |
| Total People | 22 | 22 | 22 | 22 | 22 | 22 | 18 | 18 | 18 | 18 | 9 | 9 | |
| Total Payroll | $38,500 | $38,500 | $38,500 | $38,500 | $38,500 | $38,500 | $29,500 | $29,500 | $29,500 | $29,500 | $16,500 | $16,500 | |
| General Assumptions | |||||||||||||
| Month 1 | Month 2 | Month 3 | Month 4 | Month 5 | Month 6 | Month 7 | Month 8 | Month 9 | Month 10 | Month 11 | Month 12 | ||
| Plan Month | 1 | 2 | 3 | 4 | 5 | 6 | 7 | 8 | 9 | 10 | 11 | 12 | |
| Current Interest Rate | 10.00% | 10.00% | 10.00% | 10.00% | 10.00% | 10.00% | 10.00% | 10.00% | 10.00% | 10.00% | 10.00% | 10.00% | |
| Long-term Interest Rate | 10.00% | 10.00% | 10.00% | 10.00% | 10.00% | 10.00% | 10.00% | 10.00% | 10.00% | 10.00% | 10.00% | 10.00% | |
| Tax Rate | 30.00% | 30.00% | 30.00% | 30.00% | 30.00% | 30.00% | 30.00% | 30.00% | 30.00% | 30.00% | 30.00% | 30.00% | |
| Other | 0 | 0 | 0 | 0 | 0 | 0 | 0 | 0 | 0 | 0 | 0 | 0 | |
| Pro Forma Profit and Loss | |||||||||||||
| Month 1 | Month 2 | Month 3 | Month 4 | Month 5 | Month 6 | Month 7 | Month 8 | Month 9 | Month 10 | Month 11 | Month 12 | ||
| Sales | $68,000 | $110,000 | $112,000 | $99,000 | $99,000 | $88,000 | $42,000 | $41,000 | $41,000 | $41,000 | $0 | $0 | |
| Direct Cost of Sales | $5,400 | $12,000 | $13,600 | $12,000 | $12,000 | $8,700 | $4,500 | $5,000 | $5,000 | $5,000 | $0 | $0 | |
| Other Production Expenses | $0 | $0 | $0 | $0 | $0 | $0 | $0 | $0 | $0 | $0 | $0 | $0 | |
| Total Cost of Sales | $5,400 | $12,000 | $13,600 | $12,000 | $12,000 | $8,700 | $4,500 | $5,000 | $5,000 | $5,000 | $0 | $0 | |
| Gross Margin | $62,600 | $98,000 | $98,400 | $87,000 | $87,000 | $79,300 | $37,500 | $36,000 | $36,000 | $36,000 | $0 | $0 | |
| Gross Margin % | 92.06% | 89.09% | 87.86% | 87.88% | 87.88% | 90.11% | 89.29% | 87.80% | 87.80% | 87.80% | 0.00% | 0.00% | |
| Expenses | |||||||||||||
| Payroll | $38,500 | $38,500 | $38,500 | $38,500 | $38,500 | $38,500 | $29,500 | $29,500 | $29,500 | $29,500 | $16,500 | $16,500 | |
| Sales and Marketing and Other Expenses | $5,000 | $5,000 | $5,000 | $5,000 | $5,000 | $5,000 | $5,000 | $5,000 | $5,000 | $5,000 | $5,000 | $5,000 | |
| Depreciation | $1,190 | $1,190 | $1,190 | $1,190 | $1,190 | $1,190 | $1,190 | $1,190 | $1,190 | $1,190 | $1,190 | $1,190 | |
| Leased Equipment | $0 | $0 | $0 | $0 | $0 | $0 | $0 | $0 | $0 | $0 | $0 | $0 | |
| Utilities | $3,000 | $3,000 | $3,000 | $3,000 | $3,000 | $3,000 | $1,500 | $1,300 | $1,300 | $1,300 | $1,300 | $1,300 | |
| Insurance | $2,000 | $2,000 | $2,000 | $2,000 | $2,000 | $2,000 | $2,000 | $2,000 | $2,000 | $2,000 | $2,000 | $2,000 | |
| Lease | $0 | $0 | $0 | $0 | $0 | $0 | $0 | $0 | $0 | $0 | $0 | $0 | |
| Payroll Taxes | 15% | $5,775 | $5,775 | $5,775 | $5,775 | $5,775 | $5,775 | $4,425 | $4,425 | $4,425 | $4,425 | $2,475 | $2,475 |
| Other | $0 | $0 | $0 | $0 | $0 | $0 | $0 | $0 | $0 | $0 | $0 | $0 | |
| Total Operating Expenses | $55,465 | $55,465 | $55,465 | $55,465 | $55,465 | $55,465 | $43,615 | $43,415 | $43,415 | $43,415 | $28,465 | $28,465 | |
| Profit Before Interest and Taxes | $7,135 | $42,535 | $42,935 | $31,535 | $31,535 | $23,835 | ($6,115) | ($7,415) | ($7,415) | ($7,415) | ($28,465) | ($28,465) | |
| EBITDA | $8,325 | $43,725 | $44,125 | $32,725 | $32,725 | $25,025 | ($4,925) | ($6,225) | ($6,225) | ($6,225) | ($27,275) | ($27,275) | |
| Interest Expense | $2,896 | $2,875 | $2,854 | $2,833 | $2,813 | $2,792 | $2,771 | $2,750 | $2,729 | $2,708 | $2,688 | $2,667 | |
| Taxes Incurred | $1,272 | $11,898 | $12,024 | $8,611 | $8,617 | $6,313 | ($2,666) | ($3,050) | ($3,043) | ($3,037) | ($9,346) | ($9,340) | |
| Net Profit | $2,967 | $27,762 | $28,057 | $20,091 | $20,106 | $14,730 | ($6,220) | ($7,116) | ($7,101) | ($7,086) | ($21,807) | ($21,792) | |
| Net Profit/Sales | 4.36% | 25.24% | 25.05% | 20.29% | 20.31% | 16.74% | -14.81% | -17.35% | -17.32% | -17.28% | 0.00% | 0.00% | |
| Pro Forma Cash Flow | |||||||||||||
| Month 1 | Month 2 | Month 3 | Month 4 | Month 5 | Month 6 | Month 7 | Month 8 | Month 9 | Month 10 | Month 11 | Month 12 | ||
| Cash Received | |||||||||||||
| Cash from Operations | |||||||||||||
| Cash Sales | $68,000 | $110,000 | $112,000 | $99,000 | $99,000 | $88,000 | $42,000 | $41,000 | $41,000 | $41,000 | $0 | $0 | |
| Subtotal Cash from Operations | $68,000 | $110,000 | $112,000 | $99,000 | $99,000 | $88,000 | $42,000 | $41,000 | $41,000 | $41,000 | $0 | $0 | |
| Additional Cash Received | |||||||||||||
| Sales Tax, VAT, HST/GST Received | 0.00% | $0 | $0 | $0 | $0 | $0 | $0 | $0 | $0 | $0 | $0 | $0 | $0 |
| New Current Borrowing | $0 | $0 | $0 | $0 | $0 | $0 | $0 | $0 | $0 | $0 | $0 | $0 | |
| New Other Liabilities (interest-free) | $0 | $0 | $0 | $0 | $0 | $0 | $0 | $0 | $0 | $0 | $0 | $0 | |
| New Long-term Liabilities | $0 | $0 | $0 | $0 | $0 | $0 | $0 | $0 | $0 | $0 | $0 | $0 | |
| Sales of Other Current Assets | $0 | $0 | $0 | $0 | $0 | $0 | $0 | $0 | $0 | $0 | $0 | $0 | |
| Sales of Long-term Assets | $0 | $0 | $0 | $0 | $0 | $0 | $0 | $0 | $0 | $0 | $0 | $0 | |
| New Investment Received | $0 | $0 | $0 | $0 | $0 | $0 | $0 | $0 | $0 | $0 | $0 | $0 | |
| Subtotal Cash Received | $68,000 | $110,000 | $112,000 | $99,000 | $99,000 | $88,000 | $42,000 | $41,000 | $41,000 | $41,000 | $0 | $0 | |
| Expenditures | Month 1 | Month 2 | Month 3 | Month 4 | Month 5 | Month 6 | Month 7 | Month 8 | Month 9 | Month 10 | Month 11 | Month 12 | |
| Expenditures from Operations | |||||||||||||
| Cash Spending | $38,500 | $38,500 | $38,500 | $38,500 | $38,500 | $38,500 | $29,500 | $29,500 | $29,500 | $29,500 | $16,500 | $16,500 | |
| Bill Payments | $845 | $25,916 | $42,605 | $44,086 | $39,218 | $39,017 | $33,045 | $17,527 | $17,425 | $17,410 | $16,954 | $4,116 | |
| Subtotal Spent on Operations | $39,345 | $64,416 | $81,105 | $82,586 | $77,718 | $77,517 | $62,545 | $47,027 | $46,925 | $46,910 | $33,454 | $20,616 | |
| Additional Cash Spent | |||||||||||||
| Sales Tax, VAT, HST/GST Paid Out | $0 | $0 | $0 | $0 | $0 | $0 | $0 | $0 | $0 | $0 | $0 | $0 | |
| Principal Repayment of Current Borrowing | $0 | $0 | $0 | $0 | $0 | $0 | $0 | $0 | $0 | $0 | $0 | $0 | |
| Other Liabilities Principal Repayment | $0 | $0 | $0 | $0 | $0 | $0 | $0 | $0 | $0 | $0 | $0 | $0 | |
| Long-term Liabilities Principal Repayment | $2,500 | $2,500 | $2,500 | $2,500 | $2,500 | $2,500 | $2,500 | $2,500 | $2,500 | $2,500 | $2,500 | $2,500 | |
| Purchase Other Current Assets | $0 | $3,000 | $1,000 | $0 | $3,000 | $0 | $2,000 | $0 | $2,000 | $0 | $0 | $3,000 | |
| Purchase Long-term Assets | $0 | $0 | $0 | $0 | $0 | $0 | $0 | $0 | $0 | $0 | $0 | $0 | |
| Dividends | $0 | $0 | $0 | $0 | $0 | $0 | $0 | $0 | $0 | $0 | $0 | $0 | |
| Subtotal Cash Spent | $41,845 | $69,916 | $84,605 | $85,086 | $83,218 | $80,017 | $67,045 | $49,527 | $51,425 | $49,410 | $35,954 | $26,116 | |
| Net Cash Flow | $26,155 | $40,084 | $27,395 | $13,914 | $15,782 | $7,983 | ($25,045) | ($8,527) | ($10,425) | ($8,410) | ($35,954) | ($26,116) | |
| Cash Balance | $40,755 | $80,839 | $108,234 | $122,149 | $137,930 | $145,914 | $120,869 | $112,342 | $101,917 | $93,507 | $57,553 | $31,437 | |
| Pro Forma Balance Sheet | |||||||||||||
| Month 1 | Month 2 | Month 3 | Month 4 | Month 5 | Month 6 | Month 7 | Month 8 | Month 9 | Month 10 | Month 11 | Month 12 | ||
| Assets | Starting Balances | ||||||||||||
| Current Assets | |||||||||||||
| Cash | $14,600 | $40,755 | $80,839 | $108,234 | $122,149 | $137,930 | $145,914 | $120,869 | $112,342 | $101,917 | $93,507 | $57,553 | $31,437 |
| Other Current Assets | $0 | $0 | $3,000 | $4,000 | $4,000 | $7,000 | $7,000 | $9,000 | $9,000 | $11,000 | $11,000 | $11,000 | $14,000 |
| Total Current Assets | $14,600 | $40,755 | $83,839 | $112,234 | $126,149 | $144,930 | $152,914 | $129,869 | $121,342 | $112,917 | $104,507 | $68,553 | $45,437 |
| Long-term Assets | |||||||||||||
| Long-term Assets | $350,000 | $350,000 | $350,000 | $350,000 | $350,000 | $350,000 | $350,000 | $350,000 | $350,000 | $350,000 | $350,000 | $350,000 | $350,000 |
| Accumulated Depreciation | $0 | $1,190 | $2,380 | $3,570 | $4,760 | $5,950 | $7,140 | $8,330 | $9,520 | $10,710 | $11,900 | $13,090 | $14,280 |
| Total Long-term Assets | $350,000 | $348,810 | $347,620 | $346,430 | $345,240 | $344,050 | $342,860 | $341,670 | $340,480 | $339,290 | $338,100 | $336,910 | $335,720 |
| Total Assets | $364,600 | $389,565 | $431,459 | $458,664 | $471,389 | $488,980 | $495,774 | $471,539 | $461,822 | $452,207 | $442,607 | $405,463 | $381,157 |
| Liabilities and Capital | Month 1 | Month 2 | Month 3 | Month 4 | Month 5 | Month 6 | Month 7 | Month 8 | Month 9 | Month 10 | Month 11 | Month 12 | |
| Current Liabilities | |||||||||||||
| Accounts Payable | $0 | $24,498 | $41,130 | $42,778 | $37,912 | $37,897 | $32,460 | $16,946 | $16,845 | $16,831 | $16,816 | $3,980 | $3,965 |
| Current Borrowing | $0 | $0 | $0 | $0 | $0 | $0 | $0 | $0 | $0 | $0 | $0 | $0 | $0 |
| Other Current Liabilities | $0 | $0 | $0 | $0 | $0 | $0 | $0 | $0 | $0 | $0 | $0 | $0 | $0 |
| Subtotal Current Liabilities | $0 | $24,498 | $41,130 | $42,778 | $37,912 | $37,897 | $32,460 | $16,946 | $16,845 | $16,831 | $16,816 | $3,980 | $3,965 |
| Long-term Liabilities | $350,000 | $347,500 | $345,000 | $342,500 | $340,000 | $337,500 | $335,000 | $332,500 | $330,000 | $327,500 | $325,000 | $322,500 | $320,000 |
| Total Liabilities | $350,000 | $371,998 | $386,130 | $385,278 | $377,912 | $375,397 | $367,460 | $349,446 | $346,845 | $344,331 | $341,816 | $326,480 | $323,965 |
| Paid-in Capital | $200,000 | $200,000 | $200,000 | $200,000 | $200,000 | $200,000 | $200,000 | $200,000 | $200,000 | $200,000 | $200,000 | $200,000 | $200,000 |
| Retained Earnings | ($185,400) | ($185,400) | ($185,400) | ($185,400) | ($185,400) | ($185,400) | ($185,400) | ($185,400) | ($185,400) | ($185,400) | ($185,400) | ($185,400) | ($185,400) |
| Earnings | $0 | $2,967 | $30,729 | $58,786 | $78,877 | $98,983 | $113,713 | $107,493 | $100,378 | $93,277 | $86,190 | $64,384 | $42,592 |
| Total Capital | $14,600 | $17,567 | $45,329 | $73,386 | $93,477 | $113,583 | $128,313 | $122,093 | $114,978 | $107,877 | $100,790 | $78,984 | $57,192 |
| Total Liabilities and Capital | $364,600 | $389,565 | $431,459 | $458,664 | $471,389 | $488,980 | $495,774 | $471,539 | $461,822 | $452,207 | $442,607 | $405,463 | $381,157 |
| Net Worth | $14,600 | $17,567 | $45,329 | $73,386 | $93,477 | $113,583 | $128,313 | $122,093 | $114,978 | $107,877 | $100,790 | $78,984 | $57,192 |


