
Victorian Renovations
Executive Summary
Victorian Renovations (VR) is a start-up company that is being formed to meet the growing need for unique restored vintage homes in downtown Portland, Oregon. The company is initially focused on one building, located on Fifth and Pearl, which it is in the process of purchasing. The house will be renovated by the two owners of the business, Doug Machen and Sarah Renner, both of whom are experienced in house renovation and both of whom have graduated from the MBA program at the University of Portland. External contractors will also be used for the larger jobs, but most of the work will be completed by Doug and Sarah.
After completion, the house will be rented out, and the income stream will be used to pay the mortgage on the house and to finance the purchase of another property in downtown Portland. Due to the rising demand of unique homes in this area, it is believed that the property at Fifth and Pearl will be rented out for a high price and will produce substantial cash flow to finance future projects.
1.1 Mission
The mission of VR is to develop rundown houses in the Portland area, to improve the look and financial viability of downtown Portland, and rent those properties out to provide a stream of income for future investments. The company will develop unique homes targeting the discriminating renter who is willing to pay more for a top quality home. VR seeks to be viewed as a highly visible company in the property development market.
1.2 Objectives
The following are the main objectives for VR:
- To obtain investor funding to purchase and renovate a four bedroom residence on Pearl and Fifth in the Hawthorne District of Portland, Oregon.
- To complete renovations on the four bedroom victorian residence, to convert it into two 2-bedroom units by October 2001.
- To rent out that residence to provide an income stream enough to pay the mortgage and provide additional income for future projects.
- To purchase another residence for renovation immediately thereafter.

1.3 Keys to Success
The keys to success for this project will be:
- To complete the renovation work within the scheduled time and within the budgeted amount.
- To find rental occupants for the building before renovations are completed or as soon as possible after completion.
- To maintain an average 80% occupancy rate each year.
Company Summary
Victorian Renovations is a vintage house renovator based in Portland, OR. We purchase dilapidated buildings at low cost and renovate them in vintage Victorian style, they are then rented to young families and couples. We are a privately-owned Oregon corporation. We are relatively small, but have a good understanding of the market, a background in this industry, and a great passion for our work.
2.1 Start-up Summary
The company was started when these two business colleagues realized the number of old dilapidated homes in Portland in need of repair and correspondingly the growth in popularity of older restored homes.
They have recently located the house on Pearl and Fifth and are in the process of obtaining a loan. Each partner will contribute investment which will be used to cover the down payment of 20%, the mortgage payments for the first six months while the house is being renovated, and the materials and labor to develop the building. Much of the work will be done by Doug and Sarah, since they are both owners of older homes and have completed much of the renovation and repair to those homes themselves.
Other costs associated with start-up are the legal costs of incorporating the business and building insurance.

| Start-up | |
| Requirements | |
| Start-up Expenses | |
| Legal | $500 |
| Insurance | $250 |
| Total Start-up Expenses | $750 |
| Start-up Assets | |
| Cash Required | $74,500 |
| Other Current Assets | $750 |
| Long-term Assets | $144,000 |
| Total Assets | $219,250 |
| Total Requirements | $220,000 |
| Start-up Funding | |
| Start-up Expenses to Fund | $750 |
| Start-up Assets to Fund | $219,250 |
| Total Funding Required | $220,000 |
| Assets | |
| Non-cash Assets from Start-up | $144,750 |
| Cash Requirements from Start-up | $74,500 |
| Additional Cash Raised | $0 |
| Cash Balance on Starting Date | $74,500 |
| Total Assets | $219,250 |
| Liabilities and Capital | |
| Liabilities | |
| Current Borrowing | $0 |
| Long-term Liabilities | $160,000 |
| Accounts Payable (Outstanding Bills) | $0 |
| Other Current Liabilities (interest-free) | $0 |
| Total Liabilities | $160,000 |
| Capital | |
| Planned Investment | |
| Sarah Renner | $30,000 |
| Doug Machen | $30,000 |
| Other | $0 |
| Additional Investment Requirement | $0 |
| Total Planned Investment | $60,000 |
| Loss at Start-up (Start-up Expenses) | ($750) |
| Total Capital | $59,250 |
| Total Capital and Liabilities | $219,250 |
| Total Funding | $220,000 |
2.2 Company Ownership
Victorian Renovations is a privately-held Oregon corporation. It is jointly owned by friends and business partners, Sarah Renner and Doug Machen.
Services
Currently the company has just one product, which is the house on Pearl and Fifth.
Market Analysis Summary
Housing exploded into the 21st century on a high note, breaking records for home sales, home ownership rates, and the value of residential construction. Buoyed by the longest economic expansion in history, these residential real estate indicators all set records in 1999.
While Portland is occasionally an enigma when stacked next to national trends–mostly because its urban growth boundary demands greater infill development–a report released this summer is nonetheless likely to raise some eyebrows.
“The State of the Nation’s Housing: 2000,” prepared by Harvard University’s Joint Center for Housing Studies and funded by the Ford Foundation, found that Portland’s housing prices leaped 44% over the past decade–and even rivaled its neighboring peers, Seattle and San Francisco, by substantial percentage points.
This summer, metropolitan Portland’s median sales price for homes rose above the $170,000 mark–and the Lake Oswego/West Linn market soared above the $290,000 mark–according to the Residential Multiple Listing Service’s Market Action.
Crunching numbers adjusted for inflation and factoring out rises in home size and quality, the Harvard University report concluded that Portland had the third-largest leap in housing prices out of 35 U.S. cities. The heftiest increases were tallied by Salt Lake City, with 60%, and Denver, with 49%. One of the largest dips in housing prices affected another West Coast neighbor, Los Angeles, which saw prices slump 18%. Metro Councilor Rod Park attributes much of Portland’s home-pricing increases to the influx of out-of-state workers. Intel Corporation, for instance, recently announced plans to expand facilities in Hillsboro’s high-tech Sunset Corridor. Park said the global chip maker plans to fill many new jobs with out-of-state employees.
The trend with Intel snagging local tax breaks and then bringing in workers from elsewhere ought to raise the eyebrows of local officials, and especially local colleges and universities, he added.
“What we view up here as expensive has a lot to do with people with more earning potential coming in and bidding the prices up,” Park said.
According to an affordability index prepared by the National Association of Home Builders, Portland recently ranked as the 25th least affordable of 192 major U.S. cities.
(Source: The Portland Business Journal, Brian J. Back Business Journal Staff Writer.)
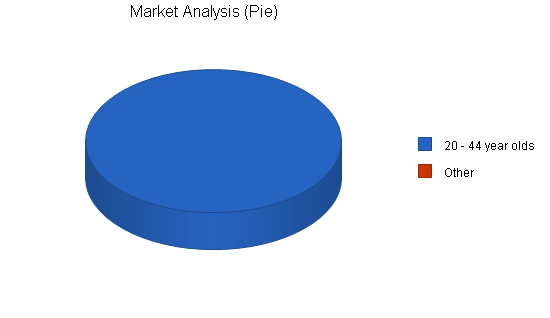
4.1 Market Segmentation
Victorian Renovations will be targeting upper income couples to rent its properties. Currently, although the labor market is buoyant in Portland, there is some uncertainty ahead, meaning that there are many people moving into the area who are unsure whether they will be staying for more than a couple of years. In addition, there are a large number of people moving to Portland from out of state who do not know the city as yet, so would rather rent a home than commit to a purchase.

The largest population group in Portland is 20-44 year olds and VR will be targeting the 25 to 30 year olds within this group. They have been out of college for a few years and have established careers, but may not be ready to settle down yet with a home purchase. In addition, many of them are earning high wages with high tech companies. It is estimated that this group makes up 5% of all people in the 20-44 year old age group in Portland.
Portland Community Age Groups
| 1970 | 1980 | 1990 | |
| Under 5 years | 29,779 | 23,883 | 30,314 |
| 5-19 years | 94,079 | 68,259 | 76,792 |
| 20-44 years | 114,472 | 150,431 | 193,287 |
| 45-64 years | 90,607 | 67,881 | 73,269 |
| 65+ years | 56,682 | 55,929 | 63,657 |
| Median Age | 32 | 31 | 34 |
(Source: US Census. Median value is the middle value, not an average.)
| Market Analysis | |||||||
| Year 1 | Year 2 | Year 3 | Year 4 | Year 5 | |||
| Potential Customers | Growth | CAGR | |||||
| 20 – 44 year olds | 14% | 11,050 | 12,597 | 14,361 | 16,372 | 18,664 | 14.00% |
| Other | 0% | 0 | 0 | 0 | 0 | 0 | 0.00% |
| Total | 14.00% | 11,050 | 12,597 | 14,361 | 16,372 | 18,664 | 14.00% |
4.2 Service Business Analysis
Below are the most recent figures we are able to find on the Portland housing market. If trends in the housing market have remained similar, the vacancy rate of 5.59% looks very promising for VR, since the target is to have the building occupied 80% of the year.
City of Portland 1990 Housing Breakout:
| Vacancy Rate: | 5.59% |
| Owner Occupied: | 99,244 |
| Renter Occupied: | 87,980 |
(Source: US Census.)
4.2.1 Competition and Buying Patterns
Competition comes in a number of forms in the portion of the housing market which VR will target. There are a large number of housing options in the Portland market, however we believe that there are very few houses that have been renovated in a unique Victorian style that are for rent. For this reason, although this house will be converted into two 2-bedroom apartments, we will be able to charge a premium price for rental. Where the average price for a 2-bedroom apartment in downtown Portland is $850, we will charge $900 per unit. We believe that there is room in the market for this vintage and quality of building in the rental market.
Strategy and Implementation Summary
Our strategy is based on the fact that there is a large portion of people in the Portland area who value comfortable, vintage living with all the modern conveniences. The homes that we develop will be targeted towards people who are in the market for a rental property and are willing to spend more on their homes to have authentic, classic surroundings. These people are willing to pay more for this unique property.
5.1 Competitive Edge
The company’s competitive edge is the expertise of the two owners in renovating and restoring older homes. Both currently own vintage homs and have done much of the renovation themselves, only bringing contractors in to do very large jobs. In addition, both have strong business backgrounds, one in marketing and one in finance and accounting.
5.2 Marketing Strategy
The marketing for VR will be limited, since the company simply needs to rent out two apartments for one year leases. A full color leaflet will be developed that will be posted outside the property near the end of the restoring process. In addition, newspaper advertisements will be placed in local newspapers and on rental websites.
5.3 Sales Strategy
Because these apartments will be high quality, VR will be choosy about who they will accept as tenants. References and proof of employment or ability to pay the rent will be needed. Also, one month’s rent will be requested as a deposit on signing of the lease.
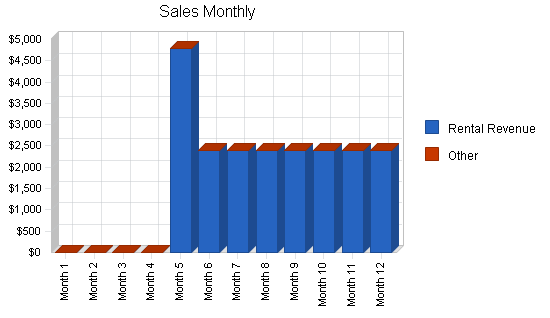
5.3.1 Sales Forecast
The following is the sales forecast for VR’s first apartment building on Fifth and Pearl.

| Sales Forecast | |||
| Year 1 | Year 2 | Year 3 | |
| Sales | |||
| Rental Revenue | $21,600 | $23,760 | $26,136 |
| Other | $0 | $0 | $0 |
| Total Sales | $21,600 | $23,760 | $26,136 |
| Direct Cost of Sales | Year 1 | Year 2 | Year 3 |
| Rental Costs | $2,160 | $2,376 | $2,614 |
| Other | $0 | $0 | $0 |
| Subtotal Direct Cost of Sales | $2,160 | $2,376 | $2,614 |
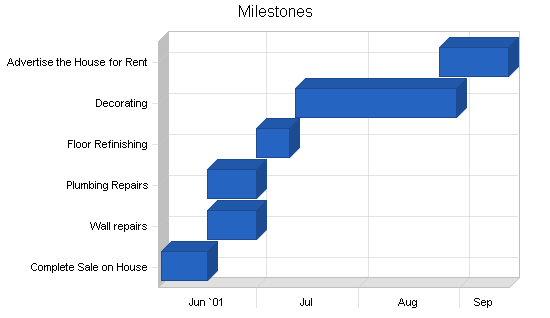
5.4 Milestones
The following Milestones table illustrate the key steps that Victorian Renovations must achieve in order to ensure the success of this venture.
| Milestones | |||||
| Milestone | Start Date | End Date | Budget | Manager | Department |
| Complete Sale on House | 6/1/2001 | 6/15/2001 | $2,000 | Doug Machen | Owner |
| Wall repairs | 6/15/2001 | 6/30/2001 | $3,000 | Contractor | Admin |
| Plumbing Repairs | 6/15/2001 | 6/30/2001 | $2,000 | Doug Machen | Owner |
| Floor Refinishing | 6/30/2001 | 7/10/2001 | $3,000 | Renner/Machen | Owners |
| Decorating | 7/12/2001 | 8/30/2001 | $5,000 | Renner/Machen | Owners |
| Advertise the House for Rent | 8/25/2001 | 9/15/2001 | $200 | Sarah Renner | Owner |
| Totals | $15,200 | ||||
Management Summary
Victorian Renovations will be wholly owned and managed by Doug Machen and Sarah Renner. Both have MBA degrees from the University of Portland and both are experienced home owners and renovators. Victorian Renovations will be a side business for them, since they currently work time. They will be working on renovating the building on Fifth and Pearl at night and on weekends.
Doug works for an accounting firm and deals with many real estate transactions for his clients. This experience makes him perfect to negotiate the sales price and mortgage on the house.
Sarah works as a marketing specialist for an interior design firm that focuses on high end reproductions of antique era household items, such a victorian style sinks, taps, wall paper, tiles, and furniture. Most of the products are sourced from overseas, so the company works on big margins. As a result, employees can get good discounts on products from the company. Sarah will be purchasing most products for the house renovation directly from her work.
6.1 Personnel Plan
The owners will be working on this project alone, though they will be bringing in contractors to do some of the heavier renovation work. For the first couple of years, neither will be taking a salary. Instead, they will be plowing profits back into the business, with the aim of buying other properties.
Financial Plan
The following financial information shows the assumptions and outcomes of the purchase, renovation, and rental of the first property on Fifth and Pearl. No attempt has been made to discuss the implications of purchasing other buildings, since these will happen on a more ad hoc basis.
7.1 Important Assumptions
The following are conservative assumptions that will influence our financial projections.
| General Assumptions | |||
| Year 1 | Year 2 | Year 3 | |
| Plan Month | 1 | 2 | 3 |
| Current Interest Rate | 9.00% | 9.00% | 9.00% |
| Long-term Interest Rate | 6.75% | 6.75% | 6.75% |
| Tax Rate | 30.00% | 30.00% | 30.00% |
| Other | 0 | 0 | 0 |
7.2 Break-even Analysis
The regular Break-even Analysis is not appropriate for this project, but the following text explains the Break-even chart.
Investors will receive 66% of the rental income from the property. It is estimated that this property will produce $2400 per month of rental. At maximum occupancy, the payout to investors will be fixed monthly cost of $1,600. The remaining $800 per month will be kept in a savings account to pay for general upkeep of the building and any unexpected repairs. It is estimated that routine bills and maintenance will be no more than $400 per month.

| Break-even Analysis | |
| Monthly Revenue Break-even | $1,417 |
| Assumptions: | |
| Average Percent Variable Cost | 10% |
| Estimated Monthly Fixed Cost | $1,275 |
7.3 Projected Profit and Loss
The following Profit and Loss table illustrates that VR will lose money in the first year, but in the second year, on this single property, the company will make a healthy return of 10% in 2002 and 15% in 2003.


| Pro Forma Profit and Loss | |||
| Year 1 | Year 2 | Year 3 | |
| Sales | $21,600 | $23,760 | $26,136 |
| Direct Cost of Sales | $2,160 | $2,376 | $2,614 |
| Other Production Expenses | $18,000 | $0 | $0 |
| Total Cost of Sales | $20,160 | $2,376 | $2,614 |
| Gross Margin | $1,440 | $21,384 | $23,522 |
| Gross Margin % | 6.67% | 90.00% | 90.00% |
| Expenses | |||
| Payroll | $0 | $0 | $0 |
| Sales and Marketing and Other Expenses | $9,500 | $1,300 | $1,400 |
| Depreciation | $3,200 | $4,800 | $4,800 |
| Leased Equipment | $0 | $0 | $0 |
| Utilities | $2,300 | $1,200 | $1,300 |
| Insurance | $300 | $300 | $350 |
| Rent | $0 | $0 | $0 |
| Payroll Taxes | $0 | $0 | $0 |
| Other | $0 | $0 | $0 |
| Total Operating Expenses | $15,300 | $7,600 | $7,850 |
| Profit Before Interest and Taxes | ($13,860) | $13,784 | $15,672 |
| EBITDA | ($10,660) | $18,584 | $20,472 |
| Interest Expense | $10,668 | $10,380 | $10,061 |
| Taxes Incurred | $0 | $1,021 | $1,684 |
| Net Profit | ($24,528) | $2,383 | $3,928 |
| Net Profit/Sales | -113.56% | 10.03% | 15.03% |
7.4 Projected Cash Flow
The following Balance Sheet shows healthy cash flow that will enable VR to maintain the existing location at Fifth and Pearl and allow Doug and Sarah to purchase a second property in Portland in year two of the operation.

| Pro Forma Cash Flow | |||
| Year 1 | Year 2 | Year 3 | |
| Cash Received | |||
| Cash from Operations | |||
| Cash Sales | $21,600 | $23,760 | $26,136 |
| Subtotal Cash from Operations | $21,600 | $23,760 | $26,136 |
| Additional Cash Received | |||
| Sales Tax, VAT, HST/GST Received | $0 | $0 | $0 |
| New Current Borrowing | $0 | $0 | $0 |
| New Other Liabilities (interest-free) | $0 | $0 | $0 |
| New Long-term Liabilities | $0 | $0 | $0 |
| Sales of Other Current Assets | $0 | $0 | $0 |
| Sales of Long-term Assets | $0 | $0 | $0 |
| New Investment Received | $0 | $0 | $0 |
| Subtotal Cash Received | $21,600 | $23,760 | $26,136 |
| Expenditures | Year 1 | Year 2 | Year 3 |
| Expenditures from Operations | |||
| Cash Spending | $0 | $0 | $0 |
| Bill Payments | $41,654 | $16,489 | $17,339 |
| Subtotal Spent on Operations | $41,654 | $16,489 | $17,339 |
| Additional Cash Spent | |||
| Sales Tax, VAT, HST/GST Paid Out | $0 | $0 | $0 |
| Principal Repayment of Current Borrowing | $0 | $0 | $0 |
| Other Liabilities Principal Repayment | $0 | $0 | $0 |
| Long-term Liabilities Principal Repayment | $3,938 | $4,572 | $4,891 |
| Purchase Other Current Assets | $0 | $0 | $0 |
| Purchase Long-term Assets | $0 | $0 | $0 |
| Dividends | $0 | $0 | $0 |
| Subtotal Cash Spent | $45,592 | $21,061 | $22,231 |
| Net Cash Flow | ($23,992) | $2,699 | $3,905 |
| Cash Balance | $50,508 | $53,207 | $57,112 |
7.5 Projected Balance Sheet
The Balance Sheet shows a healthy company with a positive net worth that will ensure future financial stability and the ability to grow through investment in other properties in the future.
| Pro Forma Balance Sheet | |||
| Year 1 | Year 2 | Year 3 | |
| Assets | |||
| Current Assets | |||
| Cash | $50,508 | $53,207 | $57,112 |
| Other Current Assets | $750 | $750 | $750 |
| Total Current Assets | $51,258 | $53,957 | $57,862 |
| Long-term Assets | |||
| Long-term Assets | $144,000 | $144,000 | $144,000 |
| Accumulated Depreciation | $3,200 | $8,000 | $12,800 |
| Total Long-term Assets | $140,800 | $136,000 | $131,200 |
| Total Assets | $192,058 | $189,957 | $189,062 |
| Liabilities and Capital | Year 1 | Year 2 | Year 3 |
| Current Liabilities | |||
| Accounts Payable | $1,274 | $1,363 | $1,431 |
| Current Borrowing | $0 | $0 | $0 |
| Other Current Liabilities | $0 | $0 | $0 |
| Subtotal Current Liabilities | $1,274 | $1,363 | $1,431 |
| Long-term Liabilities | $156,062 | $151,490 | $146,599 |
| Total Liabilities | $157,336 | $152,853 | $148,030 |
| Paid-in Capital | $60,000 | $60,000 | $60,000 |
| Retained Earnings | ($750) | ($25,278) | ($22,895) |
| Earnings | ($24,528) | $2,383 | $3,928 |
| Total Capital | $34,722 | $37,105 | $41,033 |
| Total Liabilities and Capital | $192,058 | $189,957 | $189,062 |
| Net Worth | $34,722 | $37,105 | $41,033 |
7.6 Business Ratios
The following table contains important ratios for the Single-family housing construction industry, as determined by the Standard Industry Classification (SIC) Index Number 1521.
| Ratio Analysis | ||||
| Year 1 | Year 2 | Year 3 | Industry Profile | |
| Sales Growth | 0.00% | 10.00% | 10.00% | 7.20% |
| Percent of Total Assets | ||||
| Other Current Assets | 0.39% | 0.39% | 0.40% | 30.60% |
| Total Current Assets | 26.69% | 28.40% | 30.60% | 80.40% |
| Long-term Assets | 73.31% | 71.60% | 69.40% | 19.60% |
| Total Assets | 100.00% | 100.00% | 100.00% | 100.00% |
| Current Liabilities | 0.66% | 0.72% | 0.76% | 44.20% |
| Long-term Liabilities | 81.26% | 79.75% | 77.54% | 11.50% |
| Total Liabilities | 81.92% | 80.47% | 78.30% | 55.70% |
| Net Worth | 18.08% | 19.53% | 21.70% | 44.30% |
| Percent of Sales | ||||
| Sales | 100.00% | 100.00% | 100.00% | 100.00% |
| Gross Margin | 6.67% | 90.00% | 90.00% | 18.10% |
| Selling, General & Administrative Expenses | 120.22% | 79.97% | 74.97% | 7.00% |
| Advertising Expenses | 1.39% | 0.00% | 0.00% | 0.20% |
| Profit Before Interest and Taxes | -64.17% | 58.01% | 59.96% | 3.50% |
| Main Ratios | ||||
| Current | 40.24 | 39.60 | 40.44 | 1.83 |
| Quick | 40.24 | 39.60 | 40.44 | 0.86 |
| Total Debt to Total Assets | 81.92% | 80.47% | 78.30% | 55.70% |
| Pre-tax Return on Net Worth | -70.64% | 9.17% | 13.68% | 5.40% |
| Pre-tax Return on Assets | -12.77% | 1.79% | 2.97% | 12.20% |
| Additional Ratios | Year 1 | Year 2 | Year 3 | |
| Net Profit Margin | -113.56% | 10.03% | 15.03% | n.a |
| Return on Equity | -70.64% | 6.42% | 9.57% | n.a |
| Activity Ratios | ||||
| Accounts Payable Turnover | 33.70 | 12.17 | 12.17 | n.a |
| Payment Days | 27 | 29 | 29 | n.a |
| Total Asset Turnover | 0.11 | 0.13 | 0.14 | n.a |
| Debt Ratios | ||||
| Debt to Net Worth | 4.53 | 4.12 | 3.61 | n.a |
| Current Liab. to Liab. | 0.01 | 0.01 | 0.01 | n.a |
| Liquidity Ratios | ||||
| Net Working Capital | $49,984 | $52,595 | $56,432 | n.a |
| Interest Coverage | -1.30 | 1.33 | 1.56 | n.a |
| Additional Ratios | ||||
| Assets to Sales | 8.89 | 7.99 | 7.23 | n.a |
| Current Debt/Total Assets | 1% | 1% | 1% | n.a |
| Acid Test | 40.24 | 39.60 | 40.44 | n.a |
| Sales/Net Worth | 0.62 | 0.64 | 0.64 | n.a |
| Dividend Payout | 0.00 | 0.00 | 0.00 | n.a |
Appendix
| Sales Forecast | |||||||||||||
| Month 1 | Month 2 | Month 3 | Month 4 | Month 5 | Month 6 | Month 7 | Month 8 | Month 9 | Month 10 | Month 11 | Month 12 | ||
| Sales | |||||||||||||
| Rental Revenue | 0% | $0 | $0 | $0 | $0 | $4,800 | $2,400 | $2,400 | $2,400 | $2,400 | $2,400 | $2,400 | $2,400 |
| Other | 0% | $0 | $0 | $0 | $0 | $0 | $0 | $0 | $0 | $0 | $0 | $0 | $0 |
| Total Sales | $0 | $0 | $0 | $0 | $4,800 | $2,400 | $2,400 | $2,400 | $2,400 | $2,400 | $2,400 | $2,400 | |
| Direct Cost of Sales | Month 1 | Month 2 | Month 3 | Month 4 | Month 5 | Month 6 | Month 7 | Month 8 | Month 9 | Month 10 | Month 11 | Month 12 | |
| Rental Costs | $0 | $0 | $0 | $0 | $480 | $240 | $240 | $240 | $240 | $240 | $240 | $240 | |
| Other | $0 | $0 | $0 | $0 | $0 | $0 | $0 | $0 | $0 | $0 | $0 | $0 | |
| Subtotal Direct Cost of Sales | $0 | $0 | $0 | $0 | $480 | $240 | $240 | $240 | $240 | $240 | $240 | $240 | |
| General Assumptions | ||||||||||||
| Month 1 | Month 2 | Month 3 | Month 4 | Month 5 | Month 6 | Month 7 | Month 8 | Month 9 | Month 10 | Month 11 | Month 12 | |
| Plan Month | 1 | 2 | 3 | 4 | 5 | 6 | 7 | 8 | 9 | 10 | 11 | 12 |
| Current Interest Rate | 9.00% | 9.00% | 9.00% | 9.00% | 9.00% | 9.00% | 9.00% | 9.00% | 9.00% | 9.00% | 9.00% | 9.00% |
| Long-term Interest Rate | 6.75% | 6.75% | 6.75% | 6.75% | 6.75% | 6.75% | 6.75% | 6.75% | 6.75% | 6.75% | 6.75% | 6.75% |
| Tax Rate | 30.00% | 30.00% | 30.00% | 30.00% | 30.00% | 30.00% | 30.00% | 30.00% | 30.00% | 30.00% | 30.00% | 30.00% |
| Other | 0 | 0 | 0 | 0 | 0 | 0 | 0 | 0 | 0 | 0 | 0 | 0 |
| Pro Forma Profit and Loss | |||||||||||||
| Month 1 | Month 2 | Month 3 | Month 4 | Month 5 | Month 6 | Month 7 | Month 8 | Month 9 | Month 10 | Month 11 | Month 12 | ||
| Sales | $0 | $0 | $0 | $0 | $4,800 | $2,400 | $2,400 | $2,400 | $2,400 | $2,400 | $2,400 | $2,400 | |
| Direct Cost of Sales | $0 | $0 | $0 | $0 | $480 | $240 | $240 | $240 | $240 | $240 | $240 | $240 | |
| Other Production Expenses | $3,000 | $5,000 | $5,000 | $5,000 | $0 | $0 | $0 | $0 | $0 | $0 | $0 | $0 | |
| Total Cost of Sales | $3,000 | $5,000 | $5,000 | $5,000 | $480 | $240 | $240 | $240 | $240 | $240 | $240 | $240 | |
| Gross Margin | ($3,000) | ($5,000) | ($5,000) | ($5,000) | $4,320 | $2,160 | $2,160 | $2,160 | $2,160 | $2,160 | $2,160 | $2,160 | |
| Gross Margin % | 0.00% | 0.00% | 0.00% | 0.00% | 90.00% | 90.00% | 90.00% | 90.00% | 90.00% | 90.00% | 90.00% | 90.00% | |
| Expenses | |||||||||||||
| Payroll | $0 | $0 | $0 | $0 | $0 | $0 | $0 | $0 | $0 | $0 | $0 | $0 | |
| Sales and Marketing and Other Expenses | $2,100 | $2,100 | $2,100 | $2,300 | $200 | $100 | $100 | $100 | $100 | $100 | $100 | $100 | |
| Depreciation | $0 | $0 | $0 | $0 | $400 | $400 | $400 | $400 | $400 | $400 | $400 | $400 | |
| Leased Equipment | $0 | $0 | $0 | $0 | $0 | $0 | $0 | $0 | $0 | $0 | $0 | $0 | |
| Utilities | $400 | $400 | $400 | $300 | $100 | $100 | $100 | $100 | $100 | $100 | $100 | $100 | |
| Insurance | $300 | $0 | $0 | $0 | $0 | $0 | $0 | $0 | $0 | $0 | $0 | $0 | |
| Rent | $0 | $0 | $0 | $0 | $0 | $0 | $0 | $0 | $0 | $0 | $0 | $0 | |
| Payroll Taxes | 15% | $0 | $0 | $0 | $0 | $0 | $0 | $0 | $0 | $0 | $0 | $0 | $0 |
| Other | $0 | $0 | $0 | $0 | $0 | $0 | $0 | $0 | $0 | $0 | $0 | $0 | |
| Total Operating Expenses | $2,800 | $2,500 | $2,500 | $2,600 | $700 | $600 | $600 | $600 | $600 | $600 | $600 | $600 | |
| Profit Before Interest and Taxes | ($5,800) | ($7,500) | ($7,500) | ($7,600) | $3,620 | $1,560 | $1,560 | $1,560 | $1,560 | $1,560 | $1,560 | $1,560 | |
| EBITDA | ($5,800) | ($7,500) | ($7,500) | ($7,600) | $4,020 | $1,960 | $1,960 | $1,960 | $1,960 | $1,960 | $1,960 | $1,960 | |
| Interest Expense | $900 | $898 | $896 | $894 | $892 | $890 | $888 | $886 | $884 | $882 | $880 | $878 | |
| Taxes Incurred | $0 | $0 | $0 | $0 | $0 | $0 | $0 | $0 | $0 | $0 | $0 | $0 | |
| Net Profit | ($6,700) | ($8,398) | ($8,396) | ($8,494) | $2,728 | $670 | $672 | $674 | $676 | $678 | $680 | $682 | |
| Net Profit/Sales | 0.00% | 0.00% | 0.00% | 0.00% | 56.83% | 27.91% | 28.00% | 28.08% | 28.17% | 28.25% | 28.34% | 28.42% | |
| Pro Forma Cash Flow | |||||||||||||
| Month 1 | Month 2 | Month 3 | Month 4 | Month 5 | Month 6 | Month 7 | Month 8 | Month 9 | Month 10 | Month 11 | Month 12 | ||
| Cash Received | |||||||||||||
| Cash from Operations | |||||||||||||
| Cash Sales | $0 | $0 | $0 | $0 | $4,800 | $2,400 | $2,400 | $2,400 | $2,400 | $2,400 | $2,400 | $2,400 | |
| Subtotal Cash from Operations | $0 | $0 | $0 | $0 | $4,800 | $2,400 | $2,400 | $2,400 | $2,400 | $2,400 | $2,400 | $2,400 | |
| Additional Cash Received | |||||||||||||
| Sales Tax, VAT, HST/GST Received | 0.00% | $0 | $0 | $0 | $0 | $0 | $0 | $0 | $0 | $0 | $0 | $0 | $0 |
| New Current Borrowing | $0 | $0 | $0 | $0 | $0 | $0 | $0 | $0 | $0 | $0 | $0 | $0 | |
| New Other Liabilities (interest-free) | $0 | $0 | $0 | $0 | $0 | $0 | $0 | $0 | $0 | $0 | $0 | $0 | |
| New Long-term Liabilities | $0 | $0 | $0 | $0 | $0 | $0 | $0 | $0 | $0 | $0 | $0 | $0 | |
| Sales of Other Current Assets | $0 | $0 | $0 | $0 | $0 | $0 | $0 | $0 | $0 | $0 | $0 | $0 | |
| Sales of Long-term Assets | $0 | $0 | $0 | $0 | $0 | $0 | $0 | $0 | $0 | $0 | $0 | $0 | |
| New Investment Received | $0 | $0 | $0 | $0 | $0 | $0 | $0 | $0 | $0 | $0 | $0 | $0 | |
| Subtotal Cash Received | $0 | $0 | $0 | $0 | $4,800 | $2,400 | $2,400 | $2,400 | $2,400 | $2,400 | $2,400 | $2,400 | |
| Expenditures | Month 1 | Month 2 | Month 3 | Month 4 | Month 5 | Month 6 | Month 7 | Month 8 | Month 9 | Month 10 | Month 11 | Month 12 | |
| Expenditures from Operations | |||||||||||||
| Cash Spending | $0 | $0 | $0 | $0 | $0 | $0 | $0 | $0 | $0 | $0 | $0 | $0 | |
| Bill Payments | $223 | $6,757 | $8,398 | $8,399 | $8,267 | $1,661 | $1,330 | $1,328 | $1,326 | $1,324 | $1,322 | $1,320 | |
| Subtotal Spent on Operations | $223 | $6,757 | $8,398 | $8,399 | $8,267 | $1,661 | $1,330 | $1,328 | $1,326 | $1,324 | $1,322 | $1,320 | |
| Additional Cash Spent | |||||||||||||
| Sales Tax, VAT, HST/GST Paid Out | $0 | $0 | $0 | $0 | $0 | $0 | $0 | $0 | $0 | $0 | $0 | $0 | |
| Principal Repayment of Current Borrowing | $0 | $0 | $0 | $0 | $0 | $0 | $0 | $0 | $0 | $0 | $0 | $0 | |
| Other Liabilities Principal Repayment | $0 | $0 | $0 | $0 | $0 | $0 | $0 | $0 | $0 | $0 | $0 | $0 | |
| Long-term Liabilities Principal Repayment | $0 | $348 | $350 | $352 | $354 | $356 | $358 | $360 | $362 | $364 | $366 | $368 | |
| Purchase Other Current Assets | $0 | $0 | $0 | $0 | $0 | $0 | $0 | $0 | $0 | $0 | $0 | $0 | |
| Purchase Long-term Assets | $0 | $0 | $0 | $0 | $0 | $0 | $0 | $0 | $0 | $0 | $0 | $0 | |
| Dividends | $0 | $0 | $0 | $0 | $0 | $0 | $0 | $0 | $0 | $0 | $0 | $0 | |
| Subtotal Cash Spent | $223 | $7,105 | $8,748 | $8,751 | $8,621 | $2,017 | $1,688 | $1,688 | $1,688 | $1,688 | $1,688 | $1,688 | |
| Net Cash Flow | ($223) | ($7,105) | ($8,748) | ($8,751) | ($3,821) | $383 | $712 | $712 | $712 | $712 | $712 | $712 | |
| Cash Balance | $74,277 | $67,172 | $58,424 | $49,673 | $45,852 | $46,236 | $46,948 | $47,660 | $48,372 | $49,084 | $49,796 | $50,508 | |
| Pro Forma Balance Sheet | |||||||||||||
| Month 1 | Month 2 | Month 3 | Month 4 | Month 5 | Month 6 | Month 7 | Month 8 | Month 9 | Month 10 | Month 11 | Month 12 | ||
| Assets | Starting Balances | ||||||||||||
| Current Assets | |||||||||||||
| Cash | $74,500 | $74,277 | $67,172 | $58,424 | $49,673 | $45,852 | $46,236 | $46,948 | $47,660 | $48,372 | $49,084 | $49,796 | $50,508 |
| Other Current Assets | $750 | $750 | $750 | $750 | $750 | $750 | $750 | $750 | $750 | $750 | $750 | $750 | $750 |
| Total Current Assets | $75,250 | $75,027 | $67,922 | $59,174 | $50,423 | $46,602 | $46,986 | $47,698 | $48,410 | $49,122 | $49,834 | $50,546 | $51,258 |
| Long-term Assets | |||||||||||||
| Long-term Assets | $144,000 | $144,000 | $144,000 | $144,000 | $144,000 | $144,000 | $144,000 | $144,000 | $144,000 | $144,000 | $144,000 | $144,000 | $144,000 |
| Accumulated Depreciation | $0 | $0 | $0 | $0 | $0 | $400 | $800 | $1,200 | $1,600 | $2,000 | $2,400 | $2,800 | $3,200 |
| Total Long-term Assets | $144,000 | $144,000 | $144,000 | $144,000 | $144,000 | $143,600 | $143,200 | $142,800 | $142,400 | $142,000 | $141,600 | $141,200 | $140,800 |
| Total Assets | $219,250 | $219,027 | $211,922 | $203,174 | $194,423 | $190,202 | $190,186 | $190,498 | $190,810 | $191,122 | $191,434 | $191,746 | $192,058 |
| Liabilities and Capital | Month 1 | Month 2 | Month 3 | Month 4 | Month 5 | Month 6 | Month 7 | Month 8 | Month 9 | Month 10 | Month 11 | Month 12 | |
| Current Liabilities | |||||||||||||
| Accounts Payable | $0 | $6,477 | $8,118 | $8,116 | $8,211 | $1,616 | $1,286 | $1,284 | $1,282 | $1,280 | $1,278 | $1,276 | $1,274 |
| Current Borrowing | $0 | $0 | $0 | $0 | $0 | $0 | $0 | $0 | $0 | $0 | $0 | $0 | $0 |
| Other Current Liabilities | $0 | $0 | $0 | $0 | $0 | $0 | $0 | $0 | $0 | $0 | $0 | $0 | $0 |
| Subtotal Current Liabilities | $0 | $6,477 | $8,118 | $8,116 | $8,211 | $1,616 | $1,286 | $1,284 | $1,282 | $1,280 | $1,278 | $1,276 | $1,274 |
| Long-term Liabilities | $160,000 | $160,000 | $159,652 | $159,302 | $158,950 | $158,596 | $158,240 | $157,883 | $157,523 | $157,161 | $156,797 | $156,431 | $156,062 |
| Total Liabilities | $160,000 | $166,477 | $167,770 | $167,418 | $167,161 | $160,213 | $159,526 | $159,166 | $158,804 | $158,440 | $158,074 | $157,706 | $157,336 |
| Paid-in Capital | $60,000 | $60,000 | $60,000 | $60,000 | $60,000 | $60,000 | $60,000 | $60,000 | $60,000 | $60,000 | $60,000 | $60,000 | $60,000 |
| Retained Earnings | ($750) | ($750) | ($750) | ($750) | ($750) | ($750) | ($750) | ($750) | ($750) | ($750) | ($750) | ($750) | ($750) |
| Earnings | $0 | ($6,700) | ($15,098) | ($23,494) | ($31,988) | ($29,260) | ($28,590) | ($27,919) | ($27,245) | ($26,569) | ($25,891) | ($25,211) | ($24,528) |
| Total Capital | $59,250 | $52,550 | $44,152 | $35,756 | $27,262 | $29,990 | $30,660 | $31,331 | $32,005 | $32,681 | $33,359 | $34,039 | $34,722 |
| Total Liabilities and Capital | $219,250 | $219,027 | $211,922 | $203,174 | $194,423 | $190,202 | $190,186 | $190,498 | $190,810 | $191,122 | $191,434 | $191,746 | $192,058 |
| Net Worth | $59,250 | $52,550 | $44,152 | $35,756 | $27,262 | $29,990 | $30,660 | $31,331 | $32,005 | $32,681 | $33,359 | $34,039 | $34,722 |


