
Comgate
Executive Summary
Introduction
Comgate is a custom mill house specializing in creating architectural woodwork in the form of wall paneling, custom cabinets, and other products for the local residential market. After initial losses and several thin profit years of competitive bidding construction projects, Comgate is creating this business plan in order to bring its mission statement into clearer focus. Prior years were characterized by hectic efforts to bid as many jobs as possible. Margins were thin as pricing policy was “flexible” for fear that there would be insufficient work for production staff.
However, with the growth of sufficient sales, Comgate has the opportunity to create greater margins, increase efficiency, and improve overall profitability through long-overdue restructuring and focusing on our target market. These changes will assure more accuracy in pricing, billing, and tracking of costs for comparison purposes. Profits are expected to increase.
The Company
Comgate’s mission is to compete profitably in the high-end residential market for custom woodwork within the state of Connecticut. It will emphasize custom work of the highest quality, and specialize in the most demanding needs of new and remodeled designer homes in the $3 to $15 million price range.
Products
Comgate is engaged in custom architectural woodwork in the form of wall paneling, custom cabinets, molding, pilasters, radius units, circular staircases in special woods, elaborate dressing rooms, specialty kitchen work, etc. The recent addition of state-of-the-art CAD capability will help substantially to increase sales of higher-end products by targeting design professionals who are in a position to influence choices of subcontractors building “trophy” homes costing over $3 million. “Custom” is the key word at Comgate. The average home would not use our products. Custom woodworking of the type carried out by Comgate is made to order only. No finished goods are made up for stock. For this reason, there are rarely very long production runs.
The Market
The industry is mature and well-represented. There are many mill shops in the same market area which are focused on specialty areas. One mill shop may concentrate on custom furniture and form special alliances with upholstery shops. Other mill shops may specialize in standard kitchen cabinetry. Comgate is targeting the highest end of the residential market ($3-$15 million homes). This work is less price-sensitive and relatively steady, even during economic valleys. The most critical competitive weapon which the company holds at the moment is its CAD capability. The program is especially formulated to suit the custom woodwork market, and is expected to make substantial in-roads into the chosen highest end residential market. Comgate should be able to set itself apart from the competition, and be able to fully utilize its recently expanded production capacity.
With greater and greater demand for high-end trophy home construction, coupled with the increasing difficulty of attracting and keeping skilled workers, Comgate is moving toward linking its CAD capability with the practices of design professionals that will allow the company to out-source certain simpler parts in a project to other mill shops, while keeping the more demanding work for itself. Being able to present another mill shop with exact detailed CAD drawings, together with precise dimensions and material lists, will allow Comgate to increase sales and profits, and to concentrate on the more challenging custom woodwork products.
Financial Projections
The recent addition of over $110,000 in advanced new Computer Numerical Control (CNC) machinery, coupled with the building of an in-house industry-adapted Computer Aided Drafting (CAD) capability, will propel sales to nearly $800,000 by the end of Year 1, and $1.2 million by the end of Year 3. Profits will grow as well. A desire to shorten accounts payable in Year 2 to take advantage of all available trade discounts, together with rising receivables, will result in a short-term need for increased bank lines of credit of approximately $30,000.

1.1 Mission
Comgate’s mission is to compete profitably in the high-end residential market for custom woodwork within the state of Connecticut. We will emphasize on custom work of the highest quality, and specialize in the most demanding needs of new and remodeled designer homes in the $3 to $15 million price range.
1.2 Keys to Success
The most important keys to success in the contractors’ mill shop industry are:
- Avoid bidding projects which are likely to be awarded based primarily on price, projects being undertaken by those who are disreputable (no matter how badly the company needs work), projects which are too big (more than 20% of last year’s sales), or projects which do not fit the company’s niche market and thus unlikely to advance the company’s marketing strategy.
- Price the job correctly. This requires:
- Accurate take-off and listing.
- A clear understanding between the company and the client, in reference to quality and terms of payment.
- Correct calculation of material (including wastage) and labor required to complete the project.
- Correct application of overhead factors and profit margins, plus any special considerations.
- An administrative system supported by operating procedures that accurately tracks the job costing and compares the job as bid with the actual costs of completing the job. Constant adjustments to bid formulas.
- Reliable production staff that communicates well with administration to assure that the job is produced on time and as bid, making maximum efficient use of labor, materials, and available machinery.
1.3 Objectives
Comgate’s major objectives are:
- Increase production. Given the new machinery and four production staff, full productive capacity has been carefully measured. The goal is to reach, on a monthly basis, 80% of this capacity in the last quarter of Year 1, 85% in Year 2, and 90% in Year 3. This 80% of capacity translates into monthly production of 342 feet of crown molding, 22 pilasters, 54 doors of various grades, and 77 linear feet of cabinets (or some equivalent combination of these items). This will result in monthly sales of $60,816.
- A much simpler task is to maintain site contract workers (six) at present, full employment levels will generate monthly revenue of $34,623 which (after expenses) nets the company $21,794.
- Continue efforts to bring the company’s in-house CAD capability to the attention of more design professionals, especially those in Hartford, New Haven, Stamford, Norwalk, and Shelton, as these are the areas with the greatest concentration of the chosen $3 to $15 million residential homes.
- Join the Connecticut Chapter of the American Society of Interior Designers (ASID) as an industry partner as well as the Connecticut Society of Architects (CSA). Get listed in their resource directories.
- Complete the planned administrative changes to ensure that all work is properly billed, in a timely manner, and to ensure that jobs are correctly tracked so as to facilitate later cost comparisons with bid prices.
- Work to complete an operations manual that has been started.
Company Summary
After initial losses and several thin profit years of competitively bidding construction projects, Comgate has brought its mission statement into clearer focus. Prior years were characterized by hectic efforts to bid as many jobs as possible. Margins were thin as pricing policy was “flexible” for fear that there would be insufficient work for production staff. Now, the situation has changed. Now there is some fear of accepting too much work. This is a result of the company’s newly installed CAD capacity which melds nicely with the needs and realities of present day design professionals. Offering this service helps to channel the work to the company and pricing tends to be less cut-throat. With the increasing business, some long-overdue restructuring needs to be done in the administrative machinery. These changes will free up time so that the office manager can attend to more important administrative matters, and hopefully will assure more accuracy in pricing, billing, and tracking of costs for comparison purposes. Profits are expected to remain in the black and increase.

2.1 Company Ownership
Comgate is a limited liability S corporation wholly-owned by Andrew Comins. It was incorporated in 1996.
2.2 Company History
This chapter includes a standard chart and table of the company’s performance over the past few years.
Since a banker may wish to see more in-depth analysis of past performance, a copy of an Excel spreadsheet has been included in Appendix A. Analysis has been provided in five basic areas – Liquidity, Safety, Profitability, Balance Sheet and Operations Management. This compares Comgate’s 1999 financials with the results of all similar mill shops responding to a survey (October, 1999) conducted by the Architectural Woodworking Institute (AWI) in Reston, Virginia.
See Chapter 7.2 Key Financial Indicators for further analysis of past financial results.
Note: appendices A – K have been omitted from this sample plan presentation.

| Past Performance | |||
| 1997 | 1998 | 1999 | |
| Sales | $147,481 | $367,305 | $552,864 |
| Gross Margin | $73,591 | $218,102 | $313,702 |
| Gross Margin % | 49.90% | 59.38% | 56.74% |
| Operating Expenses | $162,547 | $195,639 | $260,251 |
| Collection Period (days) | 0 | 20 | 66 |
| Inventory Turnover | 4.80 | 35.10 | 9.90 |
| Balance Sheet | |||
| 1997 | 1998 | 1999 | |
| Current Assets | |||
| Cash | $25,563 | $13,763 | $3,988 |
| Accounts Receivable | $0 | $39,412 | $161,313 |
| Inventory | $7,949 | $14,337 | $6,500 |
| Other Current Assets | $1,650 | $0 | $0 |
| Total Current Assets | $35,162 | $67,512 | $171,801 |
| Long-term Assets | |||
| Long-term Assets | $107,624 | $113,484 | $140,203 |
| Accumulated Depreciation | $50,691 | $73,063 | $104,893 |
| Total Long-term Assets | $56,933 | $40,421 | $35,310 |
| Total Assets | $92,095 | $107,933 | $207,111 |
| Current Liabilities | |||
| Accounts Payable | $5,283 | $16,058 | $58,344 |
| Current Borrowing | $9,143 | $11,857 | $69,477 |
| Other Current Liabilities (interest free) | $3,829 | $25,288 | $10,000 |
| Total Current Liabilities | $18,255 | $53,203 | $137,821 |
| Long-term Liabilities | $161,433 | $125,720 | $99,179 |
| Total Liabilities | $179,688 | $178,923 | $237,000 |
| Paid-in Capital | $2,000 | $2,000 | $2,000 |
| Retained Earnings | ($637) | ($89,593) | ($65,014) |
| Earnings | ($88,956) | $16,603 | $33,125 |
| Total Capital | ($87,593) | ($70,990) | ($29,889) |
| Total Capital and Liabilities | $92,095 | $107,933 | $207,111 |
| Other Inputs | |||
| Payment Days | 30 | 39 | 89 |
| Sales on Credit | $147,481 | $367,305 | $552,864 |
| Receivables Turnover | 0.00 | 9.32 | 3.43 |
2.3 Company Locations and Facilities
The company is located in New Haven, Ct. in rented facilities. Total area is 2,500 square feet of which about 100 square feet is taken up with administration. Some expansion in the present facilities is possible by renting another 1,600 square feet of adjoining space. This plan assumes that this additional space will be added in January, 2000 at an increase of $2,000 in monthly rent.
A diagram of the production hall showing the location of the various major pieces of machinery is given in Appendix G.
Note: appendices A – K have been omitted from this sample plan presentation.
Products and Services
The products used in this plan were limited to only five items to simplify calculations. “Custom” is the key word. The average home would not use these items. Custom woodworking of the type carried out by Comgate is made to order only. No finished goods are made up for stock. For this reason, there are rarely very long production runs.
3.1 Product and Service Description
Comgate is engaged in custom architectural woodwork in the form of wall paneling, custom cabinets, molding, pilasters, etc. Although by nature of the word “custom” the milled products can be totally unique, the vast majority of products milled to date fall into only these few general categories. However, assuming success with the company’s marketing strategy, Comgate will move more up-market within the high-end residential market (see Chapter 4.0, Market Analysis Summary). Rather than produce ordinary high-quality casework, the company, for example, might produce a custom casework item in soft maple with an antiqued crackle finish designed to hide a stereo system. Radius units, circular staircases in special woods, elaborate dressing rooms and kitchens with a lot of curves would be further examples of challenging work that would be in line with stated strategy goals. More ordinary jobs would be accepted only if the jobs fit into the company’s out-sourcing guidelines. The recent addition of state-of-the-art CAD capability will help substantially to increase sales of higher-end products by targeting design professionals who are in a position to influence choices of subcontractors building “trophy” homes costing over $3 million.
3.2 Competitive Comparison
Performing a competitive comparison with products produced by other mill shops is not a simple task as the products are custom. There are no price lists. Financial comparisons can be made, however, with a group of mill shops (see Architectural Woodwork Institute AWI survey results in Appendix A). There are 12 mill shops in the New Haven area including Comgate. There may be one or two that are not members of AWI and therefore not listed in the membership directory. It is also known that some very large construction companies have their own in-house mill shops (see chapter on Industry Participants). Their present combined sales of all products sold to all home markets are approximately $12-$14 million annually. The market study estimates the total trophy home renovation and new construction market in Greater New Haven to be $127 million of which at least 10% is made up of custom wood millwork. This 10% or $12.7 million would seem to indicate that the demand from this market sector alone is equal to the total supply available to all market sectors. The demand clearly outstrips supply in respect to suppliers in New Haven for the demand in the area. Obviously, part of the demand must be being met by suppliers of high-end woodwork located outside New Haven.
Comgate is targeting the highest end of the residential market ($3-$15 million homes). This work is less price-sensitive and relatively steady, even during economic valleys. The most critical competitive weapon which the company holds at the moment is its CAD capability, which was developed by the person who is on contract to the company. The program is especially formulated to suit the custom woodwork market, and is expected to make substantial in-roads into the chosen highest end residential market.
Note: appendices A – K have been omitted from this sample plan presentation.
3.3 Sales Literature
At the present time no sales literature is available. Brochures of high quality will only be produced after production capacity has been expanded and success has been reached in filling the stated management teams gaps.
3.4 Fulfillment
All materials used in the company’s production are available from a number of local suppliers (primarily lumber dealers). Sourcing has never been an issue of concern.
3.5 Technology
Technology does play a part in this industry. Major custom woodworking machinery has incorporated time and labor-saving advantages of the computer age. Precision digital settings and the use of lasers make measurement faster and more exact. Comgate has added over $110,000 in new CNC equipment this year, which will allow the company to substantially increase production despite the limitations imposed by its rather small production hall. Comgate’s CAD department is an attractive addition which is already demonstrating success in image-building with interior designers and architects to the wealthy.
3.6 Future Products and Services
In the past, Comgate has produced custom wood products and has bid competitive jobs. The stated marketing direction of the company (see chapter on Target Market Segment Strategy) will move the product line more up-market by producing more challenging items, such as radius units, staircases, elaborate kitchens and libraries in exotic woods, etc. Some of the more mundane sections of a job will be out-sourced to other mill shops (simple paneling, etc.). Any profits from out-sourcing have not been reflected in the financials of this business plan.
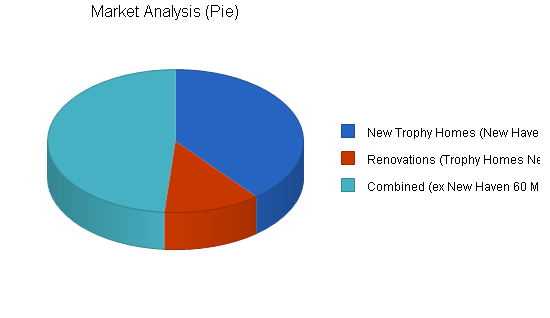
Market Analysis Summary
The highest end of the residential market is represented by the new construction and the renovation of “trophy” homes in the $3-$15 million price range. These homes, within the 781/617 area codes, have an annual need for custom woodwork products of approximately $13 million. An estimated further need of $12 million is generated by the same price range of private homes located outside the immediate area but within 60 miles of New Haven.
4.1 Market Segmentation
A market need for custom woodworking is generated by new construction and residential remodeling. For $1,295, a copy of a 350-page market study undertaken by Business Trend Analysts can be purchased. This study examines demand patterns in both new construction and home improvement markets. Figures on specific millwork products are included. Without this report, some statistics are generally available. The April, 2000 issue of Industrial Trends Report states that residential remodeling has reached $150 billion annually. “A healthy economy, a population increase, an aging housing stock, and more people owning their own homes are resulting in a boom for the remodeling industry,” says the president of the National Association of the Remodeling Industry (NARI). The Joint Center for Housing Studies at Harvard University (The Joint Center) reports approximately 25 million homeowners undertake some remodeling every year. There are about 800,000 remodeling contractors. The generations of people that especially impact the remodeling industry are:
- Baby Boomers: This includes anyone born between 1945 and 1964, comprising almost 45% of the American population. With large incomes and not enough time, Baby Boomers prefer to call contractors rather than to do it themselves. This is the strongest market for home improvements, according to NARI. This represents the greatest potential for high-end custom woodwork, primarily Baby Boomers with homes in the $3-$15 million category (referred to as “trophy homes”).
- Mature Market: These are individuals aged 55 and older who need their residences to be more efficient and comfortable to allow them to move around more easily. According to the American Association of Retired Persons (AARP), 75% of mature people own their own homes, and 83% do not want to move. The Joint Center reports that the typical elderly homeowner is twice as likely to undertake a replacement project than a younger homeowner. This sector does represent a market for Comgate, but only among the very wealthy, and considerably limited in respect to the Baby Boomers.
- Generation X: These are individuals born between 1965 and 1980 that tend to take their remodeling one step at a time due to lack of money, according to NARI. The Generation X-ers are, to a large extent, do-it-yourselfers. This group does not represent any market potential for Comgate.
According to U.S. Census figures, there are 127,080 new single family homes built annually in the Northeast, of which 15,500 were in Connecticut, and of those, 5,670 were in the New Haven area. With average single family home prices at $222,000 in 1999 (all U.S.), and probably closer to $350,000 or more in the Greater New Haven area, this translates into an annual expenditure of over $1.9 billion for new New Haven single family homes.
U.S. Census also reports that almost $14 billion is spent annually on improvements to existing single family homes in the East. Assuming the same percentage share for the New Haven area this means that 4.5%, or $627 million, was spent on major renovation excluding repair and maintenance. The above statistics indicate that for every dollar spent on new homes, $.31 is spent on major renovations to existing homes.
Since the major market for Comgate’s services is custom woodwork to very expensive single family homes in the price range of $3-$15 million, it is useful to know how many new homes are built annually in that price range in the greater New Haven area, and how many existing homes in that price range engage in major renovations. Research indicates over 300 single family homes in the New Haven area (area codes 781 and 617) in this price range actually changed hands in the past two years. Since major renovations generally are undertaken at the time of purchase, this would suggest that at least 150 homes valued at about $4.5 million each elect to have major renovations each year. $200,000 per renovation is not an unreasonable estimate for a renovation of a property in that price range. That amounts to annual renovations of the most expensive homes in the greater New Haven area of approximately $30 million (150 homes x $200,000). If we use the statistic of $.31 spent on existing home renovations for every dollar spent on new homes, that would indicate that $96 million is annually being spent on construction of new trophy homes in this price range in the New Haven area.
Another subsidiary market is the new trophy homes being built outside of New Haven (60 mile radius), as well as the major renovations for homes in the same price range. For example, 44 homes in the same price range ($3-$15 million) changed hands in Stanford alone during the past two years.
The Market Analysis Table shown below has omitted three zeros in all the numbers, for space reasons.
| Market Analysis | |||||||
| 2000 | 2001 | 2002 | 2003 | 2004 | |||
| Potential Customers | Growth | CAGR | |||||
| New Trophy Homes (New Haven) | 2% | 96,775 | 99,098 | 101,476 | 103,911 | 106,405 | 2.40% |
| Renovations (Trophy Homes New Haven) | 2% | 30,000 | 30,720 | 31,457 | 32,212 | 32,985 | 2.40% |
| Combined (ex New Haven 60 Miles) | 2% | 120,000 | 122,880 | 125,829 | 128,849 | 131,941 | 2.40% |
| Total | 2.40% | 246,775 | 252,698 | 258,762 | 264,972 | 271,331 | 2.40% |
4.2 Target Market Segment Strategy
In line with Comgate’s mission statement, the target market is trophy homes, both new construction as well as renovations. The results of our market study indicate that the total high-end trophy home market need for custom woodworking in the New Haven area outstrips the supply from available local custom woodworking suppliers. To compete in this market sector, Comgate has chosen a special service which is proving successful with design professionals. This CAD service is explained more fully in the chapter on Market Needs. All three high-end market sectors are in need of the custom millwork products supplied by Comgate. All of these construction projects, whether new construction or major renovation, will involve design professionals of the highest standards and clients with deep pockets. With properties of this caliber, the work is relatively recession-proof. These clients will have requests for custom woodworking products that are most challenging and thus most suited to Comgate’s expressed mission statement and abilities.
4.2.1 Market Trends
With greater and greater demand for high-end trophy home construction, coupled with the increasing difficulty of attracting and keeping skilled workers, Comgate’s move toward linking its CAD capability with the practices of design professionals will allow the company to out-source certain simpler parts in a project to other mill shops, while keeping the more demanding work for themselves. Being able to present another mill shop with exact detailed CAD drawings, together with precise dimensions and material lists, will allow Comgate to increase sales and profits, and to concentrate on the more challenging custom woodwork products.
4.2.2 Market Growth
Market growth of 2.4% is based on the actual growth rate in building permits in the East experienced in years 1997-99 as tabulated by the U.S. Census.
4.2.3 Market Needs
The new CAD service offered by Comgate evolved as a result of the inefficiencies which the company has observed in the past. One major problem in the past deals with blue-prints. Whichever construction company won the bid would send the blue-prints, let’s say for the kitchen, to custom wood mill shops to bid over. The mill shop will do its “take-offs” from the blue-prints and bid to do the kitchen. Later, the winner of the bid finds that the designed kitchen cabinets will not fit into the room. This results in expensive problem-solving and meetings with architects. The architects themselves do not understand the way in which woodworkers build cabinets, so often the architects’ design concepts are made more difficult (and thus more expensive) to realize. The new CAD service offered by Comgate circumvents all of this. By working together with the architect at the initial stages, the architect only needs to do the inexpensive design concepts. The actual details of how the cabinet is structurally designed, as well as the exact measurements to fit the room, are left to Comgate’s CAD person. The architect can save money on drafting, save again by eliminating the usual problem-solving and re-drafting. The client of the architect also saves by insuring that the woodwork is done in a way that suits the latest woodworking methods without interfering with the design concept — the look of the final product. A further advantage is that Comgate saves the expense of on-site measuring.
4.3 Service Business Analysis
The industry is mature and well-represented. There are many mill shops in the same market area. Mill shops have traditionally focused on specialty areas. This often happens as a result of the type of woodworking that the shop owner likes to do or as a result of his previous background as an employee in another mill shop. One mill shop may concentrate on custom furniture and form special alliances with upholstery shops. Another mill shop may specialize in what is termed “fast-track,” targeting large scale construction companies who might be building a 100 unit condominium complex and need the woodworking element completed inside of 60 days. Other mill shops may specialize in standard kitchen cabinetry. They will produce without regard to the ultimate user using fast production line techniques. By concentrating on the highest end of the residential market and coupling this with its CAD expertise, Comgate should set itself apart from the competition, and be able to fully utilize its recently expanded production capacity.
4.3.1 Distributing a Service
The traditional pattern in this industry is for: an architect to draft the plans according to the specifications, copies given to contractors to bid on, and elements, such as mill work, subcontracted to mill shops who also make competitive bids.
Through Comgate’s marketing strategy, this traditional distribution pattern will be altered to the benefit of everyone concerned. The architect will save on the design drafting (and redrafting), the contractor does not have to worry about change orders to the same degree, because he can feel confident that the desired woodwork will fit the room as built, and Comgate will not have to be as price-sensitive in getting the work. Comgate’s connection to the design professional will assure that the work goes to him rather than being sent to competitive bidding.
4.3.2 Business Participants
The table below lists major competitors in our immediate area. Appendix B is a map marked with red dots indicating the location of mill shops in the Greater New Haven area. None of these mill shops has the same level of CAD capability and few have singled out the trophy home market as their prime focus.
Competing Mill Shops
|
NAME |
LOCATION |
ANNUAL SALES |
EMPLOYEES |
|
Ace Milling Co. |
East Haven |
$2-5 million |
20 |
|
Hamden Woodworks, Inc. |
Hamden |
$2-5 million |
15 |
|
Appleton Woodworking |
Orange |
$.5-2 million |
10 |
|
Woodstock Corp |
Gullford |
$.5-2 million |
17 |
|
Custom Design Woodwork |
Bramford |
$0-.5 million |
4 |
|
J. Peterman Woodworking |
Woodbridge |
$.5-2 million |
7 |
|
Comgate |
New Haven |
$0-.5 million |
7 |
|
Bethany Woodworking |
Bethany |
$0-.5 million |
7 |
|
Kaufman Cabinets |
Branford |
$0-.5 million |
7 |
|
Sagesmith Woodwork |
Hartford |
$0-.5 million |
4 |
|
The Joinery Shop |
Woodburn |
$0-.5 million |
5 |
|
Castle Architectural |
Springfield |
$.5-2 million |
20 |
Note: appendices A – K have been omitted from this sample plan presentation.
Strategy and Implementation Summary
Inroads into the stated trophy home market in the Hartford area will be made by contacting and selling Comgate’s new CAD features to those architects and interior designers who are best known for residential work in this price range ($3-$15 million), by sticking to the company’s newly formulated costing/pricing method, and following through on the recent administrative control and reporting changes.
5.1 Sales Strategy
After having successfully priced the job to insure an adequate profit margin after all expenses, it is important to close and bring back the sale. The person to do this is the owner himself, Andrew Comins. To free up his time to network with design professionals it is important that he be able to rely on his office manager to administer properly in his absence (see the chapter on Management Team) and he must be able to rely on a production manager for proper flow in the plant (see Chapter on Management Team Gaps).
The most important aspects to be considered in closing the sale are:
- Clearly stating in the proposal the scope of the work.
- Clearly stating when: both must understand what the schedule is.
- Both parties have to agree to the terms of payment.
- The price must be clear, as well as what is included and what is not.
The proposal must get there on time and get to the right place. A log should be kept of all bidding efforts. Follow up is necessary.
5.1.1 Sales Forecast
There are two sources of revenue:
Plant Produced Sales: This revenue comes from manufacturing custom cabinetry, paneling, and other wood products. To project revenue we have chosen several representative items that make up the majority of plant produced sales. The materials for each of these items have been carefully calculated, as has the labor hours going into each item. The material inputs will show up in the direct cost of each item. The labor hours information allow us to determine how many items we can produce with given manpower and machinery. The cost of the labor is calculated in detail in the Personnel Plan Table. As this plan is being written in October, 2000, the actual sales revenue from January through September will be averaged to arrive at a monthly amount for that period. Projected sales will begin as of October, 2000. The representative items chosen are:
- 250 linear feet of Crown Molding
- 16 Pilasters
- 20 Haunched passage doors (paint grade)
- 20 Haunched passage doors (stain grade)
- 45 linear feet of cabinets
The Costing/Pricing Work-up Sheet in Appendix C will break down, in detail, the various materials going into each of these items, as well as the labor hours for each. Labor break-downs for each phase in the production of these items is also included. For example, the Crown Molding (250 linear ft.) requires a total of 4.25 man hours and only one material. The Pilasters however needs two materials in different quantities. Since 4 man hours per pilaster are needed (see labor break-down sheet), 16 pilasters will require a total of 64 man hours. These 64 man hours have been split equally between the two materials (8/4″ Mahogany and the 4/4″ Mahogany). From the totals in Appendix C the total labor input for the above items is 390.4 hours. Since production is limited to 160 manhours per week (8,000 manhours per year), these above-listed items can only be produced 20.5 times in one year. Total yearly full production, assuming only these items are produced, would be:
- 5,125 linear feet of Crown Molding
- 328 Pilasters
- 410 Haunched passage doors (paint grade)
- 410 Haunched passage doors (stain grade)
- 922.5 linear feet of cabinets
These items have been projected in the attached table on a monthly basis beginning October, 2000 and on a yearly basis for years 2001 and 2002 assuming 80% of full production October-December, 2000, 85% in 2001, and 90% of full production efficiency in year 2002.
Contract Site Labor: Revenue is also derived from providing carpenters/installers at certain work sites. There are six site workers listed with an “S” next to their name. Below are listed the all-in costs of these workers as well as the rates that they are billed out at.
| Worker | All-In Wage Rate | Bill Rate | Hours | Net Revenue |
|
1. |
$34.38 | $39.00 | 1,960 | $9,055.20 |
|
2. |
$30.00 | $36.00 | 1,960 | $11,760.00 |
|
3. |
$22.00 | $31.00 | 1,960 | $17,640.00 |
|
4. |
$30.03 | $36.00 | 1,960 | $11,701.20 |
|
5. |
$25.00 | $34.00 | 1,960 | $17,640.00 |
|
6. |
$24.71 | $36.00 | 1,960 | $22,128.40 |
| Totals | 11,760 | $89,924.80 |
Total net revenue from Site Services comes to $89,924.80 annually assuming a full 40 hour week for 49 weeks. For projection purposes we have chosen “hours” as the unit. The average sales price is $35.33. The average cost is $27.69.
Note: appendices A – K have been omitted from this sample plan presentation.

| Sales Forecast | |||
| 2000 | 2001 | 2002 | |
| Unit Sales | |||
| Crown Molding | 4,239 | 4,356 | 4,612 |
| Pilasters | 219 | 279 | 295 |
| Haunched Passage Doors (Paint Grade) | 234 | 348 | 369 |
| Haunched Passage Doors (Stain Grade) | 234 | 348 | 369 |
| Cabinets | 591 | 785 | 831 |
| Site Work | 7,647 | 11,760 | 11,760 |
| Other | 0 | 0 | 0 |
| Total Unit Sales | 13,164 | 17,876 | 18,236 |
| Unit Prices | 2000 | 2001 | 2002 |
| Crown Molding | $4.02 | $4.00 | $4.00 |
| Pilasters | $316.96 | $316.96 | $316.96 |
| Haunched Passage Doors (Paint Grade) | $592.35 | $592.35 | $592.35 |
| Haunched Passage Doors (Stain Grade) | $783.09 | $783.09 | $783.09 |
| Cabinets | $194.76 | $194.76 | $194.76 |
| Site Work | $35.33 | $35.33 | $35.33 |
| Other | $0.00 | $0.00 | $0.00 |
| Sales | |||
| Crown Molding | $17,027 | $17,424 | $18,448 |
| Pilasters | $69,414 | $88,432 | $93,503 |
| Haunched Passage Doors (Paint Grade) | $138,610 | $206,138 | $218,577 |
| Haunched Passage Doors (Stain Grade) | $183,243 | $272,515 | $288,960 |
| Cabinets | $115,103 | $152,887 | $161,846 |
| Site Work | $270,169 | $415,481 | $415,481 |
| Other | $0 | $0 | $0 |
| Total Sales | $793,566 | $1,152,876 | $1,196,815 |
| Direct Unit Costs | 2000 | 2001 | 2002 |
| Crown Molding | $2.00 | $1.82 | $1.82 |
| Pilasters | $48.25 | $44.09 | $44.09 |
| Haunched Passage Doors (Paint Grade) | $142.05 | $130.53 | $130.53 |
| Haunched Passage Doors (Stain Grade) | $269.76 | $247.88 | $247.88 |
| Cabinets | $62.40 | $57.66 | $57.66 |
| Site Work | $25.74 | $27.69 | $27.69 |
| Other | $0.00 | $0.00 | $0.00 |
| Direct Cost of Sales | |||
| Crown Molding | $8,486 | $7,928 | $8,394 |
| Pilasters | $10,566 | $12,301 | $13,007 |
| Haunched Passage Doors (Paint Grade) | $33,240 | $45,424 | $48,166 |
| Haunched Passage Doors (Stain Grade) | $63,123 | $86,262 | $91,468 |
| Cabinets | $36,878 | $45,263 | $47,915 |
| Site Work | $196,871 | $325,634 | $325,634 |
| Other | $0 | $0 | $0 |
| Subtotal Direct Cost of Sales | $349,165 | $522,813 | $534,584 |
5.2 Marketing Strategy
The marketing strategy, as explained in other chapters, is to leverage Comgate’s special CAD capability, as it relates specifically to custom woodworking, with design professionals (interior designers and architects) to increase the type of high-end work taken on, as well as to “jump” the bidding process by creating a situation in which Comgate must be given the bid. A good place to ask for the names of the interior designers with the best reputations is to speak to the designer workrooms. These are the workrooms that carry out the work connected with interior designers’ concepts for window treatments, fabrics, etc.
The best known of these workrooms in and around New Haven are:
- Fall Creek Sewing.
- Andrew Smith.
- Fortress Lines.
- Jones & Jones.
- Forefront.
- S. Brandt & Company.
- Tapper Works.
A polling of these workshops indicates the following interior designers are often sought by trophy home owners:
** Names have been removed for confidentiality.
Architects are another important group of design professionals that work in concert with interior designers on trophy homes. The latest edition of the Directory of Architectural Firms in Connecticut is available to the members of the CSA. The directory lists 750 architectural firms in Connecticut. Details of each company are given alphabetically, including location and phone numbers as well as the type of work the firm specializes in. The back of the directory gives a listing based on areas of practice. The category of “Residential Work” lists about 300 firms. Although an architectural firm is likely to have work outside of the city where it is located, it would be a good start to find out which of those 300 residential architects are located in those areas of New Haven with the greatest concentration of trophy homes.
5.2.1 Positioning Statement
Comgate’s CAD capability is an especially strong marketing tool. It allows the mill shop to build the desired items using the most practical methods of construction without interfering with the design concept. It automatically calculates the exact dimensions of each element and produces exact material lists. These features allow simpler elements to be subcontracted to other mill shops, thus allowing the company’s productive capacity to be used to produce the higher end elements.
By pushing this capability with architects who have reputations for designing homes in the $3-$15 million bracket, Comgate will position itself to receive the gravy of this price-insensitive, recession-proof work, while at the same time building an image for the highest quality, most-challenging work.
5.2.2 Pricing Strategy
Simply stated, the goal of the bidding process is to price to get the job while still making an adequate profit. To facilitate this, a dual mark-up system has been developed. One mark-up for materials and another for labor. The reason for the separate mark-ups is that in custom woodwork the mix, or ratio, of material and labor changes with every job. Therefore, a system is needed that accommodates the variations. The system is fairly straightforward and uncomplicated and, once set up, it reduces the bidding process’ complexity. The system requires two separate overhead factors to be computed–an administrative overhead and a factory overhead.
Administrative Overhead
The concept is founded on the belief that everything which is sold, whether goods or services, must pay its fair share of the administrative overhead. Whether we use material in manufacturing a product, or merely resell it as is without further processing, it should still make a contribution. So a multiplier factor is calculated and applied to everything sold including direct labor, plant-processed materials, “buy-outs” (out-sourcing to another mill shop), installations, etc.
The administrative overhead mark-up factor is arrived at by dividing the total administrative overhead expenses by the total of materials and direct labor. Appendix B shows the calculations based on expenses in 1999. Total administrative overheads were $123,821. Total direct labor and materials came to $324,495. The resulting .3816 translates into a multiplier factor of 1.3816. By applying this to everything sold it means that the company is setting aside 27.6% of every dollar to cover the cost of bidding, the cost of paperwork to execute the job, the cost of collecting the money, the cost of interest if the money’s late, etc.
Plant Overhead
This mark-up is only applied to labor. It’s calculated by dividing plant overhead costs by direct labor. The resulting .837 when added to the .3816 (administrative overhead) builds to a multiplier factor of 2.218 (1.00 + .3816 + .837 = 2.218). The reasoning here is that an item sold that involves plant-processed labor should contribute to defray a portion of those plant overhead expenses (machinery depreciation, insurance, machinery maintenance, etc.) that would not be there if everything were merely sold without any value-added milling by factory millworkers.
With application of the above-described overhead factors, pricing is now reduced to calculating the total materials (including wastage) involved in a job, and projecting the labor input in hours needed to complete the job. Assisting in these calculations is a Job Costing Library which lists the actual materials and the actual labor input involved in similar past jobs. (See a sample section of the Job Costing Library in Appendix C.)
Performing the “take-offs” from blue prints and converting this to materials and labor hours needed to complete the job requires skill, but once this has been done, those figures can be passed on to an administrative assistant who can apply the overhead mark-ups to materials and labor. One can also check the latest prices of the materials as well as the up-dated all-in man-hour rates. (See Appendix D for a schematic of all-in wage rates.)
Up to this point in the pricing process all that we have done is to calculate the actual all-in costs of both materials and labor and added on formulas to cover overhead costs–both administrative and plant. It is a necessary stage in the pricing process to plan in, and insist on, a profit margin. Although industry averages are less since averages include those suffering losses, successful woodworkers do attain a 15% sustainable net profit. Adding 15% to anticipated costs is not going to achieve a net 15% result (15 divided by 115 is only 13%). The best way is to divide total anticipated costs (after application of the two overhead factors) by .85.
To facilitate the costing/pricing, an Excel spreadsheet has been designed to incorporate the process including the two overhead factors as well as the 15% profit mark-up. Appendix E is a sample of the Costing/Pricing Work-up Sheet for a representative job. This spreadsheet also has a database capability. It allows the user to access statistics to facilitate material bulk purchasing, etc.
Note: appendices A – K have been omitted from this sample plan presentation.
5.2.3 Promotion Strategy
With the introduction of an in-house CAD capability that is especially designed for the mill shop industry, the best way to spread the word is to directly contact the architects and interior designers. Only one or two trophy homes in the targeted $3-$15 million range can keep a mill shop fully occupied for months. Advertising is not expected to become necessary. However, joining the ASID and the CSA as an “Industry Partner” is an excellent way to network with design professionals. Also it would be helpful to get listed in the Resource Directories of each of these organizations.
5.3 Strategic Alliances
It is planned that Comgate will establish strategic alliances with several mill shops who will mutually profit from an association. Exact drawings and cut lists can be given to other mill shops when subcontracting the more mundane items, leaving the more challenging work for Comgate. Even the data on disk to program CNC equipment at the subcontracting mill shop can accompany the exact drawings, allowing a fast and accurate set up. Profits from work performed through these alliances has not been considered in preparing this business plan, but when the plan is updated in 2001, there should be enough historical experience with these alliances to include this aspect in projections.
5.4 Milestones
The table below outlines the strategic milestones for Comgate for the coming years.
| Milestones | |||||
| Milestone | Start Date | End Date | Budget | Manager | Department |
| Complete Administrative Control Changes | 10/1/2000 | 11/30/2000 | $500 | A. Comins | Management |
| Complete Procedures Manual | 10/1/2000 | 10/1/2001 | $0 | A. Comins | Management |
| Join ASID and CSA | 11/1/2000 | 12/30/2000 | $4,000 | A. Comins | Management |
| Get Certification by AWI | 11/1/2000 | 11/1/2001 | $1,000 | A. Comins | Management |
| Hire Production Manager | 4/1/2001 | 5/1/2001 | $60,000 | A. Comins | Management |
| Totals | $65,500 | ||||
Management Summary
Like other mill shops with less than $1 million in sales, the owner of Comgate has had to wear several hats and shuttle back and forth between production, site visits, the office, and client calls. The company is in the process of making major strides in establishing a more classical managerial structure, as the following chapters will explain.
6.1 Organizational Structure
Ideally, the owner of the mill shop should have three major functions:
- Identify and find customers.
- Maintain proper balance of people, plant and machines.
- Innovate, and set policies.
A plant manager should be responsible to see that the production staff and the available machinery work together at maximum efficiency. He needs to anticipate questions, answer them, and keep production rolling with a minimum of waste and a minimum of down-time. The CEO is now doing that when he is available.
An office manager should handle all the administration and coordinate well between the plant manager and the CEO. A need for the plant manager is well recognized by management, but a certain financial position needs to be reached to afford him. This position is planned to start in April, 2001, which will help substantially to free up needed time for the CEO to carry out the above listed major duties.
The office manager has, until recently, been performing the bookkeeping. This has taken up too much of his time, plus he is not trained in accounting practices. It has taken until July to get tax filing done, and at a heavy cost in accountant’s charges. This has since been handed over to J&R Associates. Procedures have been set up which will serve as a beginning for a procedures manual. A courier is sent each week from J&R Associates to track all costs associated with a job. This is absolutely essential because without this reliable feedback, one can never be sure how accurate the job cost estimates are when putting together a bid. The handling of inventory is also dealt with in the procedures as well as paperwork flow to insure correctness in billing. A costing/pricing scheme has been devised to assure correct all-in costing and to insure that a fair profit margin is built in to the pricing.
The recent addition of a contract CAD man, has helped to ease the work load on the CEO, as there are fewer questions from production staff as a result of the very accurate drawings and cut lists.
6.2 Management Team
The management team, after the addition of the production manager in April, 2001, should be complete until a higher level of sales has been reached. At a level of approximately $1.5 million in sales, Comgate should add a project manager.
6.3 Management Team Gaps
At the present time, a production manager is needed. Without him, the CEO cannot devote enough of his time to CEO issues (see Chapter on Organization Structure). It would have been ideal to promote one of the production staff to that position, but none of the present four workers is suitable for the position. It is hoped that a production manager can be found by April, 2001. His salary and benefits have been provided for in the projections.
Another gap is project manager. The company needs to grow to be able to afford him. The project manager would follow everything from the point of “hand-off” (once the bid has been won) through conclusion. He would confer with architects, handle change orders, examine every facet: warranties, retainage, final payment, punch lists, access to premises, lifts and hoists, check everything. At the moment the CEO is doing this as best he can with the many other matters on his plate. The position of project manager becomes increasingly important when the company has multiple projects.
6.4 Personnel Plan
Milling Costs Personnel:
As of the writing of this plan, sales orders are strong and all four production staff are expected to be fully employed on a 40-hour/week basis. For the period of January through September, an average monthly labor amount will be entered based on the totals from the financials as of the end of September. A production manager/project manager has been projected beginning April, 2001, at an annual salary of $60,000 (see Chapter on Management Team Gaps).
Sales and Marketing:
Andrew Comins’s salary of $40,000 is entered here although he is general manager/owner. He will continue to wear several hats until a plant manager and a project manager can be found.
General and Administrative Personnel:
The office manager, **Stacy Greer, earns $34,320 per year.
** Names have been changed for confidentiality.
| Personnel Plan | |||
| 2000 | 2001 | 2002 | |
| Production Personnel | |||
| **David Malkinson | $39,066 | $41,604 | $41,604 |
| **Simon Lang | $37,335 | $34,680 | $34,680 |
| **Brian Mason | $8,670 | $34,680 | $34,680 |
| Production/Project Manager | $0 | $45,000 | $60,000 |
| **Charles Davidson | $38,355 | $38,760 | $38,760 |
| Subtotal | $123,426 | $194,724 | $209,724 |
| Sales and Marketing Personnel | |||
| Andrew Comins | $39,996 | $40,000 | $40,000 |
| Other | $0 | $0 | $0 |
| Subtotal | $39,996 | $40,000 | $40,000 |
| General and Administrative Personnel | |||
| **Stacy Greer | $34,320 | $34,320 | $34,320 |
| Other | $0 | $0 | $0 |
| Subtotal | $34,320 | $34,320 | $34,320 |
| Other Personnel | |||
| Name or Title | $0 | $0 | $0 |
| Other | $0 | $0 | $0 |
| Subtotal | $0 | $0 | $0 |
| Total People | 6 | 7 | 7 |
| Total Payroll | $197,742 | $269,044 | $284,044 |
Financial Plan
Due to initial losses, resulting in a need to resort to shareholder loans, cash flow pressures caused accounts payable to be stretched out to 30 days and more. The financial projections have reduced this to 10 days for the year 2001 and beyond, in hopes of filling this gap with increased bank lines of credit. This would allow the company to take advantage of trade discounts. Failing to do so is expensive, as it becomes the most expensive form of credit (approximately 36% p.a.).
7.1 Important Assumptions
Personnel Burden:
The hourly basic wage rates were totalled ($241.73) as were the total after FICA, State Unemployment, FUTA and health benefits ($291.66). The difference came to 21%. The actual burden of 21.95% is from the September, 2000 financials.
Interest Rates:
Looking at the various rates in effect (see Cash flow Section), 9% was taken as an average rate.
Payment Days:
In order to show the cash flow effect we elected to assume 10 days so as to take advantage of all trade discounts. This change from 30 days to 10 days will take place in 2001. The cost of not taking the discounts is nearly 36% per annum. It is preferred to finance negative cash flow through bank lines of credit.
Collection Days:
Collection days, after netting out down-payments with orders, average approximately 30 days.
Tax Rate:
The tax rate reflects the present sliding scale:
| Profits | Federal | State |
| $0 to $50,000 | 15% | 9.5% |
| $50,000 to $75,000 | 25% | 9.5% |
| $75,000 to $100,000 | 34% | 9.5% |
| $100,000 to $335,000 | 39% | 9.5% |
| $335,000 and up | 34% | 9.5% |
| General Assumptions | |||
| 2000 | 2001 | 2002 | |
| Plan Month | 1 | 2 | 3 |
| Current Interest Rate | 10.00% | 10.00% | 10.00% |
| Long-term Interest Rate | 9.00% | 9.00% | 9.00% |
| Tax Rate | 25.42% | 25.00% | 25.42% |
| Other | 0 | 0 | 0 |
7.2 Break-even Analysis
The break-even chart is not suitable for multiple custom woodwork items. However, if we use pilasters as an example, the unit price is $316.96 and the unit cost is $44.09 (material cost). If we assume that all plant labor is fixed, whether there is work for the staff or not, it would be necessary to produce and sell 136 pilasters per month. According to best estimates, one pilaster takes four man hours. With 8,000 man hours per year (666 man hours monthly) it is possible to produce 167 pilasters. So, to break even on pilasters alone it would be necessary to work at 81% of capacity.
If, instead, we take cabinets, and use a cost price of $57.66 per Linear Foot LF and a price of $194.76 per LF it would be necessary to produce 270 linear feet of cabinets monthly. At 1.65 man hours per LF, it would be possible to produce 404 linear feet. Break-even on cabinets needs 67% of capacity.
Doors (cope and stick) cost $130.53 per unit and sell for $592.35. Each door takes five hours to produce. It would require 80 doors to break even, out of a maximum capacity of 133 doors. This would be 60% of capacity to break even.
All other things being equal, based on the above analysis, it would be more profitable to produce doors than cabinets, and likewise more profitable to produce cabinets than pilasters.
In the calculations above, it has been assumed that there is no problem in keeping the six site carpenters working full time. The net profit from this activity has been deducted from fixed expenses. If, instead, we assume that the company makes no money on-site services, the monthly expenses would be $89,925 higher. In this case, it would take 96 doors monthly, rather than only 80, to break even.

| Break-even Analysis | |
| Monthly Units Break-even | 521 |
| Monthly Revenue Break-even | $31,432 |
| Assumptions: | |
| Average Per-Unit Revenue | $60.28 |
| Average Per-Unit Variable Cost | $26.52 |
| Estimated Monthly Fixed Cost | $17,602 |
7.3 Key Financial Indicators
As mentioned in the chapter on Company History, a more in-depth analysis of past performance is listed on an Excel spreadsheet in Appendix A. The top two rows summarize 1999 and 1998 financial sheet information in an easy to read format. These categories of information are then used to calculate important ratios to compare Comgate results will industry averages. The ratios have been organized into five main groups: Liquidity, Safety, Profitability, Balance Sheet, and Operations Management. Brief comments are made below concerning these ratio comparisons:
Liquidity:
Liquidity decreased from 1.27 in 1998 to 1.19, due entirely to a large project on Orange. The large commercial contractor involved took far longer to pay than was anticipated. The project has since been completed and all outstandings have been settled. Despite the 1.19 current ratio for 1999, it is still superior to the average of 1.01 for all AWI members and fairly close to those members in the Northeast Region (1.24).
Safety:
The debt-to-equity ratios have been calculated reflecting certain adjustments. Owner loans have been removed from long-term liabilities and placed into equity. The Debt/Equity ratio for 1999, of 11 to 1, is far higher than the average. It reflects the early start-up losses; however, the leverage improved remarkably from 1998, when it was 25 to 1.
Profitability:
The gross margins are substantially higher than the average, which reflects the higher-end nature of the company’s work. Operating profit saw a healthy increase from 6.12% in 1998, to 9.67% in 1999. This is not as good as the operating results of the top 25% of AWI members (22.4%) but still more than double the margin for all AWI members (4.2%).
Balance Sheet:
The ratio of Sales to Net Fixed Assets is a good measure of efficiency. Comgate’s ratio of 9.53 is not only a substantial increase over 1998, but is nearly equal to the top 25% of all AWI member results. Obviously the very high operating results to equity ratio merely reflects the narrow equity situation. The same can be said for the fixed assets to equity ratio. The A/R turnover (in days) as well as the A/P days turnover were slowed by the above-mentioned large Orange project. The low inventory days turnover reflects the proportionally lower material content of the high-end business.
Operations Management:
The most remarkable ratio in this group of ratios is the very high percentage of non-plant produced sales to total sales. This reflects the revenue from outside on-site subcontracted carpenters and installers.
Note: appendices A – K have been omitted from this sample plan presentation.

7.4 Projected Profit and Loss
Other Expenses (CoGS): There are several expenses that are included here:
- Shop supplies run about $300 per month.
- Fire insurance for machinery runs $209.55 monthly.
- Storage space rental costs $105 monthly.
- Factory rental is $1,958 monthly of which 90% ($1,762) is allocated to CoGS. The remaining $196/month is charged to General and Administrative expenses. Beginning in January, we assume a doubling of rental space will be made available at a monthly cost of $2,000.
- Repairs and maintenance comes to about $272 per month.
- The company truck costs approximately $200 monthly.
- Utilities (electricity, waste removal, and security) come to $267 monthly. They are applied 90% to plant ($240 monthly).The other 10% ($27 monthly) is charge to General and Administrative expenses.
- Take-offs and listing, the CAD contract employee, costs $70/hr and works 35 hours weekly. Most of this expense (60%) can be charged to the client and is a wash. The remainder ($49,000) is split 60% for Plant ($29,400) which is $2,450/month starting in September 2000.
- The remaining $19,600 is charged to General and Administrative expenses.
These CoGS expenses come to to $3,088.55 (January-August) and $5,538.55 per month after August, 2000. Beginning January, 2001 the total grows to $7,538 due to the increased space and rent.
Sales and Marketing Expenses:
- Andrew Comins’s salary is included here at $40,000 annually.
- Travel expenses were doubled in projections, and average $100 monthly.
- Advertising and promotional expenses have not been projected because production is now at 100% capacity and is expected to stay that way due to the marketing strategy of approaching designers and architects directly, stressing the company’s CAD strengths.
General & Administrative:
- Utilities (allocated 90% to plant and 10% in administration) come to $27 monthly.
- Since the building is rented, the only insurance is for the contents which are primarily machines. This has been expensed totally in plant overheads, since the office furniture and equipment is small in relation to plant machinery.
- Rent has been allocated 90% to plant and only 10% ($196/monthly) to administration based on square footage.
- The contract/consultants category includes tax preparation, business planning and up-dating, and bookkeeping expenses. The bookkeeper ($450 weekly) beginning in September, which was unusually high for this year should be reduced in future years to about $2,000 annually, now that a professional bookkeeping company has been engaged. The business plan will run about $7,000 in year 2000 and about $2,000 yearly thereafter.
- CAD charges, which have not been allocated to plant overheads, amount to $19,600 annually or $1,633 monthly beginning in September, 2000. Actual CAD costs are much higher, but it is assumed that 60% of CAD charges can be passed on the client and are a wash. Only 40% of these charges are reflected in the income statement (mostly in plant COGS).
- Since over $110,000 in new fixed assets were added during 2000, no further capital additions are planned for 2001 and 2002. Depreciation will remain at 2000 levels.
- Dues and subscriptions have been left at historical levels ($450 monthly).
- Fees and Permits have also been kept at historical levels ($390 monthly).
- Office Supplies have been projected at historical levels of $346 monthly.
- Bank charges of $40 monthly.


| Pro Forma Profit and Loss | |||
| 2000 | 2001 | 2002 | |
| Sales | $793,566 | $1,152,876 | $1,196,815 |
| Direct Cost of Sales | $349,165 | $522,813 | $534,584 |
| Production Payroll | $123,426 | $194,724 | $209,724 |
| Other | $46,868 | $90,468 | $90,468 |
| Total Cost of Sales | $519,459 | $808,005 | $834,776 |
| Gross Margin | $274,108 | $344,871 | $362,039 |
| Gross Margin % | 34.54% | 29.91% | 30.25% |
| Operating Expenses | |||
| Sales and Marketing Expenses | |||
| Sales and Marketing Payroll | $39,996 | $40,000 | $40,000 |
| Advertising/Promotion | $0 | $0 | $0 |
| Travel | $750 | $1,200 | $1,200 |
| Miscellaneous | $0 | $0 | $0 |
| Total Sales and Marketing Expenses | $40,746 | $41,200 | $41,200 |
| Sales and Marketing % | 5.13% | 3.57% | 3.44% |
| General and Administrative Expenses | |||
| General and Administrative Payroll | $34,320 | $34,320 | $34,320 |
| Sales and Marketing and Other Expenses | $0 | $0 | $0 |
| Depreciation | $26,640 | $26,640 | $26,640 |
| Depreciation | $0 | $0 | $0 |
| Depreciation | $5,472 | $5,472 | $5,472 |
| Depreciation | $324 | $324 | $324 |
| Depreciation | $0 | $0 | $0 |
| Depreciation | $5,400 | $5,400 | $5,400 |
| Fees and Permits | $4,680 | $4,680 | $4,680 |
| Office Supplies | $4,152 | $4,152 | $4,152 |
| Bank Charges | $480 | $480 | $480 |
| Rent | $2,352 | $2,352 | $2,352 |
| Payroll Taxes | $43,404 | $59,055 | $62,348 |
| Other General and Administrative Expenses | $0 | $0 | $0 |
| Total General and Administrative Expenses | $127,224 | $142,875 | $146,168 |
| General and Administrative % | 16.03% | 12.39% | 12.21% |
| Other Expenses: | |||
| Other Payroll | $0 | $0 | $0 |
| Consultants | $0 | $0 | $0 |
| Contract/Consultants | $36,725 | $27,400 | $27,400 |
| CAD Contract Employee | $6,532 | $19,600 | $19,600 |
| Total Other Expenses | $43,257 | $47,000 | $47,000 |
| Other % | 5.45% | 4.08% | 3.93% |
| Total Operating Expenses | $211,227 | $231,075 | $234,368 |
| Profit Before Interest and Taxes | $62,880 | $113,796 | $127,672 |
| EBITDA | $89,520 | $140,436 | $154,312 |
| Interest Expense | $17,461 | $18,536 | $14,255 |
| Taxes Incurred | $11,480 | $23,815 | $28,827 |
| Net Profit | $33,940 | $71,445 | $84,590 |
| Net Profit/Sales | 4.28% | 6.20% | 7.07% |
7.5 Projected Cash Flow
Fixed Assets:
In the first nine months of 2000, $110,412 was added in new machinery and equipment.
Increase (decrease) Other Liabilities:
At the end of 1999, there was $49,884 outstanding in shareholder loans. After netting out loans due from shareholders amounting to $20,396, loans from shareholders were reduced by $8,126.23. No further changes in years 2001 and 2002.
Change in Other Short-term assets:
At the end of 1999, there were only $1,465 in other short-term assets. This has been increased due to pre-paid insurance, and reflected in April, 2000 of $2,855. No change in 2001 or 2002.
Long-term Borrowing (repayment):
- Applebee Leasing extended a secured loan in July to purchase fixed assets. This loan is repayable in 36 equal monthly installments of $1,816.07. A schedule is not available with breakdown of principle and interest. Assume principle repayment of $6,000 during 2000 $18,000 during 2001 and $24,000 during 2002.
- Due to a change in ownership from Fleet Bank to Chase Bank, there has been some confusion as to the amounts of various loans. The borrower’s understanding of facilities is:
- $50,000 line of credit (fully outstanding) @ 2% over prime, about half of a seven-year term-loan (originally $64,000 in September, 1996) being repaid monthly at $1,268.80 (interest@ 8.25% and principle), and the remainder of a five-year term loan (originally $20,000 as of June, 1999) being repaid $437.90 monthly (interest @ 11.15% and principle).
- Based on interim financial statements as of September, 2000, $10,974 of the term loans have been repaid since the end of 1999. We will assume principle repayments of $1,200 monthly throughout 2000, 2001, 2002, until this confusion has been clarified.

| Pro Forma Cash Flow | |||
| 2000 | 2001 | 2002 | |
| Cash Received | |||
| Cash from Operations | |||
| Cash Sales | $0 | $0 | $0 |
| Cash from Receivables | $767,853 | $1,068,195 | $1,186,460 |
| Subtotal Cash from Operations | $767,853 | $1,068,195 | $1,186,460 |
| Additional Cash Received | |||
| Sales Tax, VAT, HST/GST Received | $0 | $0 | $0 |
| New Current Borrowing | $0 | $0 | $0 |
| New Other Liabilities (interest-free) | $0 | $0 | $0 |
| New Long-term Liabilities | $54,072 | $0 | $0 |
| Sales of Other Current Assets | $0 | $0 | $0 |
| Sales of Long-term Assets | $0 | $0 | $0 |
| New Investment Received | $108,000 | $0 | $0 |
| Subtotal Cash Received | $929,925 | $1,068,195 | $1,186,460 |
| Expenditures | 2000 | 2001 | 2002 |
| Expenditures from Operations | |||
| Cash Spending | $197,742 | $269,044 | $284,044 |
| Bill Payments | $570,888 | $806,874 | $803,670 |
| Subtotal Spent on Operations | $768,630 | $1,075,918 | $1,087,714 |
| Additional Cash Spent | |||
| Sales Tax, VAT, HST/GST Paid Out | $0 | $0 | $0 |
| Principal Repayment of Current Borrowing | $1,200 | $1,000 | $20,000 |
| Other Liabilities Principal Repayment | $8,126 | $0 | $0 |
| Long-term Liabilities Principal Repayment | $19,100 | $7,000 | $64,800 |
| Purchase Other Current Assets | $2,855 | $0 | $0 |
| Purchase Long-term Assets | $110,412 | $0 | $0 |
| Dividends | $5,992 | $0 | $0 |
| Subtotal Cash Spent | $916,315 | $1,083,918 | $1,172,514 |
| Net Cash Flow | $13,610 | ($15,723) | $13,945 |
| Cash Balance | $17,598 | $1,876 | $15,821 |
7.6 Projected Balance Sheet
The following table represents Comgate’s balance sheet.
| Pro Forma Balance Sheet | |||
| 2000 | 2001 | 2002 | |
| Assets | |||
| Current Assets | |||
| Cash | $17,598 | $1,876 | $15,821 |
| Accounts Receivable | $187,026 | $271,707 | $282,063 |
| Inventory | $47,724 | $71,458 | $73,067 |
| Other Current Assets | $2,855 | $2,855 | $2,855 |
| Total Current Assets | $255,203 | $347,897 | $373,806 |
| Long-term Assets | |||
| Long-term Assets | $250,615 | $250,615 | $250,615 |
| Accumulated Depreciation | $131,533 | $158,173 | $184,813 |
| Total Long-term Assets | $119,082 | $92,442 | $65,802 |
| Total Assets | $374,285 | $440,339 | $439,608 |
| Liabilities and Capital | 2000 | 2001 | 2002 |
| Current Liabilities | |||
| Accounts Payable | $63,924 | $66,533 | $66,012 |
| Current Borrowing | $68,277 | $67,277 | $47,277 |
| Other Current Liabilities | $1,874 | $1,874 | $1,874 |
| Subtotal Current Liabilities | $134,075 | $135,684 | $115,163 |
| Long-term Liabilities | $134,151 | $127,151 | $62,351 |
| Total Liabilities | $268,226 | $262,835 | $177,514 |
| Paid-in Capital | $110,000 | $110,000 | $110,000 |
| Retained Earnings | ($37,881) | ($3,941) | $67,504 |
| Earnings | $33,940 | $71,445 | $84,590 |
| Total Capital | $106,059 | $177,504 | $262,094 |
| Total Liabilities and Capital | $374,285 | $440,339 | $439,608 |
| Net Worth | $106,059 | $177,504 | $262,094 |
7.7 Business Ratios
The table below shows some of the more important ratios. The table also includes business industry data for Standard Information Code (SIC) 2541, wood partitions and fixtures.
| Ratio Analysis | ||||
| 2000 | 2001 | 2002 | Industry Profile | |
| Sales Growth | 43.54% | 45.28% | 3.81% | 4.70% |
| Percent of Total Assets | ||||
| Accounts Receivable | 49.97% | 61.70% | 64.16% | 27.20% |
| Inventory | 12.75% | 16.23% | 16.62% | 28.50% |
| Other Current Assets | 0.76% | 0.65% | 0.65% | 18.00% |
| Total Current Assets | 68.18% | 79.01% | 85.03% | 73.70% |
| Long-term Assets | 31.82% | 20.99% | 14.97% | 26.30% |
| Total Assets | 100.00% | 100.00% | 100.00% | 100.00% |
| Current Liabilities | 35.82% | 30.81% | 26.20% | 42.00% |
| Long-term Liabilities | 35.84% | 28.88% | 14.18% | 14.80% |
| Total Liabilities | 71.66% | 59.69% | 40.38% | 56.80% |
| Net Worth | 28.34% | 40.31% | 59.62% | 43.20% |
| Percent of Sales | ||||
| Sales | 100.00% | 100.00% | 100.00% | 100.00% |
| Gross Margin | 34.54% | 29.91% | 30.25% | 33.80% |
| Selling, General & Administrative Expenses | 30.25% | 23.73% | 23.22% | 19.40% |
| Advertising Expenses | 0.00% | 0.00% | 0.00% | 1.50% |
| Profit Before Interest and Taxes | 7.92% | 9.87% | 10.67% | 2.00% |
| Main Ratios | ||||
| Current | 1.90 | 2.56 | 3.25 | 1.92 |
| Quick | 1.55 | 2.04 | 2.61 | 1.00 |
| Total Debt to Total Assets | 71.66% | 59.69% | 40.38% | 56.80% |
| Pre-tax Return on Net Worth | 42.83% | 53.67% | 43.27% | 5.80% |
| Pre-tax Return on Assets | 12.14% | 21.63% | 25.80% | 13.50% |
| Additional Ratios | 2000 | 2001 | 2002 | |
| Net Profit Margin | 4.28% | 6.20% | 7.07% | n.a |
| Return on Equity | 32.00% | 40.25% | 32.27% | n.a |
| Activity Ratios | ||||
| Accounts Receivable Turnover | 4.24 | 4.24 | 4.24 | n.a |
| Collection Days | 59 | 73 | 84 | n.a |
| Inventory Turnover | 10.91 | 8.77 | 7.40 | n.a |
| Accounts Payable Turnover | 9.02 | 12.17 | 12.17 | n.a |
| Payment Days | 30 | 29 | 30 | n.a |
| Total Asset Turnover | 2.12 | 2.62 | 2.72 | n.a |
| Debt Ratios | ||||
| Debt to Net Worth | 2.53 | 1.48 | 0.68 | n.a |
| Current Liab. to Liab. | 0.50 | 0.52 | 0.65 | n.a |
| Liquidity Ratios | ||||
| Net Working Capital | $121,128 | $212,213 | $258,643 | n.a |
| Interest Coverage | 3.60 | 6.14 | 8.96 | n.a |
| Additional Ratios | ||||
| Assets to Sales | 0.47 | 0.38 | 0.37 | n.a |
| Current Debt/Total Assets | 36% | 31% | 26% | n.a |
| Acid Test | 0.15 | 0.03 | 0.16 | n.a |
| Sales/Net Worth | 7.48 | 6.49 | 4.57 | n.a |
| Dividend Payout | 0.18 | 0.00 | 0.00 | n.a |
Appendix
| Sales Forecast | |||||||||||||
| Jan | Feb | Mar | Apr | May | Jun | Jul | Aug | Sep | Oct | Nov | Dec | ||
| Unit Sales | |||||||||||||
| Crown Molding | 0% | 357 | 357 | 357 | 357 | 357 | 357 | 357 | 357 | 357 | 342 | 342 | 342 |
| Pilasters | 0% | 17 | 17 | 17 | 17 | 17 | 17 | 17 | 17 | 17 | 22 | 22 | 22 |
| Haunched Passage Doors (Paint Grade) | 0% | 17 | 17 | 17 | 17 | 17 | 17 | 17 | 17 | 17 | 27 | 27 | 27 |
| Haunched Passage Doors (Stain Grade) | 0% | 17 | 17 | 17 | 17 | 17 | 17 | 17 | 17 | 17 | 27 | 27 | 27 |
| Cabinets | 0% | 40 | 40 | 40 | 40 | 40 | 40 | 40 | 40 | 40 | 77 | 77 | 77 |
| Site Work | 0% | 523 | 523 | 523 | 523 | 523 | 523 | 523 | 523 | 523 | 980 | 980 | 980 |
| Other | 0% | 0 | 0 | 0 | 0 | 0 | 0 | 0 | 0 | 0 | 0 | 0 | 0 |
| Total Unit Sales | 971 | 971 | 971 | 971 | 971 | 971 | 971 | 971 | 971 | 1,475 | 1,475 | 1,475 | |
| Unit Prices | Jan | Feb | Mar | Apr | May | Jun | Jul | Aug | Sep | Oct | Nov | Dec | |
| Crown Molding | $4.20 | $4.00 | $4.00 | $4.00 | $4.00 | $4.00 | $4.00 | $4.00 | $4.00 | $4.00 | $4.00 | $4.00 | |
| Pilasters | $316.96 | $316.96 | $316.96 | $316.96 | $316.96 | $316.96 | $316.96 | $316.96 | $316.96 | $316.96 | $316.96 | $316.96 | |
| Haunched Passage Doors (Paint Grade) | $592.35 | $592.35 | $592.35 | $592.35 | $592.35 | $592.35 | $592.35 | $592.35 | $592.35 | $592.35 | $592.35 | $592.35 | |
| Haunched Passage Doors (Stain Grade) | $783.09 | $783.09 | $783.09 | $783.09 | $783.09 | $783.09 | $783.09 | $783.09 | $783.09 | $783.09 | $783.09 | $783.09 | |
| Cabinets | $194.76 | $194.76 | $194.76 | $194.76 | $194.76 | $194.76 | $194.76 | $194.76 | $194.76 | $194.76 | $194.76 | $194.76 | |
| Site Work | $35.33 | $35.33 | $35.33 | $35.33 | $35.33 | $35.33 | $35.33 | $35.33 | $35.33 | $35.33 | $35.33 | $35.33 | |
| Other | $0.00 | $0.00 | $0.00 | $0.00 | $0.00 | $0.00 | $0.00 | $0.00 | $0.00 | $0.00 | $0.00 | $0.00 | |
| Sales | |||||||||||||
| Crown Molding | $1,499 | $1,428 | $1,428 | $1,428 | $1,428 | $1,428 | $1,428 | $1,428 | $1,428 | $1,368 | $1,368 | $1,368 | |
| Pilasters | $5,388 | $5,388 | $5,388 | $5,388 | $5,388 | $5,388 | $5,388 | $5,388 | $5,388 | $6,973 | $6,973 | $6,973 | |
| Haunched Passage Doors (Paint Grade) | $10,070 | $10,070 | $10,070 | $10,070 | $10,070 | $10,070 | $10,070 | $10,070 | $10,070 | $15,993 | $15,993 | $15,993 | |
| Haunched Passage Doors (Stain Grade) | $13,313 | $13,313 | $13,313 | $13,313 | $13,313 | $13,313 | $13,313 | $13,313 | $13,313 | $21,143 | $21,143 | $21,143 | |
| Cabinets | $7,790 | $7,790 | $7,790 | $7,790 | $7,790 | $7,790 | $7,790 | $7,790 | $7,790 | $14,997 | $14,997 | $14,997 | |
| Site Work | $18,478 | $18,478 | $18,478 | $18,478 | $18,478 | $18,478 | $18,478 | $18,478 | $18,478 | $34,623 | $34,623 | $34,623 | |
| Other | $0 | $0 | $0 | $0 | $0 | $0 | $0 | $0 | $0 | $0 | $0 | $0 | |
| Total Sales | $56,538 | $56,467 | $56,467 | $56,467 | $56,467 | $56,467 | $56,467 | $56,467 | $56,467 | $95,098 | $95,098 | $95,098 | |
| Direct Unit Costs | Jan | Feb | Mar | Apr | May | Jun | Jul | Aug | Sep | Oct | Nov | Dec | |
| Crown Molding | 0.00% | $2.06 | $2.06 | $2.06 | $2.06 | $2.06 | $2.06 | $2.06 | $2.06 | $2.06 | $1.82 | $1.82 | $1.82 |
| Pilasters | 0.00% | $50.04 | $50.04 | $50.04 | $50.04 | $50.04 | $50.04 | $50.04 | $50.04 | $50.04 | $44.09 | $44.09 | $44.09 |
| Haunched Passage Doors (Paint Grade) | 0.00% | $148.15 | $148.15 | $148.15 | $148.15 | $148.15 | $148.15 | $148.15 | $148.15 | $148.15 | $130.53 | $130.53 | $130.53 |
| Haunched Passage Doors (Stain Grade) | 0.00% | $281.34 | $281.34 | $281.34 | $281.34 | $281.34 | $281.34 | $281.34 | $281.34 | $281.34 | $247.88 | $247.88 | $247.88 |
| Cabinets | 0.00% | $65.44 | $65.44 | $65.44 | $65.44 | $65.44 | $65.44 | $65.44 | $65.44 | $65.44 | $57.66 | $57.66 | $57.66 |
| Site Work | 0.00% | $24.53 | $24.53 | $24.53 | $24.53 | $24.53 | $24.53 | $24.53 | $24.53 | $24.53 | $27.69 | $27.69 | $27.69 |
| Other | 0.00% | $0.00 | $0.00 | $0.00 | $0.00 | $0.00 | $0.00 | $0.00 | $0.00 | $0.00 | $0.00 | $0.00 | $0.00 |
| Direct Cost of Sales | |||||||||||||
| Crown Molding | $735 | $735 | $735 | $735 | $735 | $735 | $735 | $735 | $735 | $622 | $622 | $622 | |
| Pilasters | $851 | $851 | $851 | $851 | $851 | $851 | $851 | $851 | $851 | $970 | $970 | $970 | |
| Haunched Passage Doors (Paint Grade) | $2,519 | $2,519 | $2,519 | $2,519 | $2,519 | $2,519 | $2,519 | $2,519 | $2,519 | $3,524 | $3,524 | $3,524 | |
| Haunched Passage Doors (Stain Grade) | $4,783 | $4,783 | $4,783 | $4,783 | $4,783 | $4,783 | $4,783 | $4,783 | $4,783 | $6,693 | $6,693 | $6,693 | |
| Cabinets | $2,618 | $2,618 | $2,618 | $2,618 | $2,618 | $2,618 | $2,618 | $2,618 | $2,618 | $4,440 | $4,440 | $4,440 | |
| Site Work | $12,829 | $12,829 | $12,829 | $12,829 | $12,829 | $12,829 | $12,829 | $12,829 | $12,829 | $27,136 | $27,136 | $27,136 | |
| Other | $0 | $0 | $0 | $0 | $0 | $0 | $0 | $0 | $0 | $0 | $0 | $0 | |
| Subtotal Direct Cost of Sales | $24,334 | $24,334 | $24,334 | $24,334 | $24,334 | $24,334 | $24,334 | $24,334 | $24,334 | $43,386 | $43,386 | $43,386 | |
| Personnel Plan | |||||||||||||
| Jan | Feb | Mar | Apr | May | Jun | Jul | Aug | Sep | Oct | Nov | Dec | ||
| Production Personnel | |||||||||||||
| **David Malkinson | $3,185 | $3,185 | $3,185 | $3,185 | $3,185 | $3,185 | $3,185 | $3,185 | $3,185 | $3,467 | $3,467 | $3,467 | |
| **Simon Lang | $3,185 | $3,185 | $3,185 | $3,185 | $3,185 | $3,185 | $3,185 | $3,185 | $3,185 | $2,890 | $2,890 | $2,890 | |
| **Brian Mason | $0 | $0 | $0 | $0 | $0 | $0 | $0 | $0 | $0 | $2,890 | $2,890 | $2,890 | |
| Production/Project Manager | $0 | $0 | $0 | $0 | $0 | $0 | $0 | $0 | $0 | $0 | $0 | $0 | |
| **Charles Davidson | $3,185 | $3,185 | $3,185 | $3,185 | $3,185 | $3,185 | $3,185 | $3,185 | $3,185 | $3,230 | $3,230 | $3,230 | |
| Subtotal | $9,555 | $9,555 | $9,555 | $9,555 | $9,555 | $9,555 | $9,555 | $9,555 | $9,555 | $12,477 | $12,477 | $12,477 | |
| Sales and Marketing Personnel | |||||||||||||
| Andrew Comins | $3,333 | $3,333 | $3,333 | $3,333 | $3,333 | $3,333 | $3,333 | $3,333 | $3,333 | $3,333 | $3,333 | $3,333 | |
| Other | $0 | $0 | $0 | $0 | $0 | $0 | $0 | $0 | $0 | $0 | $0 | $0 | |
| Subtotal | $3,333 | $3,333 | $3,333 | $3,333 | $3,333 | $3,333 | $3,333 | $3,333 | $3,333 | $3,333 | $3,333 | $3,333 | |
| General and Administrative Personnel | |||||||||||||
| **Stacy Greer | $2,860 | $2,860 | $2,860 | $2,860 | $2,860 | $2,860 | $2,860 | $2,860 | $2,860 | $2,860 | $2,860 | $2,860 | |
| Other | $0 | $0 | $0 | $0 | $0 | $0 | $0 | $0 | $0 | $0 | $0 | $0 | |
| Subtotal | $2,860 | $2,860 | $2,860 | $2,860 | $2,860 | $2,860 | $2,860 | $2,860 | $2,860 | $2,860 | $2,860 | $2,860 | |
| Other Personnel | |||||||||||||
| Name or Title | $0 | $0 | $0 | $0 | $0 | $0 | $0 | $0 | $0 | $0 | $0 | $0 | |
| Other | $0 | $0 | $0 | $0 | $0 | $0 | $0 | $0 | $0 | $0 | $0 | $0 | |
| Subtotal | $0 | $0 | $0 | $0 | $0 | $0 | $0 | $0 | $0 | $0 | $0 | $0 | |
| Total People | 6 | 6 | 6 | 6 | 6 | 6 | 6 | 6 | 6 | 6 | 6 | 6 | |
| Total Payroll | $15,748 | $15,748 | $15,748 | $15,748 | $15,748 | $15,748 | $15,748 | $15,748 | $15,748 | $18,670 | $18,670 | $18,670 | |
| General Assumptions | |||||||||||||
| Jan | Feb | Mar | Apr | May | Jun | Jul | Aug | Sep | Oct | Nov | Dec | ||
| Plan Month | 1 | 2 | 3 | 4 | 5 | 6 | 7 | 8 | 9 | 10 | 11 | 12 | |
| Current Interest Rate | 10.00% | 10.00% | 10.00% | 10.00% | 10.00% | 10.00% | 10.00% | 10.00% | 10.00% | 10.00% | 10.00% | 10.00% | |
| Long-term Interest Rate | 9.00% | 9.00% | 9.00% | 9.00% | 9.00% | 9.00% | 9.00% | 9.00% | 9.00% | 9.00% | 9.00% | 9.00% | |
| Tax Rate | 30.00% | 25.00% | 25.00% | 25.00% | 25.00% | 25.00% | 25.00% | 25.00% | 25.00% | 25.00% | 25.00% | 25.00% | |
| Other | 0 | 0 | 0 | 0 | 0 | 0 | 0 | 0 | 0 | 0 | 0 | 0 | |
| Pro Forma Profit and Loss | |||||||||||||
| Jan | Feb | Mar | Apr | May | Jun | Jul | Aug | Sep | Oct | Nov | Dec | ||
| Sales | $56,538 | $56,467 | $56,467 | $56,467 | $56,467 | $56,467 | $56,467 | $56,467 | $56,467 | $95,098 | $95,098 | $95,098 | |
| Direct Cost of Sales | $24,334 | $24,334 | $24,334 | $24,334 | $24,334 | $24,334 | $24,334 | $24,334 | $24,334 | $43,386 | $43,386 | $43,386 | |
| Production Payroll | $9,555 | $9,555 | $9,555 | $9,555 | $9,555 | $9,555 | $9,555 | $9,555 | $9,555 | $12,477 | $12,477 | $12,477 | |
| Other | $3,089 | $3,089 | $3,089 | $3,089 | $3,089 | $3,089 | $3,089 | $3,089 | $5,539 | $5,539 | $5,539 | $5,539 | |
| Total Cost of Sales | $36,978 | $36,978 | $36,978 | $36,978 | $36,978 | $36,978 | $36,978 | $36,978 | $39,428 | $61,402 | $61,402 | $61,402 | |
| Gross Margin | $19,560 | $19,489 | $19,489 | $19,489 | $19,489 | $19,489 | $19,489 | $19,489 | $17,039 | $33,696 | $33,696 | $33,696 | |
| Gross Margin % | 34.60% | 34.51% | 34.51% | 34.51% | 34.51% | 34.51% | 34.51% | 34.51% | 30.17% | 35.43% | 35.43% | 35.43% | |
| Operating Expenses | |||||||||||||
| Sales and Marketing Expenses | |||||||||||||
| Sales and Marketing Payroll | $3,333 | $3,333 | $3,333 | $3,333 | $3,333 | $3,333 | $3,333 | $3,333 | $3,333 | $3,333 | $3,333 | $3,333 | |
| Advertising/Promotion | $0 | $0 | $0 | $0 | $0 | $0 | $0 | $0 | $0 | $0 | $0 | $0 | |
| Travel | $50 | $50 | $50 | $50 | $50 | $50 | $50 | $50 | $50 | $100 | $100 | $100 | |
| Miscellaneous | $0 | $0 | $0 | $0 | $0 | $0 | $0 | $0 | $0 | $0 | $0 | $0 | |
| Total Sales and Marketing Expenses | $3,383 | $3,383 | $3,383 | $3,383 | $3,383 | $3,383 | $3,383 | $3,383 | $3,383 | $3,433 | $3,433 | $3,433 | |
| Sales and Marketing % | 5.98% | 5.99% | 5.99% | 5.99% | 5.99% | 5.99% | 5.99% | 5.99% | 5.99% | 3.61% | 3.61% | 3.61% | |
| General and Administrative Expenses | |||||||||||||
| General and Administrative Payroll | $2,860 | $2,860 | $2,860 | $2,860 | $2,860 | $2,860 | $2,860 | $2,860 | $2,860 | $2,860 | $2,860 | $2,860 | |
| Sales and Marketing and Other Expenses | $0 | $0 | $0 | $0 | $0 | $0 | $0 | $0 | $0 | $0 | $0 | $0 | |
| Depreciation | $2,220 | $2,220 | $2,220 | $2,220 | $2,220 | $2,220 | $2,220 | $2,220 | $2,220 | $2,220 | $2,220 | $2,220 | |
| Depreciation | $0 | $0 | $0 | $0 | $0 | $0 | $0 | $0 | $0 | $0 | $0 | $0 | |
| Depreciation | $456 | $456 | $456 | $456 | $456 | $456 | $456 | $456 | $456 | $456 | $456 | $456 | |
| Depreciation | $27 | $27 | $27 | $27 | $27 | $27 | $27 | $27 | $27 | $27 | $27 | $27 | |
| Depreciation | $0 | $0 | $0 | $0 | $0 | $0 | $0 | $0 | $0 | $0 | $0 | $0 | |
| Depreciation | $450 | $450 | $450 | $450 | $450 | $450 | $450 | $450 | $450 | $450 | $450 | $450 | |
| Fees and Permits | $390 | $390 | $390 | $390 | $390 | $390 | $390 | $390 | $390 | $390 | $390 | $390 | |
| Office Supplies | $346 | $346 | $346 | $346 | $346 | $346 | $346 | $346 | $346 | $346 | $346 | $346 | |
| Bank Charges | $40 | $40 | $40 | $40 | $40 | $40 | $40 | $40 | $40 | $40 | $40 | $40 | |
| Rent | $196 | $196 | $196 | $196 | $196 | $196 | $196 | $196 | $196 | $196 | $196 | $196 | |
| Payroll Taxes | 22% | $3,457 | $3,457 | $3,457 | $3,457 | $3,457 | $3,457 | $3,457 | $3,457 | $3,457 | $4,098 | $4,098 | $4,098 |
| Other General and Administrative Expenses | $0 | $0 | $0 | $0 | $0 | $0 | $0 | $0 | $0 | $0 | $0 | $0 | |
| Total General and Administrative Expenses | $10,442 | $10,442 | $10,442 | $10,442 | $10,442 | $10,442 | $10,442 | $10,442 | $10,442 | $11,083 | $11,083 | $11,083 | |
| General and Administrative % | 18.47% | 18.49% | 18.49% | 18.49% | 18.49% | 18.49% | 18.49% | 18.49% | 18.49% | 11.65% | 11.65% | 11.65% | |
| Other Expenses: | |||||||||||||
| Other Payroll | $0 | $0 | $0 | $0 | $0 | $0 | $0 | $0 | $0 | $0 | $0 | $0 | |
| Consultants | $0 | $0 | $0 | $0 | $0 | $0 | $0 | $0 | $0 | $0 | $0 | $0 | |
| Contract/Consultants | $1,925 | $1,925 | $1,925 | $1,925 | $1,925 | $3,625 | $1,925 | $1,925 | $3,725 | $5,550 | $5,150 | $5,200 | |
| CAD Contract Employee | $0 | $0 | $0 | $0 | $0 | $0 | $0 | $0 | $1,633 | $1,633 | $1,633 | $1,633 | |
| Total Other Expenses | $1,925 | $1,925 | $1,925 | $1,925 | $1,925 | $3,625 | $1,925 | $1,925 | $5,358 | $7,183 | $6,783 | $6,833 | |
| Other % | 3.40% | 3.41% | 3.41% | 3.41% | 3.41% | 6.42% | 3.41% | 3.41% | 9.49% | 7.55% | 7.13% | 7.19% | |
| Total Operating Expenses | $15,750 | $15,750 | $15,750 | $15,750 | $15,750 | $17,450 | $15,750 | $15,750 | $19,183 | $21,699 | $21,299 | $21,349 | |
| Profit Before Interest and Taxes | $3,810 | $3,739 | $3,739 | $3,739 | $3,739 | $2,039 | $3,739 | $3,739 | ($2,144) | $11,997 | $12,397 | $12,347 | |
| EBITDA | $6,030 | $5,959 | $5,959 | $5,959 | $5,959 | $4,259 | $5,959 | $5,959 | $76 | $14,217 | $14,617 | $14,567 | |
| Interest Expense | $1,313 | $1,303 | $1,293 | $1,283 | $1,274 | $1,264 | $1,669 | $1,650 | $1,631 | $1,612 | $1,594 | $1,575 | |
| Taxes Incurred | $749 | $609 | $611 | $614 | $616 | $194 | $518 | $522 | ($944) | $2,596 | $2,701 | $2,693 | |
| Net Profit | $1,748 | $1,827 | $1,834 | $1,842 | $1,849 | $581 | $1,553 | $1,567 | ($2,831) | $7,789 | $8,103 | $8,079 | |
| Net Profit/Sales | 3.09% | 3.24% | 3.25% | 3.26% | 3.27% | 1.03% | 2.75% | 2.77% | -5.01% | 8.19% | 8.52% | 8.50% | |
| Pro Forma Cash Flow | |||||||||||||
| Jan | Feb | Mar | Apr | May | Jun | Jul | Aug | Sep | Oct | Nov | Dec | ||
| Cash Received | |||||||||||||
| Cash from Operations | |||||||||||||
| Cash Sales | $0 | $0 | $0 | $0 | $0 | $0 | $0 | $0 | $0 | $0 | $0 | $0 | |
| Cash from Receivables | $80,657 | $82,541 | $56,536 | $56,467 | $56,467 | $56,467 | $56,467 | $56,467 | $56,467 | $56,467 | $57,754 | $95,098 | |
| Subtotal Cash from Operations | $80,657 | $82,541 | $56,536 | $56,467 | $56,467 | $56,467 | $56,467 | $56,467 | $56,467 | $56,467 | $57,754 | $95,098 | |
| Additional Cash Received | |||||||||||||
| Sales Tax, VAT, HST/GST Received | 0.00% | $0 | $0 | $0 | $0 | $0 | $0 | $0 | $0 | $0 | $0 | $0 | $0 |
| New Current Borrowing | $0 | $0 | $0 | $0 | $0 | $0 | $0 | $0 | $0 | $0 | $0 | $0 | |
| New Other Liabilities (interest-free) | $0 | $0 | $0 | $0 | $0 | $0 | $0 | $0 | $0 | $0 | $0 | $0 | |
| New Long-term Liabilities | $0 | $0 | $0 | $0 | $0 | $0 | $54,072 | $0 | $0 | $0 | $0 | $0 | |
| Sales of Other Current Assets | $0 | $0 | $0 | $0 | $0 | $0 | $0 | $0 | $0 | $0 | $0 | $0 | |
| Sales of Long-term Assets | $0 | $0 | $0 | $0 | $0 | $0 | $0 | $0 | $0 | $0 | $0 | $0 | |
| New Investment Received | $0 | $0 | $108,000 | $0 | $0 | $0 | $0 | $0 | $0 | $0 | $0 | $0 | |
| Subtotal Cash Received | $80,657 | $82,541 | $164,536 | $56,467 | $56,467 | $56,467 | $110,539 | $56,467 | $56,467 | $56,467 | $57,754 | $95,098 | |
| Expenditures | Jan | Feb | Mar | Apr | May | Jun | Jul | Aug | Sep | Oct | Nov | Dec | |
| Expenditures from Operations | |||||||||||||
| Cash Spending | $15,748 | $15,748 | $15,748 | $15,748 | $15,748 | $15,748 | $15,748 | $15,748 | $15,748 | $18,670 | $18,670 | $18,670 | |
| Bill Payments | $60,247 | $56,409 | $36,672 | $36,664 | $36,657 | $36,692 | $37,885 | $36,946 | $37,078 | $42,865 | $86,666 | $66,106 | |
| Subtotal Spent on Operations | $75,995 | $72,157 | $52,420 | $52,412 | $52,405 | $52,440 | $53,633 | $52,694 | $52,826 | $61,535 | $105,336 | $84,776 | |
| Additional Cash Spent | |||||||||||||
| Sales Tax, VAT, HST/GST Paid Out | $0 | $0 | $0 | $0 | $0 | $0 | $0 | $0 | $0 | $0 | $0 | $0 | |
| Principal Repayment of Current Borrowing | $100 | $100 | $100 | $100 | $100 | $100 | $100 | $100 | $100 | $100 | $100 | $100 | |
| Other Liabilities Principal Repayment | $0 | $8,126 | $0 | $0 | $0 | $0 | $0 | $0 | $0 | $0 | $0 | $0 | |
| Long-term Liabilities Principal Repayment | $1,200 | $1,200 | $1,200 | $1,200 | $1,200 | $1,200 | $0 | $2,400 | $2,400 | $2,400 | $2,300 | $2,400 | |
| Purchase Other Current Assets | $0 | $0 | $0 | $2,855 | $0 | $0 | $0 | $0 | $0 | $0 | $0 | $0 | |
| Purchase Long-term Assets | $0 | $0 | $50,000 | $0 | $0 | $60,412 | $0 | $0 | $0 | $0 | $0 | $0 | |
| Dividends | $0 | $0 | $0 | $0 | $0 | $0 | $0 | $5,992 | $0 | $0 | $0 | $0 | |
| Subtotal Cash Spent | $77,295 | $81,583 | $103,720 | $56,567 | $53,705 | $114,152 | $53,733 | $61,186 | $55,326 | $64,035 | $107,736 | $87,276 | |
| Net Cash Flow | $3,362 | $958 | $60,816 | ($101) | $2,762 | ($57,685) | $56,806 | ($4,719) | $1,140 | ($7,568) | ($49,982) | $7,822 | |
| Cash Balance | $7,350 | $8,307 | $69,124 | $69,023 | $71,785 | $14,099 | $70,905 | $66,186 | $67,327 | $59,759 | $9,777 | $17,598 | |
| Pro Forma Balance Sheet | |||||||||||||
| Jan | Feb | Mar | Apr | May | Jun | Jul | Aug | Sep | Oct | Nov | Dec | ||
| Assets | Starting Balances | ||||||||||||
| Current Assets | |||||||||||||
| Cash | $3,988 | $7,350 | $8,307 | $69,124 | $69,023 | $71,785 | $14,099 | $70,905 | $66,186 | $67,327 | $59,759 | $9,777 | $17,598 |
| Accounts Receivable | $161,313 | $137,195 | $111,120 | $111,051 | $111,051 | $111,051 | $111,051 | $111,051 | $111,051 | $111,051 | $149,682 | $187,026 | $187,026 |
| Inventory | $6,500 | $26,768 | $26,768 | $26,768 | $26,768 | $26,768 | $26,768 | $26,768 | $26,768 | $26,768 | $47,724 | $47,724 | $47,724 |
| Other Current Assets | $0 | $0 | $0 | $0 | $2,855 | $2,855 | $2,855 | $2,855 | $2,855 | $2,855 | $2,855 | $2,855 | $2,855 |
| Total Current Assets | $171,801 | $171,312 | $146,196 | $206,943 | $209,697 | $212,459 | $154,773 | $211,579 | $206,860 | $208,001 | $260,020 | $247,382 | $255,203 |
| Long-term Assets | |||||||||||||
| Long-term Assets | $140,203 | $140,203 | $140,203 | $190,203 | $190,203 | $190,203 | $250,615 | $250,615 | $250,615 | $250,615 | $250,615 | $250,615 | $250,615 |
| Accumulated Depreciation | $104,893 | $107,113 | $109,333 | $111,553 | $113,773 | $115,993 | $118,213 | $120,433 | $122,653 | $124,873 | $127,093 | $129,313 | $131,533 |
| Total Long-term Assets | $35,310 | $33,090 | $30,870 | $78,650 | $76,430 | $74,210 | $132,402 | $130,182 | $127,962 | $125,742 | $123,522 | $121,302 | $119,082 |
| Total Assets | $207,111 | $204,402 | $177,066 | $285,593 | $286,127 | $286,669 | $287,175 | $341,761 | $334,822 | $333,743 | $383,542 | $368,684 | $374,285 |
| Liabilities and Capital | Jan | Feb | Mar | Apr | May | Jun | Jul | Aug | Sep | Oct | Nov | Dec | |
| Current Liabilities | |||||||||||||
| Accounts Payable | $58,344 | $55,187 | $35,450 | $35,442 | $35,435 | $35,428 | $36,654 | $35,714 | $35,701 | $39,952 | $84,463 | $63,902 | $63,924 |
| Current Borrowing | $69,477 | $69,377 | $69,277 | $69,177 | $69,077 | $68,977 | $68,877 | $68,777 | $68,677 | $68,577 | $68,477 | $68,377 | $68,277 |
| Other Current Liabilities | $10,000 | $10,000 | $1,874 | $1,874 | $1,874 | $1,874 | $1,874 | $1,874 | $1,874 | $1,874 | $1,874 | $1,874 | $1,874 |
| Subtotal Current Liabilities | $137,821 | $134,564 | $106,601 | $106,493 | $106,386 | $106,279 | $107,405 | $106,365 | $106,252 | $110,403 | $154,814 | $134,153 | $134,075 |
| Long-term Liabilities | $99,179 | $97,979 | $96,779 | $95,579 | $94,379 | $93,179 | $91,979 | $146,051 | $143,651 | $141,251 | $138,851 | $136,551 | $134,151 |
| Total Liabilities | $237,000 | $232,543 | $203,380 | $202,072 | $200,765 | $199,458 | $199,384 | $252,416 | $249,903 | $251,654 | $293,665 | $270,704 | $268,226 |
| Paid-in Capital | $2,000 | $2,000 | $2,000 | $110,000 | $110,000 | $110,000 | $110,000 | $110,000 | $110,000 | $110,000 | $110,000 | $110,000 | $110,000 |
| Retained Earnings | ($65,014) | ($31,889) | ($31,889) | ($31,889) | ($31,889) | ($31,889) | ($31,889) | ($31,889) | ($37,881) | ($37,881) | ($37,881) | ($37,881) | ($37,881) |
| Earnings | $33,125 | $1,748 | $3,575 | $5,409 | $7,251 | $9,100 | $9,681 | $11,234 | $12,801 | $9,969 | $17,758 | $25,861 | $33,940 |
| Total Capital | ($29,889) | ($28,141) | ($26,314) | $83,520 | $85,362 | $87,211 | $87,792 | $89,345 | $84,920 | $82,088 | $89,877 | $97,980 | $106,059 |
| Total Liabilities and Capital | $207,111 | $204,402 | $177,066 | $285,593 | $286,127 | $286,669 | $287,175 | $341,761 | $334,822 | $333,743 | $383,542 | $368,684 | $374,285 |
| Net Worth | ($29,889) | ($28,141) | ($26,314) | $83,520 | $85,362 | $87,211 | $87,792 | $89,345 | $84,920 | $82,088 | $89,877 | $97,980 | $106,059 |

