
Inspirational Grounds
Executive Summary
Inspirational Grounds will provide a relaxing, Christian-focused, neighborhood-centered place with freshly roasted coffee, specialty drinks, good books, and music. Inspirational Grounds is the answer to an increasing demand. Our target market wants:
- Neighborhood businesses in South Central Minneapolis
- Great coffee at a competitive price
- A comfortable place to socialize with others with similar interests
Inspirational Grounds’ goal is to provide the community with a social, entertaining atmosphere where Christian neighbors can meet each other in a neutral, non-denominational setting.
Inspirational Grounds is incorporated as an S corporation. This will shield the owner from issues of personal liability and double taxation.
This proposal is prepared to obtain financing in the amount of $80,000. The supplemental financing is required to prepare the selected site, purchase equipment, and cover expenses during the first year of operation. The owner will invest $15,000 of her own into the business.
This financing will allow Inspirational Grounds to successfully open and maintain operations. The large initial capital investment will allow Inspirational Grounds to provide its customers with an inviting atmosphere and quality products. A unique, upscale and innovative environment is required to provide customers with an atmosphere that will create socialization. Successful operation in year one will provide Inspirational Grounds with a customer base that will allow it to be self sufficient in year two.
Even with our conservative sales forecast, we will maintain a positive cash flow in all months, repay the loan in 12 years, and have a positive net worth over $27,000 by year three. We project that our net profits will increase from $12,000 to over $14,000 over the next three years.

1.1 Objectives
Inspirational Grounds’ objectives for the first three years of operation include:
- The creation of a unique, upscale, innovative spiritual environment that will differentiate Inspirational Grounds from local coffee shops.
- To make Inspirational Grounds the destination for quality coffee in a welcoming atmosphere for people who are serious about their coffee and growing in their spirituality.
- The formation of an environment that will bring people with diverse backgrounds and interests together in a common forum.
- To be an active and vocal member of the community, and to provide continual re-investment through participation in community activities and financial contributions.
- Consistently providing excellent specialty beverages, bakery items, inspirational books, and music.
1.2 Keys to Success
The keys to the success for Inspirational Grounds are:
- The creation of a unique, innovative, upscale atmosphere that will differentiate Inspirational Grounds from other local coffee shops and future coffee shops.
- Fresh Coffee roasted on-site daily will give customers a unique experience as well as excellent product.
- Selling beverages and products that are of the highest quality.
- The creation of an environment that won’t intimidate the spiritual seeker. Inspirational Grounds will position itself as an educational resource for individuals wishing to learn about the benefits of growing spiritually.
- The establishment of Inspirational Grounds as a community hub for socialization and entertainment.
- Encourage the two most important values in Christianity: love and service.
1.3 Mission
As people are becoming more interested in their spiritual side, a neighborhood shop with excellent freshly roasted coffee and non-denominational Christian books and tapes, is a welcomed alternative and/or addition to the local church. Inspirational Grounds is a specialty beverage establishment focused on providing freshly roasted coffee beans, coffee/espresso drinks and information to enhance our customers’ spiritual experience. We also understand that coffee drinkers interested in growing spiritually want a destination, not just a location;we provide them with the best of both.
Our goal is to be the destination for Christian coffee drinkers seeking a non-secular environment in the Twin Cities area. People of all ages and backgrounds will come to enjoy the unique upscale, educational, motivational and innovative environment that Inspirational Grounds provides.
We believe it is important to remain an active member of the community and to impact our customers’ lives in more ways than the selling of specialty drinks.
Company Summary
Inspirational Grounds, Minneapolis’ South Central area, will offer great specialty beverages and easy access to exciting spiritual information. Inspirational Grounds sells quality products and provides excellent customer service for coffee lovers and persons looking to enhance their spiritual experience. We are looking to lease a retail store which we will use to market and merchandise our products. The company took its name in July 2002, and organized as an S Corporation in October, 2003.
Our book and music selection and helpful staff will appeal to the audience that is seeking to grow and learn spiritually in this age of uncertainty. This invigorating aspect will attract younger and elderly members alike who are gaining interest in their spiritual condition. The central location will provide easy access from most points of origin throughout the Twin City area for those who will recognize Inspirational Grounds as a destination point, as well as provide local community residents with convenient access to freshly roasted coffee.
2.1 Company Ownership
Inspirational Grounds is incorporated as an S corporation. This will shield the owner Regina Brown from issues of personal liability and double taxation. The Corporation was formed in October of 2003.
2.2 Company Locations and Facilities
The site, Midtown Commons (Also known as the Sears Project), is located in South Central Minneapolis. The initial space is approximately 2,000 square feet and has ample space for the first three years of growth. The complex has ample parking and significant foot traffic from Allina Healthcare Office Facility. This area was chosen for various reasons, including:
- Proximity to other areas within the Twin Cities; Central location easily accessed.
- Proximity to the Lyn/Lake and Uptown areas.
- High Visibility.
- Proximity to the many local churches in South Central Minneapolis.
- Diverse population within the community.
- Desire for South Central Businesses.
- Scarcity of other coffee houses in the area.
- Proximity to the light rail depot and 12th Precinct of the Minneapolis police.
All of these qualities are consistent with Inspirational Grounds’ goal of providing a community hub for socialization and entertainment.
2.3 Start-up Summary
Inspirational Grounds’ start-up costs will cover coffee, espresso, and specialty drink making equipment, micro-roasting equipment, training, site renovation and modification, capital for operating expenses in the first year, and the inventory necessary to provide customers with the information needed to grow.
A large portion of our start-up requirements will go towards the purchase of specialty drink equipment from Espresso Services, Inc. Our long-term assets will include:
- One espresso machine
- One micro-roasting system
- an Espresso grinder/doser
- water filtration system
Expensed equipment includes:
- A Bulk grinder for drip coffee
- Single airpot brewer
- Smoothie blender
- Minor additional equipment
Additionally, we need funding for initial inventory, both for the coffee shop side of things and the other specialty merchandise, books, and music. Music items will be purchased from Provident Music, Diamante Music Group, and New Day Christian Distributors among others. Books and other inspirational material will be purchased from Bridge-Logos Publishers, KCM, Bethany House Distributors, and others.
The site Inspirational Grounds chooses will require funds for renovation and modification. A single estimated figure will be allocated for this purpose. The renovation/modification cost estimate will include the costs associated with preparing the site for opening business.
Current Assets, in the table below, includes furniture and fixtures.

Long-term assets, in addition to our major brewing, grinding, and roasting equipment, includes a POS System.

| Start-up | |
| Requirements | |
| Start-up Expenses | |
| Legal | $1,500 |
| Stationery etc. | $800 |
| Brochures/Mailings | $1,000 |
| Marketing Consultant | $1,000 |
| Insurance | $500 |
| Rent | $2,000 |
| Research and Development | $1,500 |
| Build Out Expenses | $8,000 |
| Initial Marketing | $2,000 |
| Training | $1,500 |
| Website development | $50 |
| Expensed Equipment | $4,950 |
| Other | $5,000 |
| Total Start-up Expenses | $29,800 |
| Start-up Assets | |
| Cash Required | $30,600 |
| Start-up Inventory | $6,600 |
| Other Current Assets | $12,000 |
| Long-term Assets | $16,000 |
| Total Assets | $65,200 |
| Total Requirements | $95,000 |
| Start-up Funding | |
| Start-up Expenses to Fund | $29,800 |
| Start-up Assets to Fund | $65,200 |
| Total Funding Required | $95,000 |
| Assets | |
| Non-cash Assets from Start-up | $34,600 |
| Cash Requirements from Start-up | $30,600 |
| Additional Cash Raised | $0 |
| Cash Balance on Starting Date | $30,600 |
| Total Assets | $65,200 |
| Liabilities and Capital | |
| Liabilities | |
| Current Borrowing | $0 |
| Long-term Liabilities | $80,000 |
| Accounts Payable (Outstanding Bills) | $0 |
| Other Current Liabilities (interest-free) | $0 |
| Total Liabilities | $80,000 |
| Capital | |
| Planned Investment | |
| Owner Investment | $15,000 |
| Investor 2 | $0 |
| Other | $0 |
| Additional Investment Requirement | $0 |
| Total Planned Investment | $15,000 |
| Loss at Start-up (Start-up Expenses) | ($29,800) |
| Total Capital | ($14,800) |
| Total Capital and Liabilities | $65,200 |
| Total Funding | $95,000 |
2.3.1 Itemized Start-up
The following table represents an itemized list of the equipment, supplies, furniture and fixtures needed at start-up.
Equipment: Total $15,946.78
| Item | Description | Supplier | Number |
Per Item Cost |
Total Cost |
|
Espresso Machine |
La Cimabli MN29 Select | ESI | 1 |
$6,900.00 |
$5,643.50 |
| Grinder/Doser | Mazzer Super Jolly | ESI | 1 |
$770.00 |
$629.78 |
| Bulk Grinder | Mazzer Major | ESI | 1 |
$1,025.00 |
$838.35 |
| Brewer | Single Pot Brewer | ESI | 1 |
$865.00 |
$707.48 |
| Airpot | Service Idea 3 ltr | ESI | 4 |
$54.90 |
$179.61 |
| Water Filter Head | Everpure SO MC twin | ESI | 1 |
$175.71 |
$143.71 |
| Filter Cartridge | Everpure MC | ESI | 1 |
$69.07 |
$56.49 |
| Water softener | Everpure 7-SO Cartridge | ESI | 1 |
$94.92 |
$77.63 |
| Knockbox | Countertop | ESI | 1 |
$40.00 |
$32.72 |
| Creamer | Bell Creamer | ESI | 0 |
$40.00 |
|
| Thermometer | ESI | 0 |
$7.35 |
|
|
| Steam Pitcher | 1 liter | ESI | 0 |
$12.15 |
|
| Steam Pitcher | 1.5 liter | ESI | 0 |
$19.15 |
|
| Whipped Cream Maker | ISI 1 Pint | ESI | 0 |
$69.23 |
|
| Espresso Hand Tamper | ESI | 0 |
|
|
|
| Blender | Vita Mix 48 OZ – Bar Boss | Zesco | 1 |
$379.00 |
$379.00 |
| Coffee Roaster | Micro Roaster | ESI | 1 |
$3,500.00 |
$3,500.00 |
| Microwave Oven | Amana lgt duty 1000 wt | Zesco | 1 |
$200.00 |
$200.00 |
| Refrigerator | 27 1/2″ Undercounter | Zesco | 1 |
$837.00 |
$837.00 |
| Refrigerator | Upright beverage – True | Zesco | 1 |
$1,092.00 |
$1,092.00 |
| Freezer | Chest | Zesco | 1 |
$379.00 |
$379.00 |
| Ice Machine | Undercounter | Zesco | 1 |
$1,096.00 |
$1,096.00 |
| Dipperwell | w/faucet | Zesco | 1 |
$154.50 |
$154.50 |
Supplies: Total $2,667.94
| Item | Description | Supplier | Number |
Per Item Cost |
Total Cost |
| Detergent | Espresso cleaning | ESI | 1 |
$7.57 |
$7.57 |
| Barspoon | ESI | 1 |
$2.15 |
$2.15 |
|
| Nail Brush | Zesco | 1 |
$8.70 |
$8.70 |
|
| Cleaning Brush | Group head O-Ring | ESI | 1 |
$4.38 |
$4.38 |
| Cleaning Brush | Airpot | ESI | 1 |
$3.75 |
$3.75 |
| Cleaning brush | flat grounds | ESI | 1 |
$3.09 |
$3.09 |
| Cleaning blank | back flush | ESI | 1 |
$3.58 |
$3.58 |
| Foam Cups – hot | 8oz – 1000 count | ESI | 1 |
$39.33 |
$39.33 |
| Foam Cups – hot | 12 oz – 1000 count | ESI | 1 |
$55.92 |
$55.92 |
| Foam Cups – hot | 16 oz – 1000 count | ESI | 1 |
$63.92 |
$63.92 |
| Insulated Cups – hot | 20 oz – 500 | ESI | 1 |
$64.42 |
$64.42 |
| Plastic Cups – cold | 12 oz – 500 | ESI | 1 |
$36.83 |
$36.83 |
| Plastic Cups – cold | 12 oz – 500 | ESI | 1 |
$36.88 |
$36.88 |
| Plastic Cups – cold | 16 oz – 500 | ESI | 1 |
$51.72 |
$51.72 |
| Lid – Hot | 8 oz – 1000 count | ESI | 1 |
$28.36 |
$28.36 |
| Lid – Hot | 12/16 oz – 1000 count | ESI | 1 |
$36.58 |
$36.58 |
| Domed Lid | 12/16/20 oz 1000 | ESI | 2 |
$36.58 |
$73.16 |
| Lid – Cold | flat 12 oz 1000 count | ESI | 1 |
$36.51 |
$36.51 |
| Lid – Cold | flat 16/20 oz 1000 count | ESI | 1 |
$44.72 |
$44.72 |
| Lid – Cold | dome 12 oz – 1000 count | ESI | 1 |
$52.09 |
$52.09 |
| Lid – Cold | dome 16 oz – 1000 count | ESI | 1 |
$67.41 |
$67.41 |
| Bus Boxes | Zesco | 5 |
$4.70 |
$23.50 |
|
| Mugs | 3 oz Barista – 3 doz | Zesco | 1 |
$180.00 |
$180.00 |
| Mugs | 8 oz barista – 3 doz | Zesco | 1 |
$201.00 |
$201.00 |
| Mugs | 12 oz Barista – 2 doz | Zesco | 1 |
$152.00 |
$152.00 |
| Saucers | 5 1/4 ” Barista – 3 doz | Zesco | 1 |
$118.00 |
$118.00 |
| Saucers | 6 1/2″ Barista- 3 doz | Zesco | 2 |
$128.00 |
$128.00 |
| Demitasse Spoons | 1 doz | ESI | 2 |
$3.00 |
$6.00 |
| Plasticware | Spoons/Forks/Knives | Costco | 2 |
$6.00 |
$12.00 |
| Flatware | Spoons – 3 doz | Zesco | 2 |
$35.60 |
$71.20 |
| Flatware | Forks 3 doz | Zesco | 2 |
$49.70 |
$99.40 |
| Utility Cart | 300 lb capacity | Zesco | 2 |
$230.00 |
$460.00 |
| Stir Sticks | wooden 1000 count | ESI | 2 |
$1.57 |
$3.14 |
| Straws | Individually Wrap 500 cnt | ESI | 3 |
$2.72 |
$8.16 |
| Coffee Bags | 1 lb bags – 50 cnt | ESI | 3 |
$6.38 |
$19.14 |
| Coffee Bags | 1/2 lb bags – 50 cnt | ESI | 3 |
$5.45 |
$16.35 |
| Coffee Filters | 13×5 1000/case | ESI | 1 |
$12.02 |
$12.02 |
| Carrier | 4 cup carrier- 300 cnt | ESI | 1 |
$52.57 |
$52.57 |
| Java Jackets | 1500 cnt | ESI | 1 |
$87.21 |
$87.21 |
| Condiment Dispensers | Salt & Pepper shakers | Dollar Store | 6 |
$1.00 |
$6.00 |
Furniture & Fixtures: Total $10,570.50
| Item | Description | Supplier | Number |
Per Item Cost |
Total Cost |
| Menu Board | Laminated | Eckel Sign Co | 1 |
$150.00 |
$150.00 |
| Cash Register | Restaurant POS System | 1 |
|
|
|
| Hand Sink | w/ faucet | Zesco | 1 |
$73.10 |
$73.10 |
| 3 Compartment Sink | 94″ w/ 2 drainboards | Zesco | 1 |
$612.00 |
$612.00 |
| Faucet | 3 comp sink | Direct Buy | 1 |
$100.00 |
$100.00 |
| Prep Sink | TBD | Zesco | 1 |
$100.00 |
$100.00 |
| Mop Sink | Zesco | 1 |
$170.00 |
$170.00 |
|
| Trade Scale | 10 lb Avert Berkel Digital | Zesco | 1 |
$342.00 |
$342.00 |
| Chairs | Zesco | 90 |
$53.10 |
$4,779.00 |
|
| Stools | Zesco | 12 |
$88.60 |
$1,063.20 |
|
| Table Tops | 24×24 | Zesco | 30 |
$22.70 |
$681.00 |
| Table Tops | 24×42 | Zesco | 10 |
$35.40 |
$354.00 |
| Table Bases | 22×22 | Zesco | 30 |
$27.00 |
$810.00 |
| Table Bases | 33×33 | Zesco | 10 |
$34.00 |
$340.00 |
| Bakery Case | Zesco |
|
|
||
| Storage Shelving | Amco II | Zesco | 20 |
$38.60 |
$772.00 |
| Stackable high chairs | Zesco | 3 |
$63.90 |
$4,191.70 |
|
| Lighting | Direct Buy |
|
|
||
| Hand Towel Dispenser | Zesco | 1 |
$32.50 |
$32.50 |
Start-up Inventory: Total $1,812.96
| Item | Description | Supplier | Number |
Per Item Cost |
Total Cost |
| Espresso Beans | Lavazza 6/2.2 lb case | ESI | 2 |
$102.93 |
$205.86 |
| Decaf Espresso Beans | Lavazza 1.1 lb | ESI | 2 |
$9.70 |
$19.40 |
| Green Beans | Columbian Supremo | ESI | 2 |
$75.45 |
$150.90 |
| Green Beans | Costa Rican Tarrazu | ESI | 1 |
$89.48 |
$89.48 |
| Green Beans | Tanazanian Peaberry | ESI | 1 |
$66.35 |
$66.35 |
| Green Beans | Indian | ESI | 1 |
$64.08 |
$64.08 |
| Green Beans | Nicaraguan | ESI | 1 |
$74.32 |
$74.32 |
| Green Beans | Guatemala Antigua | ESI | 1 |
$79.25 |
$79.25 |
| Green Beans | Peru Organic | ESI | 1 |
$74.04 |
$74.04 |
| Green Beans | Columbian Decaf | ESI | 1 |
$72.50 |
$72.50 |
| Green Beans | Costa Rican Decaf | ESI | 1 |
$81.25 |
$81.25 |
| 1883 Flavored Syrup | 6 per case | ESI | 4 |
$37.38 |
$149.52 |
| 1883 Syrup Pumps | No Charge | ESI | 12 |
$0.00 |
$0.00 |
| 1883 Syrup Rack | No Charge | ESI | 1 |
$0.00 |
$0.00 |
| Sugar-Free Syrups | DaVinci | ESI | 4 |
$5.82 |
$23.28 |
| Chai Syrup | DaVinci 750 ml bottle | ESI | 2 |
$6.49 |
$12.98 |
| DaVinci Pumps | No charge | ESI | 8 |
$0.00 |
$0.00 |
| Chocolate Sauce | DaVinci 6/64 case | ESI | 1 |
$42.81 |
$42.81 |
| White Chocolate Sauce | DaVinci 6/64 case | ESI | 1 |
$42.81 |
$42.81 |
| Caramel Sauce | DaVinci 6/64 case | ESI | 1 |
$48.44 |
$48.44 |
| Sauce Pumps | DaVinci – No Charge | ESI | 3 |
$0.00 |
$0.00 |
| Fruit Smoothie Base | Case | ESI | 3 |
$54.42 |
$163.26 |
| Pwd Smoothie Base | Case | ESI | 2 |
$24.96 |
$49.92 |
| N20 Chargers | 24/case | ESI | 1 |
$13.85 |
$13.85 |
| Stash Tea Display | No charge | ESI | 1 |
$0.00 |
$0.00 |
| Stash Tea | Start-up case | ESI | 1 |
$24.57 |
$24.57 |
| Milk | 2% Gal 4/case | Clover Super Foods | 2 |
$2.38 |
$4.76 |
| Milk | Skim gal 4/case | Clover Super Foods | 1 |
$2.53 |
$2.53 |
| Milk | Soy 32 oz 12/case | Clover Super Foods | 1 |
$16.48 |
$16.48 |
| Milk | Half/Half | Clover Super Foods | 1 |
$8.27 |
$8.27 |
| Sugar | packets 2000 ct | Clover Super Foods | 1 |
$10.84 |
$10.84 |
| Equal | packets 2000 ct | Clover Super Foods | 1 |
$35.74 |
$35.74 |
| Bakery | Cheesecake – Amaretto | Clover Super Foods | 1 |
$14.39 |
$14.39 |
| Bakery | Choc Chip Cheesecake | Clover Super Foods | 1 |
$15.54 |
$15.54 |
| Bakery | Dipped Cheescake | Clover Super Foods | 1 |
$18.67 |
$18.67 |
| Bakery | Raspberry Cheescake | Clover Super Foods | 1 |
$16.43 |
$16.43 |
| Soft Drinks | Jones Soda 12 oz 24/cs | Clover Super Foods | 4 |
$15.95 |
$63.80 |
Products
Beverages and Baked Goods
Inspirational Grounds sells quality freshly roasted coffee, specialty beverages, and beverage related items to the discriminating coffee drinker. The beverages are made by trained staff members who know the products and make recommendations to customers.
The coffee varietals, teas, and other beverages items are supplied by Espresso Services, Inc and delivered within 24 hours. The roasting of the green beans will take place on-site for the freshest product possible. Owner will rely on customers and employees to shorten the communication and feedback loop in product and service offerings.
Inspirational Grounds will offer custom roasting services to our customers. Customers will be able to order selected coffee varietals roasted to order for enjoyment in their homes or offices. These custom roasted coffees will create a unique experience for our customer, and allow them to further their specialty coffee knowledge.
Books and Music
Containing Christian, uplifting, and life-affirming messages will be sold to complete the ambiance and community centered feel of the store.
3.1 Product Description
Inspirational Grounds sells the entire array of coffee and espresso-based drinks,specialty drinks, and bakery items, as well as music and books geared toward the spiritual reader.
Specialty Coffees
The primary product of Inspirational Grounds is the specialty coffee. Several unique blends will be micro roasted for daily serving or specially roasted to order at our customers’ request which will give our customers the variety they seek. These coffee blends include: Columbia Supremo, Tanzanian Peaberry, Jamaican Blue Mountain, Guatemalan Antigua, Costa Rican Tarrazu, Sumatra Mandheling, and Ethiopian Yaefacheffe. Other blends and decaffeinated coffee will be offered as well.
Espresso & Coffee Drinks
The Straight Shot – The foundation of every espresso beverage; served in a demitasse, when consumed alone.
Espresso Macchiato – Espresso served in a demitasse with a small amount of foamed milk on top
Espresso Con Panna – Variation of the Macchiato substituting whipped cream in place of the foamed milk.
Caffé Americano – A single or double shot of espresso is combined with hot water from the espresso machine. This produces a smoother and fresher (as well as hotter) cup of coffee than conventional brewing.
Cappuccino – Espresso mixed with foamed milk upon the pour; can be garnished with shaved chocolate.
Caffé Latte – Espresso mixed with steamed milk, and topped with foamed milk; can be garnished with shaved chocolate.
Mocha – Espresso, steamed milk, and chocolate syrup, usually topped with whipped cream and chocolate shavings.
The Breve – An extra rich Caffe’ Latte made with half & half instead of milk.
Café Au Lait – Drip coffee with steamed milk added and topped with foamed milk.
Flavor-Based Drinks
Hot Chocolate and Steamers – These drinks are made like lattes and mochas without the addition of coffee. Flavored syrups are added to steamed milk and may be topped with whipped cream at the customer’s request.
Italian Sodas and Creamosas – An Italian soda is a combination of flavored syrup and high quality carbonated mineral or soda water, served over ice. A creamosa is an Italian soda with heavy cream or half & half added and gently stirred to making a swirled appearance in the drink.
Granita – An Italian style granular ice drink similar to a slushy but much more dense in consistency.Granita flavors are usually coffee or fruit based
Other specialty drinks include: Gourmet hot tea, iced Tea, Chai, smoothies, blended coffee and tea-based drinks, and bottled soft drinks.
Books and Music
Books – The most popular titles will be stocked in limited supply. Such books as Woman, Thou are Loosed by T.D. Jakes; In Pursuit of Purpose, by Dr. Myles Munroe; Prayers That Heal The Heart, by Mark & Patti Virkler; A Fresh Word For Today, by Bob Gass; Run Baby Run, by Nicky Cruz; Morning By Morning, by Charles H. Spurgeon, and others.
Music – Inspirational Grounds will carry the finest in contemporary Christian music. Titles include Kirk Franklin; Mary Mary; Set Free; Audio Adrenaline; Yolanda Adams, and more.
Bakery Items
Inspirational Grounds will also offer its customers a variety of baked goods, including pastries, cookies, and cakes. Bread for sandwiches and buns for soup will also be secured. Negotiations with several local bakeries are now underway. Quality and consistency will be the determining factors for this decision.
3.2 Competitive Comparison
Inspirational Grounds will be unique in the vicinity. Not only will Inspirational Grounds differentiate itself from the strictly-coffee cafes by providing its customers with a theme based on sound spiritual principles, we will also be the first independently-owned, urban store to roast its own beans on-site, providing the customer with a unique experience in a welcoming environment.
3.3 Sales Literature
Inspirational Grounds will use print advertising and sales programs to get the word out to customers.
Fliers will be distributed throughout the Twin City area to chambers of commerce, tourism council offices, hotels, neighborhood stores and shops, churches, schools, and other areas one month before the grand opening.
Newspaper advertisements in Minneapolis and St. Paul, The Shepherd’s Guide, and neighborhood publications will be used to attract customers with grand opening offers, as well as 1,000 door-to-door flyers offering a free 16 oz. drink.
See attached example flier.
3.4 Sourcing
Inspirational Grounds has associated itself with the finest coffee supplier in the Twin Cities area, Espresso Services, Inc. We will bring fine coffees from all over the world to South Central Minneapolis, where residents, other Midtown tenants and passers-by can enjoy a freshly roasted quality cup of coffee, an espresso or specialty drink in an inviting and friendly atmosphere.
3.5 Technology
The technology Inspirational Grounds is dependant upon is the micro-roasting equipment it will use to roast the beans on-site. This equipment is serviced through the supplier;Espresso Services, Inc.
Inspirational Grounds will also use our website to advertise specials and events, and to post the monthly menu and talent offerings. We will use email to communicate with customers wishing to sign-up for email specials. Eventually, we would like to institute online ordering for roasted coffee and specialty merchandise, but that plan is at least two years off.
The Point of Sale (POS) technology Inspirational Grounds will use allows for order taking when the lines are long, keeps customer discount information, inventory, and revenue/profit information. The system has a battery back-up in case of power surges and temporary power losses.
The Inspirational Grounds’ logo will be Federally Trademarked. Although the beverages will not be protected in content, beverage names for specialty drinks reflecting the theme of the shop will be protected under the Federal Trademark laws.
The security system Inspirational Grounds uses will protect the contents of the store and reduce insurance premiums.
3.6 Future Products
As Inspirational Grounds grows, more features will be added to the existing store. A key part of this is the addition of live entertainment. This entertainment will be in the form of Jazz singers, poetry readings, Comedy for the King, motivational speakers, and Christian musical Artists.
Food items will be added to the menu of offerings. The soup will be made fresh daily, one kind per week. The soups are: Chicken Noodle, Minestrone, Clam Chowder, Vegetable Beef, Vegetable, Chicken and Rice, and Wild rice. Sandwiches are made to order and include deli favorites such as herbed turkey, egg salad, tuna salad, roast beef, corned beef, and turkey. A variety of condiments will also be available. Inspirational Grounds will obtain deli meats from Costco. The salad sandwiches will be made fresh on-site.
Inspirational Grounds will establish itself as the destination for non-secular and motivational entertainment. We also envision adding meeting rooms, hosting receptions, and adding small devotional rooms for private reflection. The meeting rooms will be perfect for small business and non-profit organizations with limited office space. Coffee and pastries will be served to ensure a successful atmosphere for business. Inspirational Grounds will also be available for private receptions, such as birthday parties, anniversaries, or showers. Customer provided catering will go a long way to ensure the guests’ parties are successful. The devotional rooms will be wired for individual music selection, equipped with one-way TV cameras, and furnished with a comfortable chair and table.
These additions complete the vision for Inspirational Grounds, and provide its customers with a place for socialization, relaxation, and reflection.
Market Analysis Summary
Inspirational Grounds is faced with the exciting challenge of being the first-mover in the Minneapolis/St. Paul Christian coffee house and roaster market. The consistent popularity of coffee and specialty drinks, combined with the ever growing and ever profitable Christian bookselling and music market, is a winning concept and will produce overwhelming results. Our target market includes coffee drinkers, spiritual seekers, Christians seeking fellowship (and snacks), and local neighborhood residents.
4.1 Market Segmentation
Census data, religous adherent research, and coffee consumption statistics were used to determine market share for Inspirational Grounds. Recent census data shows that there are 38,860 persons in the 55407 zip code, and 1,126,944 persons in Hennepin county. Coffee Research Institute data shows that 54% of the population drinks coffee daily, and 25% drink coffee occasionally. The Glenmary Research Institute shows that 64.9% of the Minnesota population are self-professed religous adherents. Minnesota ranks 5th in the nation for percentage of population religiously affiliated. National statistics show that most persons do not travel more than 20 minutes to eat or listen to entertainment; we are using a conservative 10%. The following is a breakdown of target customers:
55407 Market
| AGE | % of Population |
| 15-19 | 7.1% |
| 20-24 | 8.4% |
| 25-44 | 35.8% |
| 45-64 | 17.3% |
| TOTAL | 68.6% |
| INCOME | % of Population |
| 15,000-24,999 | 16.5% |
| 25,000-49,999 | 29.0% |
| 50,000-99,999 | 28.6% |
| TOTAL | 74.1% |
55407 market = (38,860 x 68.6% 15-64 year olds, x 74.1% in targeted income bracket, x 54% coffee drinkers) + (38,860 x 68.6% x 74.1% x 25% occasional coffee drinkers)
The formula takes the total 55407 population and then multiplies that number by the percentages in order of importance, that figure is multiplied by the percent of persons who drink coffee daily. The next formula is calculated the same except it uses the percentage of person who drink coffee occasionally.
Hennepin County Market
| AGE | % of Population |
| 15-19 | 6.5% |
| 20-24 | 7.3% |
| 25-44 | 33.1% |
| 45-64 | 22.2% |
| TOTAL | 69.1% |
| INCOME | % of Population |
| 15,000-24,999 | 10.8% |
| 25,000-49,999 | 23.9% |
| 50,000-99,999 | 37.6% |
| TOTAL | 72.3% |
Hennepin County Market = ((1,126,944 – 38,860) x 69.1% x 72.3% x 64.9% x 54% x 10%) + ((1,126,944 – 38,860) x 69.1% x 72.3% x 64.9% x 25% x 10%))
The formula takes the total county population minus the 55407 population and then multiplies that number by the percentages in order of importance, that figure is multiplied by the percent of persons who drink coffee daily multiplied by the percentage of the population likely to travel to Inspirational Grounds. The next formula is calculated the same except it uses the percentage of person who drink coffee occasionally.

| Market Analysis | |||||||
| Year 1 | Year 2 | Year 3 | Year 4 | Year 5 | |||
| Potential Customers | Growth | CAGR | |||||
| Neighborhood Resident | 1% | 13,165 | 13,297 | 13,430 | 13,564 | 13,700 | 1.00% |
| Religious Adherent – Henn County | 1% | 19,731 | 19,928 | 20,127 | 20,328 | 20,531 | 1.00% |
| Other | 0% | 10,000 | 10,000 | 10,000 | 10,000 | 10,000 | 0.00% |
| Total | 0.77% | 42,896 | 43,225 | 43,557 | 43,892 | 44,231 | 0.77% |
4.2 Target Market Segment Strategy
The customers will be between 15-64 years old. The income level is between $15,000 and $99,000 annually. They live in the 55407 zip code, the proposed area for Inspirational Grounds. The Hennepin county customer is between 15-64 with income levels ranging from $15-99K annually. They live in the Hennepin county area and are self-professed religious adherents. A limited number, estimated at about 10,000 will come from other areas out of curiosity or to see a particular entertainer or poetry reading. A majority of the customers will be persons who enjoy a relaxing atmosphere, reading, reflection, and excellent coffee.
4.2.1 Market Trends
The specialty beverage market will continue to grow as younger people are opting for non-alcoholic beverages and wholesome entertainment. Religious book retail sales grew 2.3% in 2002. In 2000 they represented 5.25% of all book sales resulting in $1.25 billion in revenue. In 2001, these sales grew 4.7% to $1.3 billion and market share grew to 5.5%. With the increasing interest in spirituality, sales and market share will increase steadily.
4.2.2 Market Growth
The Hennepin County area is expected to grow .8% annually. The 55407 zip code area is expected to grow 1% annually. These estimates are based on most recent census data and projected growth rate for the the Minneapolis area.
4.2.3 Market Needs
Current trends and historical sales data both indicate that the high demand for coffee will remain constant over the next five years. The Christian book and music business is expected to continue to grow as contemporary Christian artists rival secular music. In addition to the increased sales in these areas, Generation X’ers are more religious than their parents, according the GlenMary Research Institute.
The needs of this market are decidedly soft in nature. The soft needs of this market include, but are not limited to, a general feeling of acceptance, a place of belonging, and non-judgmental atmosphere.
4.3 Industry Analysis
The retail coffee industry in the Twin Cities experienced rapid growth at the beginning of the 90’s and is now moving into the mature stage of its life cycle. Many factors contribute to the demand for excellent coffee and specialty beverages in Minneapolis. The climate in Minneapolis is extremely conducive to coffee consumption; coffee consumption increases in colder months. Current trends in the Midwest reflect the popularity of fresh, quality coffee and specialty drinks, Minneapolis/St. Paul boasts sophisticated coffee lovers.
The popularity of Christian entertainment is growing immensely as people are searching for meaning during these uncertain times. Those who are familiar with Christian music and book trends and sales are looking for authors and performers to keep up with the seemingly insatiable demand.
Due to competition, cafe owners must look for ways to differentiate their place of business from others in order to achieve and maintain a competitive advantage. The founder of Inspirational Grounds realizes the need for differentiation and strongly believes that combining freshly roasted coffee, a cafe, spiritual books and music, and entertainment are the keys to success. The fact that no other such cafes are established in the Twin Cities presents Inspirational Grounds with a chance to enter the window of opportunity and take hold of a very profitable niche market.
4.3.1 Competition and Buying Patterns
Inspirational Grounds will face competition on two fronts: coffee retailers and book & music stores. The good news is that Inspirational Grounds does not currently face any direct competition from other cafes in the market. There are no independently operated Christian cafes in the Twin Cities. Christian based coffee houses are either located within, or owned by a church.
Heavy competition in the Twin Cities area creates an industry where cafes face the same costs. There is a direct relationship between price and quality of coffee. Some fresh roasted coffee retails from $12/lb while other more exotic beans may sell as high as $40/lb. Wholesalers sell green (unroasted) beans to retailers at an average of 50-75% discount. For example; a pound of Columbian Supremo beans wholesale for $3.06 and retails for $12.85. As in most industries, price decreases as volume increases.
4.3.2 Main Competitors
The main competitor in the retail coffee segment is Dunn Bros, as they also sell freshly roasted beans. In fact, the largest part of Dunn Bros’ revenue is generated from the sale of the roasted beans to the consumer. The difference is Dunn Bros. does not roast their beans on-site, nor do they have the ability to custom roast for their customers.
Dunn Bros. – Uptown
Local chain cafe that boasts freshly roasted beans. The bulk of these sales are in the form of roasted beans sold to the consumer. The cafe caters to customers who want fresh beans and brewed coffee. The atmosphere is homey, the prices are competitive, no entertainment is provided. They are known for good quality coffee. The stores are clean and well managed.
Vera’s – Lynn/Lake
A nice specialty coffee cafe with an atmosphere that caters to the “Green Peace” crowd. They have competitive prices, good quality coffee, and an excellent location. The cafe has three rooms; one with tables and chairs, one with couches and over-stuffed chairs, the third “room” is an outside patio. Vera’s doesn’t offer entertainment, on-site roasted coffee, or books and music.
Boathouse Coffee – 42nd & Cedar Ave South
Serves specialty coffee drinks, sandwiches, soft drinks, and ice cream. The street is busy, there is not a lot of foot traffic, and there is no parking lot so the location doesn’t allow for easy access. The shop is clean and prices are competitive. The Boathouse Coffee Cafe has several tables, and a couch. It can accommodate about 25 patrons.
4.3.3 Industry Participants
There are countless coffee wholesalers who could conceivably do business with Inspirational Grounds. These wholesalers distribute coffee and espresso beans to restaurants and retailers. Competition in this industry creates an even amount of bargaining power between buyers and suppliers resulting in competitive pricing.
Strategy and Implementation Summary
Inspirational Grounds uses a strategy of total market service. Our promise is in our uniqueness in the market and the products we sell, the people we attract, the atmosphere we create.
We will create an atmosphere that lures the “spiritual seeker.” The “coffee lover” and others will come because of the quality and the atmosphere. Ultimately, we aren’t selling either products or coffee. We are selling the experience. We want to be part of the community, part of their lives, part of the search for meaning.
Strategic Assumptions:
- Every person is a potential customer and all potential markets experience growth.
- Marketing to the soft needs of the customer will produce sales of products.
5.1 Value Proposition
Inspirational Grounds will position itself as an upscale coffee house, spiritual resource and entertainment provider. It will serve on-site roasted, high quality coffee and espresso, as well as specialty beverages at a competitive price. Due to the number of coffee shops in the Minneapolis area, it is important that Inspirational Grounds set competitive prices for the freshly roasted coffee. Customers will see coffee as it roasts throughout the day, and they will be able to order coffee beans roasted to their specifications while they enjoy a beverage.
5.2 Competitive Edge
The competitive advantage of Inspirational Grounds is threefold:
Our uniqueness in the market – Inspirational Grounds will be the only spiritually centered coffee shop in the Twin Cities metropolitan area which roasts its own beans daily, sells quality coffee and espresso based beverages, and specialty drinks, along with inspirational music and books. Inspirational Grounds is upscale, not stuffy. Our community-based focus will be hard to duplicate, even if products and service are similar.
Excellent Customer Service – Because competition in the specialty beverage market is high, Inspirational Grounds will work to ensure that each customer is treated in the same respectful manner as the next. Technology will play a key role in ensuring that our customers get that special one-on-one feeling they might experience at a high-end retail store. Our Point of Sale system will not just ring orders, but keep key data on customers’ previous purchases in the area of freshly roasted coffee. In this manner, sales staff will know about the customer’s buying habits and tastes, and will be able to make suggestions for purchases that will likely result in increased sales and make the customer feel special.
Excellent service in a community focused environment will be a unique undertaking. We will ensure that Inspirational Grounds is a fun place for people to gather. Inspirational Grounds will employ the principles that make Seattle’s World Famous Pike Place Fish Market an invigorating experience for customers. These principles are: Play, Make Their Day, Be there, and Choose Your Attitude. We will ensure that each employee understands the fundamentals at the base of any successful service organization.
Quality – We are committed to serving only the best quality beans and beverages. Moreover, the training the staff receives will ensure that the art of espresso making is understood. There is more to a good espresso than the beans and the machine. At Inspirational Grounds, we understand it, and will ensure our customers do as well.
It’s the combination of these three elements that make up the competitive advantage of Inspirational Grounds.
5.3 Marketing Strategy
Inspirational Grounds’ marketing strategy focuses on the key elements of the target markets’ soft needs, and the focus of the venture.
Soft Needs:
- Spiritual Growth
- A place of belonging
- Learning & communication
Venture Focus:
- On-Site Roasted Coffee
- Community Involvement
5.3.1 Pricing Strategy
Pricing in this industry is very competitive. The price of freshly brewed coffee and specialty beverages doesn’t vary by more than a few cents between the corner coffee shop and the large chains.
The price of roasted coffee beans can vary. Larger chains, having the benefit of volume, can charge slightly lower prices per pound. Inspirational Grounds will charge a slightly higher price as our coffees are freshly roasted on-site daily. Inspirational Grounds will roast its coffee to maximize the flavor of the specific bean. We will also roast coffee to the customer’s specifications. This strategy of bringing the customer in to the whole coffee experience, gives the customer an additional service, for which a slightly higher price will not be deemed excessive.
5.3.2 Promotion Strategy
Inspirational Grounds will use several ways to reach new customers. We will leverage schools, churches, community organizations, print ad, internet advertising and word of mouth.
1. Advertising–We’ll be developing our core positioning message: “On-Site Roasted Coffee, Made to Order.” to differentiate our service from the competition.
2. Postcards— Inspirational Grounds will employ targeted mailings to our 55407 customer base. These postcards will announce Grand Opening Specials.
3. Internet Advertising–As customers come in, they will be asked if they wish to sign up on our internet mailing list. Special promotions will be available only through Internet “coupons.”
4. Media–Inspirational Grounds will work with local media on several different “story of interest” venues. The Homework Happy Hour is one example that would gain media attention at no cost to Inspirational Grounds.
5.3.3 Marketing Programs
The programs Inspirational Grounds will initiate are depicted on the following graphs. These programs support the soft needs and product offerings listed in the Marketing Strategy section, and have been transliterated into “Vision Focus” and “Customer Focus” programs.
Vison Focus
- Community Involvment
- Community Reinvestment
- MCDA Hiring Program
- Spiritual Information
- Product Offerings
- Speakers and Entertainment
- Welcoming Environment
- Vision Communication
Customer Focus
- Roasting Expertise
- Micro Roasting Program
- Custom Offerings
- POS System
- Excellent Training
- EST Training Programs
- Encourage F.I.S.H. Philosophy
5.3.4 Positioning Statement
For the Christian who needs a place to seek, have fun, relax, and enjoy quality beverages, Inspirational Grounds is a place to feel welcome, special, informed, and energized. Inspirational Grounds meets the needs of this market. Unlike the other coffee shops in the metro area, Inspirational Grounds has character and a purpose.
For the neighborhood, Inspirational Grounds brings a positive message with a community centered focus. This is a place where all are welcomed and embraced with a warm greeting and hot coffee. The look and feel of the shop will ensure that anyone who walks through the door feels right at home. We want our customers to learn about coffee, and experience quality first hand.
5.4 Sales Strategy
The trained baristas at Inspirational Grounds will handle the sales transactions. To speed up the customer service, at least two employees will be servicing clients–while one employee prepares the customer’s order, the other one will take care of the sales transaction. All sales data logged on the computerized point-of-sale terminal will later be analyzed for marketing, Cost of Sale, and volume purposes.
In order to build up its client base, Inspirational Grounds will use banners, fliers, postcards and other advertising, utilize customer referrals and cross-promotions with other businesses in the community. At the same time, we will use customer retention programs like drink punch-cards to make sure the customers are coming back and spending more at the coffee bar.
5.4.1 Sales Programs
Internet Coupons – As customers come into the store, they will asked if they’d like to put their name on the internet mailing list. Once added, these customers will receive special “internet only” solicitations for discounts and specials, as well as a calendar of events.
Community Based Programs – Inspirational Grounds will partner with community organizations, schools, and churches to provide unique offerings which strengthen the community and provide sales for the store. The Homework Happy Hour is a prime example of leveraging community needs with sound sales techniques and business practices.
Direct Mailing – Inspirational Grounds will periodically mail special product offerings to people in the 55407 zip code. This promotion will also be used to announce the Grand Opening of Inspirational Grounds.
5.4.2 Sales Forecast
Inspirational Grounds is taking a modest approach to forecasting. Inspirational Grounds is forecasting an 8% average growth which is in line with industry estimates. With our unique product and service offerings, along with our aggressive marketing strategies, the sales forecasts are actually on the conservative side.

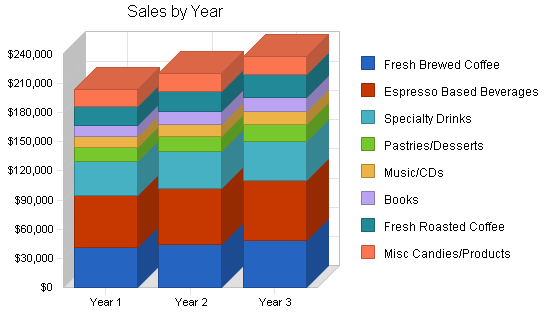
| Sales Forecast | |||
| Year 1 | Year 2 | Year 3 | |
| Sales | |||
| Fresh Brewed Coffee | $41,079 | $44,365 | $47,914 |
| Espresso Based Beverages | $53,507 | $57,788 | $62,411 |
| Specialty Drinks | $34,725 | $37,503 | $40,503 |
| Pastries/Desserts | $14,458 | $15,615 | $16,864 |
| Music/CDs | $11,604 | $12,765 | $14,041 |
| Books | $11,604 | $12,765 | $14,041 |
| Fresh Roasted Coffee | $19,341 | $21,275 | $23,402 |
| Misc Candies/Products | $17,121 | $17,977 | $18,876 |
| Total Sales | $203,440 | $220,053 | $238,054 |
| Direct Cost of Sales | Year 1 | Year 2 | Year 3 |
| Fresh Brewed Coffee | $1,370 | $1,397 | $1,425 |
| Espresso Based Beverages | $3,855 | $3,933 | $4,011 |
| Specialty Drinks | $7,216 | $7,289 | $7,361 |
| Fresh Roasted Coffee | $5,809 | $5,867 | $5,925 |
| Pastries/Desserts | $7,229 | $7,807 | $8,432 |
| Candies, etc. | $8,561 | $8,989 | $9,438 |
| Books/Music | $11,617 | $11,733 | $11,851 |
| Subtotal Direct Cost of Sales | $45,657 | $47,014 | $48,444 |
5.5 Strategic Alliances
Inspirational Grounds has aligned itself with key players in the industry: Espresso Services, Inc. located in Minneapolis, Minnesota, and the specialty Coffee Association of America. Both of these organizations are nationally and internationally known for their knowledge of, and expertise in, the specialty beverage industry.
Inspirational Grounds has also formed key alliances with non-competing experts in Restaurant and Retail markets.
Finally, Inspirational Grounds has established itself within the community through developing relationships with five of the surrounding Neighborhood Associations, key developers and planners of the Midtown Exchange project and various City Officials and city Counsel Members.
These alliances will serve to be conducive to the company’s success and marketability.
5.6 Milestones
The accompanying table lists important program milestones up to the date of opening. Further milestones, with dates and budgets for each, are currently being developed to line up our live-performance events and to meet our marketing and sales goals. These post-opening milestones are dependent on receiving adequate funds for opening.

| Milestones | |||||
| Milestone | Start Date | End Date | Budget | Manager | Department |
| Accounting Plan | 9/30/2003 | 10/15/2003 | $1,500 | ABC | Department |
| Personnel Plan | 10/1/2003 | 11/1/2003 | $500 | ABC | Department |
| Technology Systems | 10/1/2003 | 11/1/2003 | $1,500 | ABC | Department |
| Communication Systems | 10/1/2003 | 11/1/2003 | $1,500 | ABC | Department |
| Site Selection | 6/1/2003 | 2/1/2004 | $1,500 | Regina Brown | Owner |
| Business Plan | 7/1/2002 | 2/4/2004 | $500 | Regina Brown | Owner |
| Shop Design | 9/15/2003 | 10/1/2004 | $2,500 | Regina Brown | Owner |
| Secure Start-Up Funding | 5/1/2003 | 12/31/2004 | $150 | Albert Brown | Manager |
| Grand Opening Materials | 1/1/2005 | 1/15/2005 | $500 | ABC | Department |
| Opening Inventory | 1/5/2005 | 3/1/2005 | $2,500 | ABC | Department |
| Totals | $12,650 | ||||
Web Plan Summary
Inspirational Grounds will use our website to advertise specials and events, and to post the monthly menu. We will maintain a confidential email list to communicate with customers wishing to sign-up for email specials. Our website is being developed by the owners, and will be hosted with a professional hosting service which allows us to post our own changes as often as we wish.
Although we would eventually like to institute an on-line ordering system, we realize this development may have to wait until the business is firmly established and has sufficient cash for designing and maintaining these dynamic features. Online ordering will not only increase sales geographically, but allow Inspirational Grounds to utilize the full spectrum of its POS system’s capabilities.
Management Summary
Inspirational Grounds is owned by Regina Brown, and operated by Albert Brown. The company, being small, requires a simple organization structure. Implementation requires the owner, Regina Brown, to make decisions on the mission and vision, while Albert Brown makes operational decisions. Major decisions affecting the execution of the plan are made jointly by the owner and operations manager.
7.1 Personnel Plan
The personnel plan is included in the following table. It shows the owner’s and operations manager’s salaries, followed by 5 part-time salaries for espresso servers. Part time employees will collectively work 19.5 hours daily with an hourly salary of $8.00. Inspirational Grounds assumes a 5% annual increase in barista salaries. These employees will share any tips received while they are on duty. The owner will receive no payments or dividends until at least the fourth year of the business.
| Personnel Plan | |||
| Year 1 | Year 2 | Year 3 | |
| Albert Brown – Operations Manager | $18,000 | $18,000 | $25,000 |
| Owner | $0 | $0 | $0 |
| Baristas | $56,160 | $58,968 | $61,916 |
| Total People | 6 | 6 | 7 |
| Total Payroll | $74,160 | $76,968 | $86,916 |
7.2 Management Team
Regina Brown, owner and operator, has extensive start-up experience within the corporate sector and has successfully managed key areas for Fortune 500 companies. She has an entrepreneurial spirit which has made her corporate ventures successful. Her people savvy, and ability to turn vision into strategy, and strategy into tactics, will be key elements of success for Inspirational Grounds. She has successfully managed million dollar budgets. Currently, Regina is starting up a new venture within Wells Fargo Home Mortgage. This is her third start-up for that organization.
Albert Brown has start-up experience as well as restaurant management experience. Most recently Albert owned and operated RB Mortgage Company. Albert received a bachelor’s degree from Cheney University in Cheney, PA, a Juris Doctorate from Lasalle University, and is currently pursuing a Masters in Divinity at Bethel Seminary in St. Paul, MN. Albert has held several management positions within the restaurant industry.
Financial Plan
Inspirational Grounds is basing projected sales on the market research, industry analysis and proximity of other coffee houses in the area. We are looking to obtain a modest .1% of the market share.
The cost of goods sold is based on the price list of Espresso Services, Inc., and is consistent with costs in the coffee and espresso industry. The cost of the bakery items and candies is 50% of the selling price.
Inspirational Grounds will use its POS System to keep cash flow and sales goals on track, and to indicate which marketing efforts are worth the investment. We expect sales to easily exceed the break-even point from the first month onward. The following sections outline our projected Profit and loss, Cash Flow, and Balance Sheet.
8.1 Important Assumptions
We do not sell anything on credit. The personnel burden is very low because part-time workers receive no benefits. The long-term interest rate is extraordinarily low because of the MCDA business program which loans money to start-up ventures at a 2% annual interest rate.
Inspirational Grounds will obtain employees through MCDA’s community reinvestment programs, which further establishes our commitment to the community, and raises community awareness of our presence and purpose. We will also look to local seminaries to involve their students in a internship capacity.
| General Assumptions | |||
| Year 1 | Year 2 | Year 3 | |
| Plan Month | 1 | 2 | 3 |
| Current Interest Rate | 8.75% | 8.75% | 8.75% |
| Long-term Interest Rate | 2.00% | 2.00% | 2.00% |
| Tax Rate | 25.00% | 25.00% | 25.00% |
| Other | 0 | 0 | 0 |
8.2 Break-even Analysis
For our break-even analysis, we assume fixed costs of approximately $11,650 per month, which includes our full payroll, rent, and utilities, and an estimation of other running costs.
The chart shows that we need to sell about $15,000 per month to break-even, according to these assumptions. Our conservative projections will exceed the break-even point even in the first month of business.

| Break-even Analysis | |
| Monthly Revenue Break-even | $15,017 |
| Assumptions: | |
| Average Percent Variable Cost | 22% |
| Estimated Monthly Fixed Cost | $11,646 |
8.3 Projected Profit and Loss
Projected profit and loss are depicted in the table below. Payroll expenses reflect the annual salaries of operations manager and 5 part-time baristas. Rental Expense is based on leasing 2,000 square feet at $12.50 per square foot.
We project sales and marketing expenses at $12,000 for the first year. Inspirational Grounds will depend on curiosity, established community involvement and media human interest stories to spread the word, in addition to the tradition sales and marketing tactics.


| Pro Forma Profit and Loss | |||
| Year 1 | Year 2 | Year 3 | |
| Sales | $203,440 | $220,053 | $238,054 |
| Direct Cost of Sales | $45,657 | $47,014 | $48,444 |
| Other | $0 | $0 | $0 |
| Total Cost of Sales | $45,657 | $47,014 | $48,444 |
| Gross Margin | $157,783 | $173,038 | $189,610 |
| Gross Margin % | 77.56% | 78.63% | 79.65% |
| Expenses | |||
| Payroll | $74,160 | $76,968 | $86,916 |
| Marketing/Promotion | $12,000 | $15,000 | $18,000 |
| Depreciation | $2,004 | $2,000 | $2,000 |
| Leased Equipment | $3,000 | $3,000 | $3,000 |
| Utilities | $4,000 | $4,700 | $5,800 |
| Insurance | $1,800 | $1,900 | $2,000 |
| Rent | $28,380 | $31,691 | $33,100 |
| Website Hosting and Maintenance | $300 | $325 | $350 |
| Payroll Taxes | $11,113 | $11,545 | $13,037 |
| Other | $3,000 | $4,000 | $4,500 |
| Total Operating Expenses | $139,757 | $151,129 | $168,703 |
| Profit Before Interest and Taxes | $18,026 | $21,909 | $20,906 |
| EBITDA | $20,030 | $23,909 | $22,906 |
| Interest Expense | $1,528 | $1,400 | $1,267 |
| Taxes Incurred | $4,124 | $5,127 | $4,910 |
| Net Profit | $12,373 | $15,382 | $14,730 |
| Net Profit/Sales | 6.08% | 6.99% | 6.19% |
8.4 Projected Cash Flow
We will be a medium risk concern with steady cash flows. Sales are in cash, giving Inspirational Grounds an excellent cash structure. Solid product offerings and intelligent marketing will secure a cash balance of close to $48,000 by December 2005.

| Pro Forma Cash Flow | |||
| Year 1 | Year 2 | Year 3 | |
| Cash Received | |||
| Cash from Operations | |||
| Cash Sales | $203,440 | $220,053 | $238,054 |
| Subtotal Cash from Operations | $203,440 | $220,053 | $238,054 |
| Additional Cash Received | |||
| Sales Tax, VAT, HST/GST Received | $0 | $0 | $0 |
| New Current Borrowing | $0 | $0 | $0 |
| New Other Liabilities (interest-free) | $0 | $0 | $0 |
| New Long-term Liabilities | $0 | $0 | $0 |
| Sales of Other Current Assets | $0 | $0 | $0 |
| Sales of Long-term Assets | $0 | $0 | $0 |
| New Investment Received | $0 | $0 | $0 |
| Subtotal Cash Received | $203,440 | $220,053 | $238,054 |
| Expenditures | Year 1 | Year 2 | Year 3 |
| Expenditures from Operations | |||
| Cash Spending | $74,160 | $76,968 | $86,916 |
| Bill Payments | $102,996 | $125,217 | $133,830 |
| Subtotal Spent on Operations | $177,156 | $202,185 | $220,746 |
| Additional Cash Spent | |||
| Sales Tax, VAT, HST/GST Paid Out | $0 | $0 | $0 |
| Principal Repayment of Current Borrowing | $0 | $0 | $0 |
| Other Liabilities Principal Repayment | $0 | $0 | $0 |
| Long-term Liabilities Principal Repayment | $6,660 | $6,660 | $6,660 |
| Purchase Other Current Assets | $0 | $4,000 | $4,000 |
| Purchase Long-term Assets | $0 | $0 | $0 |
| Dividends | $0 | $0 | $0 |
| Subtotal Cash Spent | $183,816 | $212,845 | $231,406 |
| Net Cash Flow | $19,624 | $7,208 | $6,647 |
| Cash Balance | $50,224 | $57,432 | $64,080 |
8.5 Projected Balance Sheet
The following table shows our projected assets and liabilities over the next three years. We anticipate a steadily increasing net worth, as we pay off our loan and sales show modest increases. The Balance Sheet also reflects new current asset purchases in years 2 and 3.
| Pro Forma Balance Sheet | |||
| Year 1 | Year 2 | Year 3 | |
| Assets | |||
| Current Assets | |||
| Cash | $50,224 | $57,432 | $64,080 |
| Inventory | $4,418 | $4,549 | $4,688 |
| Other Current Assets | $12,000 | $16,000 | $20,000 |
| Total Current Assets | $66,642 | $77,982 | $88,767 |
| Long-term Assets | |||
| Long-term Assets | $16,000 | $16,000 | $16,000 |
| Accumulated Depreciation | $2,004 | $4,004 | $6,004 |
| Total Long-term Assets | $13,996 | $11,996 | $9,996 |
| Total Assets | $80,638 | $89,978 | $98,763 |
| Liabilities and Capital | Year 1 | Year 2 | Year 3 |
| Current Liabilities | |||
| Accounts Payable | $9,725 | $10,343 | $11,059 |
| Current Borrowing | $0 | $0 | $0 |
| Other Current Liabilities | $0 | $0 | $0 |
| Subtotal Current Liabilities | $9,725 | $10,343 | $11,059 |
| Long-term Liabilities | $73,340 | $66,680 | $60,020 |
| Total Liabilities | $83,065 | $77,023 | $71,079 |
| Paid-in Capital | $15,000 | $15,000 | $15,000 |
| Retained Earnings | ($29,800) | ($17,427) | ($2,045) |
| Earnings | $12,373 | $15,382 | $14,730 |
| Total Capital | ($2,427) | $12,955 | $27,685 |
| Total Liabilities and Capital | $80,638 | $89,978 | $98,763 |
| Net Worth | ($2,427) | $12,955 | $27,685 |
8.6 Business Ratios
The following table outlines some of the more important ratios from the Coffee Shop industry. The final column, Industry Profile, details specific ratios based on the industry as it is classified by the Standard Industry Classification (SIC) code, 5812.
Our business will be a little different from the standard coffee shop, in that we will also sell books and music. One of the major differences between us and the rest of the industry is our asset structure – most of our assets are short-term, rather than long-term, in part because of our extra inventory, but also because we will lease, rather than own, our space.
| Ratio Analysis | ||||
| Year 1 | Year 2 | Year 3 | Industry Profile | |
| Sales Growth | 0.00% | 8.17% | 8.18% | 5.24% |
| Percent of Total Assets | ||||
| Inventory | 5.48% | 5.06% | 4.75% | 2.72% |
| Other Current Assets | 14.88% | 17.78% | 20.25% | 32.59% |
| Total Current Assets | 82.64% | 86.67% | 89.88% | 41.88% |
| Long-term Assets | 17.36% | 13.33% | 10.12% | 58.12% |
| Total Assets | 100.00% | 100.00% | 100.00% | 100.00% |
| Current Liabilities | 12.06% | 11.49% | 11.20% | 21.75% |
| Long-term Liabilities | 90.95% | 74.11% | 60.77% | 29.17% |
| Total Liabilities | 103.01% | 85.60% | 71.97% | 50.92% |
| Net Worth | -3.01% | 14.40% | 28.03% | 49.08% |
| Percent of Sales | ||||
| Sales | 100.00% | 100.00% | 100.00% | 100.00% |
| Gross Margin | 77.56% | 78.63% | 79.65% | 55.74% |
| Selling, General & Administrative Expenses | 71.48% | 71.64% | 73.46% | 37.46% |
| Advertising Expenses | 0.99% | 0.91% | 0.84% | 2.06% |
| Profit Before Interest and Taxes | 8.86% | 9.96% | 8.78% | 1.50% |
| Main Ratios | ||||
| Current | 6.85 | 7.54 | 8.03 | 0.81 |
| Quick | 6.40 | 7.10 | 7.60 | 0.51 |
| Total Debt to Total Assets | 103.01% | 85.60% | 71.97% | 53.68% |
| Pre-tax Return on Net Worth | -679.90% | 158.31% | 70.94% | 2.39% |
| Pre-tax Return on Assets | 20.46% | 22.79% | 19.89% | 5.16% |
| Additional Ratios | Year 1 | Year 2 | Year 3 | |
| Net Profit Margin | 6.08% | 6.99% | 6.19% | n.a |
| Return on Equity | 0.00% | 118.73% | 53.20% | n.a |
| Activity Ratios | ||||
| Inventory Turnover | 10.90 | 10.49 | 10.49 | n.a |
| Accounts Payable Turnover | 11.59 | 12.17 | 12.17 | n.a |
| Payment Days | 27 | 29 | 29 | n.a |
| Total Asset Turnover | 2.52 | 2.45 | 2.41 | n.a |
| Debt Ratios | ||||
| Debt to Net Worth | 0.00 | 5.95 | 2.57 | n.a |
| Current Liab. to Liab. | 0.12 | 0.13 | 0.16 | n.a |
| Liquidity Ratios | ||||
| Net Working Capital | $56,917 | $67,639 | $77,709 | n.a |
| Interest Coverage | 11.80 | 15.65 | 16.50 | n.a |
| Additional Ratios | ||||
| Assets to Sales | 0.40 | 0.41 | 0.41 | n.a |
| Current Debt/Total Assets | 12% | 11% | 11% | n.a |
| Acid Test | 6.40 | 7.10 | 7.60 | n.a |
| Sales/Net Worth | 0.00 | 16.99 | 8.60 | n.a |
| Dividend Payout | 0.00 | 0.00 | 0.00 | n.a |
Appendix
| Sales Forecast | |||||||||||||
| Month 1 | Month 2 | Month 3 | Month 4 | Month 5 | Month 6 | Month 7 | Month 8 | Month 9 | Month 10 | Month 11 | Month 12 | ||
| Sales | |||||||||||||
| Fresh Brewed Coffee | 0% | $3,239 | $3,271 | $3,304 | $3,337 | $3,371 | $3,404 | $3,438 | $3,473 | $3,507 | $3,542 | $3,578 | $3,614 |
| Espresso Based Beverages | 0% | $4,219 | $4,261 | $4,304 | $4,347 | $4,390 | $4,434 | $4,479 | $4,523 | $4,569 | $4,614 | $4,660 | $4,707 |
| Specialty Drinks | 0% | $2,738 | $2,765 | $2,793 | $2,821 | $2,849 | $2,878 | $2,906 | $2,936 | $2,965 | $2,995 | $3,024 | $3,055 |
| Pastries/Desserts | 0% | $1,140 | $1,151 | $1,163 | $1,175 | $1,186 | $1,198 | $1,210 | $1,222 | $1,234 | $1,247 | $1,259 | $1,272 |
| Music/CDs | 0% | $915 | $924 | $933 | $943 | $952 | $962 | $971 | $981 | $991 | $1,001 | $1,011 | $1,021 |
| Books | 0% | $915 | $924 | $933 | $943 | $952 | $962 | $971 | $981 | $991 | $1,001 | $1,011 | $1,021 |
| Fresh Roasted Coffee | 0% | $1,525 | $1,540 | $1,556 | $1,571 | $1,587 | $1,603 | $1,619 | $1,635 | $1,651 | $1,668 | $1,685 | $1,701 |
| Misc Candies/Products | 0% | $1,350 | $1,364 | $1,377 | $1,391 | $1,405 | $1,419 | $1,433 | $1,447 | $1,462 | $1,476 | $1,491 | $1,506 |
| Total Sales | $16,041 | $16,201 | $16,363 | $16,527 | $16,692 | $16,859 | $17,028 | $17,198 | $17,370 | $17,544 | $17,719 | $17,896 | |
| Direct Cost of Sales | Month 1 | Month 2 | Month 3 | Month 4 | Month 5 | Month 6 | Month 7 | Month 8 | Month 9 | Month 10 | Month 11 | Month 12 | |
| Fresh Brewed Coffee | $108 | $109 | $110 | $111 | $112 | $114 | $115 | $116 | $117 | $118 | $119 | $120 | |
| Espresso Based Beverages | $304 | $307 | $310 | $313 | $316 | $320 | $323 | $326 | $329 | $332 | $336 | $339 | |
| Specialty Drinks | $569 | $575 | $580 | $586 | $592 | $598 | $604 | $610 | $616 | $622 | $629 | $635 | |
| Fresh Roasted Coffee | $458 | $463 | $467 | $472 | $477 | $481 | $486 | $491 | $496 | $501 | $506 | $511 | |
| Pastries/Desserts | 50% | $570 | $576 | $581 | $587 | $593 | $599 | $605 | $611 | $617 | $623 | $630 | $636 |
| Candies, etc. | 50% | $675 | $682 | $689 | $695 | $702 | $709 | $717 | $724 | $731 | $738 | $746 | $753 |
| Books/Music | $916 | $925 | $934 | $944 | $953 | $963 | $972 | $982 | $992 | $1,002 | $1,012 | $1,022 | |
| Subtotal Direct Cost of Sales | $3,600 | $3,636 | $3,672 | $3,709 | $3,746 | $3,784 | $3,821 | $3,860 | $3,898 | $3,937 | $3,977 | $4,016 | |
| Personnel Plan | |||||||||||||
| Month 1 | Month 2 | Month 3 | Month 4 | Month 5 | Month 6 | Month 7 | Month 8 | Month 9 | Month 10 | Month 11 | Month 12 | ||
| Albert Brown – Operations Manager | 0% | $1,500 | $1,500 | $1,500 | $1,500 | $1,500 | $1,500 | $1,500 | $1,500 | $1,500 | $1,500 | $1,500 | $1,500 |
| Owner | 0% | $0 | $0 | $0 | $0 | $0 | $0 | $0 | $0 | $0 | $0 | $0 | $0 |
| Baristas | 0% | $4,680 | $4,680 | $4,680 | $4,680 | $4,680 | $4,680 | $4,680 | $4,680 | $4,680 | $4,680 | $4,680 | $4,680 |
| Total People | 6 | 6 | 6 | 6 | 6 | 6 | 6 | 6 | 6 | 6 | 6 | 6 | |
| Total Payroll | $6,180 | $6,180 | $6,180 | $6,180 | $6,180 | $6,180 | $6,180 | $6,180 | $6,180 | $6,180 | $6,180 | $6,180 | |
| Pro Forma Profit and Loss | |||||||||||||
| Month 1 | Month 2 | Month 3 | Month 4 | Month 5 | Month 6 | Month 7 | Month 8 | Month 9 | Month 10 | Month 11 | Month 12 | ||
| Sales | $16,041 | $16,201 | $16,363 | $16,527 | $16,692 | $16,859 | $17,028 | $17,198 | $17,370 | $17,544 | $17,719 | $17,896 | |
| Direct Cost of Sales | $3,600 | $3,636 | $3,672 | $3,709 | $3,746 | $3,784 | $3,821 | $3,860 | $3,898 | $3,937 | $3,977 | $4,016 | |
| Other | $0 | $0 | $0 | $0 | $0 | $0 | $0 | $0 | $0 | $0 | $0 | $0 | |
| Total Cost of Sales | $3,600 | $3,636 | $3,672 | $3,709 | $3,746 | $3,784 | $3,821 | $3,860 | $3,898 | $3,937 | $3,977 | $4,016 | |
| Gross Margin | $12,441 | $12,565 | $12,691 | $12,818 | $12,946 | $13,076 | $13,206 | $13,338 | $13,472 | $13,607 | $13,743 | $13,880 | |
| Gross Margin % | 77.56% | 77.56% | 77.56% | 77.56% | 77.56% | 77.56% | 77.56% | 77.56% | 77.56% | 77.56% | 77.56% | 77.56% | |
| Expenses | |||||||||||||
| Payroll | $6,180 | $6,180 | $6,180 | $6,180 | $6,180 | $6,180 | $6,180 | $6,180 | $6,180 | $6,180 | $6,180 | $6,180 | |
| Marketing/Promotion | $1,000 | $1,000 | $1,000 | $1,000 | $1,000 | $1,000 | $1,000 | $1,000 | $1,000 | $1,000 | $1,000 | $1,000 | |
| Depreciation | $167 | $167 | $167 | $167 | $167 | $167 | $167 | $167 | $167 | $167 | $167 | $167 | |
| Leased Equipment | $250 | $250 | $250 | $250 | $250 | $250 | $250 | $250 | $250 | $250 | $250 | $250 | |
| Utilities | $300 | $300 | $300 | $300 | $300 | $300 | $300 | $300 | $400 | $400 | $400 | $400 | |
| Insurance | $150 | $150 | $150 | $150 | $150 | $150 | $150 | $150 | $150 | $150 | $150 | $150 | |
| Rent | $2,365 | $2,365 | $2,365 | $2,365 | $2,365 | $2,365 | $2,365 | $2,365 | $2,365 | $2,365 | $2,365 | $2,365 | |
| Website Hosting and Maintenance | 0% | $25 | $25 | $25 | $25 | $25 | $25 | $25 | $25 | $25 | $25 | $25 | $25 |
| Payroll Taxes | 15% | $927 | $927 | $927 | $927 | $927 | $927 | $927 | $927 | $916 | $927 | $927 | $927 |
| Other | $250 | $250 | $250 | $250 | $250 | $250 | $250 | $250 | $250 | $250 | $250 | $250 | |
| Total Operating Expenses | $11,614 | $11,614 | $11,614 | $11,614 | $11,614 | $11,614 | $11,614 | $11,614 | $11,703 | $11,714 | $11,714 | $11,714 | |
| Profit Before Interest and Taxes | $827 | $951 | $1,077 | $1,204 | $1,332 | $1,462 | $1,592 | $1,724 | $1,769 | $1,893 | $2,029 | $2,166 | |
| EBITDA | $994 | $1,118 | $1,244 | $1,371 | $1,499 | $1,629 | $1,759 | $1,891 | $1,936 | $2,060 | $2,196 | $2,333 | |
| Interest Expense | $132 | $131 | $131 | $130 | $129 | $128 | $127 | $126 | $125 | $124 | $123 | $122 | |
| Taxes Incurred | $174 | $205 | $237 | $269 | $301 | $333 | $366 | $400 | $411 | $442 | $476 | $511 | |
| Net Profit | $521 | $615 | $710 | $806 | $903 | $1,000 | $1,099 | $1,199 | $1,233 | $1,326 | $1,429 | $1,533 | |
| Net Profit/Sales | 3.25% | 3.80% | 4.34% | 4.88% | 5.41% | 5.93% | 6.45% | 6.97% | 7.10% | 7.56% | 8.07% | 8.57% | |
| Pro Forma Cash Flow | |||||||||||||
| Month 1 | Month 2 | Month 3 | Month 4 | Month 5 | Month 6 | Month 7 | Month 8 | Month 9 | Month 10 | Month 11 | Month 12 | ||
| Cash Received | |||||||||||||
| Cash from Operations | |||||||||||||
| Cash Sales | $16,041 | $16,201 | $16,363 | $16,527 | $16,692 | $16,859 | $17,028 | $17,198 | $17,370 | $17,544 | $17,719 | $17,896 | |
| Subtotal Cash from Operations | $16,041 | $16,201 | $16,363 | $16,527 | $16,692 | $16,859 | $17,028 | $17,198 | $17,370 | $17,544 | $17,719 | $17,896 | |
| Additional Cash Received | |||||||||||||
| Sales Tax, VAT, HST/GST Received | 0.00% | $0 | $0 | $0 | $0 | $0 | $0 | $0 | $0 | $0 | $0 | $0 | $0 |
| New Current Borrowing | $0 | $0 | $0 | $0 | $0 | $0 | $0 | $0 | $0 | $0 | $0 | $0 | |
| New Other Liabilities (interest-free) | $0 | $0 | $0 | $0 | $0 | $0 | $0 | $0 | $0 | $0 | $0 | $0 | |
| New Long-term Liabilities | $0 | $0 | $0 | $0 | $0 | $0 | $0 | $0 | $0 | $0 | $0 | $0 | |
| Sales of Other Current Assets | $0 | $0 | $0 | $0 | $0 | $0 | $0 | $0 | $0 | $0 | $0 | $0 | |
| Sales of Long-term Assets | $0 | $0 | $0 | $0 | $0 | $0 | $0 | $0 | $0 | $0 | $0 | $0 | |
| New Investment Received | $0 | $0 | $0 | $0 | $0 | $0 | $0 | $0 | $0 | $0 | $0 | $0 | |
| Subtotal Cash Received | $16,041 | $16,201 | $16,363 | $16,527 | $16,692 | $16,859 | $17,028 | $17,198 | $17,370 | $17,544 | $17,719 | $17,896 | |
| Expenditures | Month 1 | Month 2 | Month 3 | Month 4 | Month 5 | Month 6 | Month 7 | Month 8 | Month 9 | Month 10 | Month 11 | Month 12 | |
| Expenditures from Operations | |||||||||||||
| Cash Spending | $6,180 | $6,180 | $6,180 | $6,180 | $6,180 | $6,180 | $6,180 | $6,180 | $6,180 | $6,180 | $6,180 | $6,180 | |
| Bill Payments | $219 | $6,662 | $9,243 | $9,349 | $9,417 | $9,486 | $9,555 | $9,626 | $9,699 | $9,836 | $9,916 | $9,989 | |
| Subtotal Spent on Operations | $6,399 | $12,842 | $15,423 | $15,529 | $15,597 | $15,666 | $15,735 | $15,806 | $15,879 | $16,016 | $16,096 | $16,169 | |
| Additional Cash Spent | |||||||||||||
| Sales Tax, VAT, HST/GST Paid Out | $0 | $0 | $0 | $0 | $0 | $0 | $0 | $0 | $0 | $0 | $0 | $0 | |
| Principal Repayment of Current Borrowing | $0 | $0 | $0 | $0 | $0 | $0 | $0 | $0 | $0 | $0 | $0 | $0 | |
| Other Liabilities Principal Repayment | $0 | $0 | $0 | $0 | $0 | $0 | $0 | $0 | $0 | $0 | $0 | $0 | |
| Long-term Liabilities Principal Repayment | $555 | $555 | $555 | $555 | $555 | $555 | $555 | $555 | $555 | $555 | $555 | $555 | |
| Purchase Other Current Assets | $0 | $0 | $0 | $0 | $0 | $0 | $0 | $0 | $0 | $0 | $0 | $0 | |
| Purchase Long-term Assets | $0 | $0 | $0 | $0 | $0 | $0 | $0 | $0 | $0 | $0 | $0 | $0 | |
| Dividends | $0 | $0 | $0 | $0 | $0 | $0 | $0 | $0 | $0 | $0 | $0 | $0 | |
| Subtotal Cash Spent | $6,954 | $13,397 | $15,978 | $16,084 | $16,152 | $16,221 | $16,290 | $16,361 | $16,434 | $16,571 | $16,651 | $16,724 | |
| Net Cash Flow | $9,087 | $2,804 | $386 | $443 | $540 | $638 | $737 | $837 | $936 | $973 | $1,068 | $1,173 | |
| Cash Balance | $39,687 | $42,491 | $42,877 | $43,320 | $43,861 | $44,499 | $45,237 | $46,074 | $47,010 | $47,983 | $49,052 | $50,224 | |
| Pro Forma Balance Sheet | |||||||||||||
| Month 1 | Month 2 | Month 3 | Month 4 | Month 5 | Month 6 | Month 7 | Month 8 | Month 9 | Month 10 | Month 11 | Month 12 | ||
| Assets | Starting Balances | ||||||||||||
| Current Assets | |||||||||||||
| Cash | $30,600 | $39,687 | $42,491 | $42,877 | $43,320 | $43,861 | $44,499 | $45,237 | $46,074 | $47,010 | $47,983 | $49,052 | $50,224 |
| Inventory | $6,600 | $4,000 | $4,000 | $4,040 | $4,080 | $4,121 | $4,162 | $4,204 | $4,246 | $4,288 | $4,331 | $4,374 | $4,418 |
| Other Current Assets | $12,000 | $12,000 | $12,000 | $12,000 | $12,000 | $12,000 | $12,000 | $12,000 | $12,000 | $12,000 | $12,000 | $12,000 | $12,000 |
| Total Current Assets | $49,200 | $55,687 | $58,491 | $58,917 | $59,400 | $59,982 | $60,661 | $61,440 | $62,320 | $63,298 | $64,314 | $65,426 | $66,642 |
| Long-term Assets | |||||||||||||
| Long-term Assets | $16,000 | $16,000 | $16,000 | $16,000 | $16,000 | $16,000 | $16,000 | $16,000 | $16,000 | $16,000 | $16,000 | $16,000 | $16,000 |
| Accumulated Depreciation | $0 | $167 | $334 | $501 | $668 | $835 | $1,002 | $1,169 | $1,336 | $1,503 | $1,670 | $1,837 | $2,004 |
| Total Long-term Assets | $16,000 | $15,833 | $15,666 | $15,499 | $15,332 | $15,165 | $14,998 | $14,831 | $14,664 | $14,497 | $14,330 | $14,163 | $13,996 |
| Total Assets | $65,200 | $71,520 | $74,157 | $74,416 | $74,732 | $75,147 | $75,659 | $76,271 | $76,984 | $77,795 | $78,644 | $79,589 | $80,638 |
| Liabilities and Capital | Month 1 | Month 2 | Month 3 | Month 4 | Month 5 | Month 6 | Month 7 | Month 8 | Month 9 | Month 10 | Month 11 | Month 12 | |
| Current Liabilities | |||||||||||||
| Accounts Payable | $0 | $6,354 | $8,931 | $9,035 | $9,101 | $9,167 | $9,235 | $9,303 | $9,371 | $9,505 | $9,583 | $9,654 | $9,725 |
| Current Borrowing | $0 | $0 | $0 | $0 | $0 | $0 | $0 | $0 | $0 | $0 | $0 | $0 | $0 |
| Other Current Liabilities | $0 | $0 | $0 | $0 | $0 | $0 | $0 | $0 | $0 | $0 | $0 | $0 | $0 |
| Subtotal Current Liabilities | $0 | $6,354 | $8,931 | $9,035 | $9,101 | $9,167 | $9,235 | $9,303 | $9,371 | $9,505 | $9,583 | $9,654 | $9,725 |
| Long-term Liabilities | $80,000 | $79,445 | $78,890 | $78,335 | $77,780 | $77,225 | $76,670 | $76,115 | $75,560 | $75,005 | $74,450 | $73,895 | $73,340 |
| Total Liabilities | $80,000 | $85,799 | $87,821 | $87,370 | $86,881 | $86,392 | $85,905 | $85,418 | $84,931 | $84,510 | $84,033 | $83,549 | $83,065 |
| Paid-in Capital | $15,000 | $15,000 | $15,000 | $15,000 | $15,000 | $15,000 | $15,000 | $15,000 | $15,000 | $15,000 | $15,000 | $15,000 | $15,000 |
| Retained Earnings | ($29,800) | ($29,800) | ($29,800) | ($29,800) | ($29,800) | ($29,800) | ($29,800) | ($29,800) | ($29,800) | ($29,800) | ($29,800) | ($29,800) | ($29,800) |
| Earnings | $0 | $521 | $1,136 | $1,846 | $2,652 | $3,554 | $4,554 | $5,654 | $6,852 | $8,085 | $9,412 | $10,841 | $12,373 |
| Total Capital | ($14,800) | ($14,279) | ($13,664) | ($12,954) | ($12,148) | ($11,246) | ($10,246) | ($9,146) | ($7,948) | ($6,715) | ($5,388) | ($3,959) | ($2,427) |
| Total Liabilities and Capital | $65,200 | $71,520 | $74,157 | $74,416 | $74,732 | $75,147 | $75,659 | $76,271 | $76,984 | $77,795 | $78,644 | $79,589 | $80,638 |
| Net Worth | ($14,800) | ($14,279) | ($13,664) | ($12,954) | ($12,148) | ($11,246) | ($10,246) | ($9,146) | ($7,948) | ($6,715) | ($5,388) | ($3,959) | ($2,427) |

