
Good Earth Resources
Executive Summary
Objective
Nationwide, many landfills are closing or exhausting their remaining capacity, yet due to environmental restrictions, zoning laws, and other regulatory and bureaucratic delays, pitifully few new landfills are opening to offset the looming space crisis. Meanwhile municipal waste continues to flow in greater volume. Handling the nation’s waste stream has become a major problem for most municipalities. With more waste created daily, landfills nationwide are rapidly facing a capacity crisis. Landfills are akin to owning a reverse gold mine.
Good Earth Resources, Inc. (GER) has been formed to provide a solution for municipal waste problem in the St. Louis, Missouri area and capitalize on the lucrative benefits of possessing fully permitted landfills.
The Operation
There are four components in this operation: purchase two landfills; sort and recycle incoming waste; import an out-of-state waste stream; and convert landfill gas to either electricity or a fuel alternative.
GER will purchase the landfills, one in Eastern Missouri (Martin Creek Landfill) and one in Southern Illinois (Barton Sanitary Landfill). Both landfills are near St. Louis, Missouri and the initial waste stream for both landfills will emanate from the St. Louis area.
At both landfills, all waste will be sorted and recyclables removed. The remainder will be compacted, baled, and buried in the landfills. Today, only 10% of the landfills nationwide perform these functions, the remainder preferring to dump raw waste into their landfills, thereby ignoring a substantial source of income.
GER will accept direct delivery of waste to its landfills, dispatch its own road tractors to bring more distant waste, and rail-haul waste from New York City and Chicago. Hauling Missouri waste assures GER a steady waste stream, independent of other sources, to meet its income projections in the first month of operations. Initially, GER expects to accept as much as 1,540 tons to its landfills daily.
Unique Features
At the landfills incoming waste will be dumped into receiving facilities designed to contain waste vapors, control vectors, and house machinery. The waste is moved onto conveyers from which employee-sorters remove all paper, cardboard, glass, plastic, and metals. These will be sold for a substantial profit, and the remainder compressed into two-thirds cubic yard bales. Bales will be stacked in a large, PVC-wrapped cell in the landfill that allows efficient capture of the methane gas. Most landfills do none of this.
Removing recyclable materials and baling the remaining organic waste adds considerable value to GER’s asset base, the permitted property, by reducing the volume thereby adding to the life of the landfill. Further, recyclable sales add to gross revenues.
Landfill Valuation
Landfills are valued by the volume of waste in cubic yards (“air yards”) that can be deposited into the permitted area. By compacting, the deposited volume is increased five-fold. For instance, the Martin Creek landfill permit covers an area of 42 acres to accept 3,612,000 cubic yards. 2,000 cubic yards of loose waste buried daily without compaction would fill the landfill in 6+ years. By recycling, compacting and baling, 2,000 yards is reduced to 220 cubic yards and the life of the landfill is extended to 32 years. This increases both value and gross income.
The current fee per cubic yard of waste is $11.33 ($34.00 per ton) in the St. Louis area. 2,000 cubic yards/day of loose waste for 42 acres generates $35,328,000 in 6+ years. By recycling, compacting and baling, the same area can be used for 32 years and generates $176,640,000 or daily volume can be increased. Sorting and compacting costs are minor in comparison to the valuation increase, and recyclables offset these expenses.
Company Objectives
Anticipating agreements from waste haulers, GER expects to collect 940 tons daily for Barton in the first months of operations. This generates in excess of $5,500,000 revenues per year. An additional 600 tons/day for Martin Creek, transported to Barton during Martin Creek’s construction, adds $4,000,000 more. Investors can expect an outstanding annual return as well as ownership in a profitable business with dividends in the first year.
GER principals will seek other sources of waste to augment this projected waste stream, such as New York City, Chicago, and other large municipalities. Rail spurs are part of this plan and, once operational, will facilitate the incoming flow of waste from distant cities.
Within twelve months of commencing operations, GER will collect the methane gas and convert it to saleable energy in the form of either electricity sold into the national grid or methanol for sale as a gasoline alternative. This will augment annual revenues.
Management
The principals of GER are experienced in every aspect of this business and are founding this company to meet the growing need for sought-after landfills in the St. Louis area, as well as to operate a profitable business.
Don Smith, co-founder of GER, has extensive experience in waste collection, landfill operation, and waste handling. He operated three of Chicago’s major landfills during the mid 1980s, as well as one in Gary, Indiana. Later he managed a hazardous waste facility in Scott City, Missouri. His expertise in working with the Department of Natural Resources resulted in the landfill permit that the property now possesses. He constructed and operated a municipal waste transfer station in Wellston, Missouri in 1984.
John App, co-founder of GER, has a strong background in finance and marketing and will concentrate on developing the out-of-state waste stream sources from New York City and Chicago. Mr. App has owned and operated several businesses over the years as well as serving as a founding board member of Capital Bank of Carlsbad, California, being elected to the Orange County California Board of Education in 1974, and being a founding member of the Orange County California Marine Institute at Dana Point, California.
G. Calvin Rathbone, Esq. serves as corporate counsel to GER and with a strong sales background, will also assist in developing out of state waste stream sources. Mr. Rathbone’s previous experience includes manager of sales and marketing for a company providing equipment for the exploration and production of oil and gas.
General Plan of Action
At this time, the principals of GER are seeking a $16,469,951 net investment to:
- Purchase both the Martin Creek and Barton landfills.
- Augment the daily waste stream to Barton landfill by hauling waste.
- Install sorting and compacting machinery at Barton to maximize landfill life.
- Complete the construction of Martin Creek landfill.
- Lease or purchase machinery and vehicles needed for operations.
- Build two transfer stations to collect waste in Missouri cities.
- <solicit
- Utilize methane generated to augment revenues.
1.1 Objectives
- Sales in excess of $6,000,000 ($11,000,000 with an additional 600 tons/day designated for Martin Creek) for the first twelve months of operations by augmenting the incoming waste to Barton landfill and growing each year thereafter.
- Build the recycling facility at Barton with at least one compactor/baler installed and room for expansion to two compactor/balers.
- Construct Martin Creek landfill and extend the landfill permit to include an additional 80 acres.
- Purchase property to renovate an existing, abandoned rail spur near Barton landfill. Construction will require approximately ninety days.
- Continue to market Martin Creek and Barton by contacting and soliciting business from additional cities and hauling firms, including out-of-state sources.
1.2 Mission
In the instance where some waste haulers would normally direct waste to other landfills, GER will haul that waste from certain designated transfer stations to either of its two landfills. This will benefit both parties, since it will lower GER customer’s costs, and through GER’s more efficient transportation, will provide an additional waste stream to GER.

GER will remove and sell all recyclable materials. At the landfills, GER will accept used vehicle tires for income. Every aspect of this operation not only increases the cash flow, but also protects the environment. GER principals will take the necessary steps to utilize every resource to ensure environmental protection.
1.3 Keys to Success
- Concentrate on bringing to Martin Creek and Barton as much waste capacity as possible.
- Process the waste stream as efficiently and profitably as possible. Strive to reduce down time and stoppages.
- Operate the landfill operation as efficiently and safely as possible using every method to increase profits yet maintain a high concern for the environment.
- Maintain family-like atmosphere for all associated with GER, co-workers and customers alike.
Company Summary
GER intends to operate two landfills, Martin Creek and Barton. At both landfills, waste will be sorted to remove 99% of all recyclable materials. The remaining waste will be compacted into bales and deposited into the landfills.
Six months to one year after starting operations, management will commence capturing methane gas generated in the landfill and utilize it for commercial purposes as well as to generate all electricity for the landfill operations. (See Section on Operations for details on use of landfill gas).
2.1 Company Ownership
GER is a Missouri Corporation with ownership held in the following manner. There are three principals, one with operational duties and control, one with administrative duties and control, and a corporate counsel. Investors will receive an ownership percentage of the corporation, board of director seats, and first-out status of any liquidity plan. Ownership percentage will be based on investment and contribution.
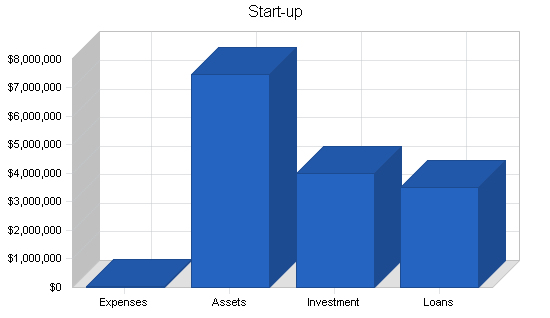
2.2 Start-up Summary
The principals seek $4,000,000 net in investor funds.
In phase one, the first funds will be utilized to close escrow on both Martin Creek and Barton landfills. Barton is a fully operational business. Hauling waste from the transfer stations will immediately augment the waste stream and revenues.
At Martin Creek, the construction phase involves complying with current state ordinances, installing additional monitoring wells, submitting a financial instrument, obtaining insurance, leasing equipment, and completing site development. This will require between seven and twelve months.
In phase two, management will install conveyers, compactors, and the baling systems. A permit to recycle incoming waste will be readily obtainable, since both states are eager to comply with federal requirements mandating recycling. Construction of this facility will require approximately six months.
Each site will have a facility to house a compactor/baler and expansion space for a second baling system. These facilities will be built after cash flow is assured and initial operations commence. Both landfills will have identical equipment.
Included in the purchase will be the rail spur sites and outlying transfer stations for both Barton and Martin Creek. Ongoing income will support rail spur renovation.
| Start-up | |
| Requirements | |
| Start-up Expenses | |
| Legal | $10,000 |
| Insurance | $10,672 |
| Total Start-up Expenses | $20,672 |
| Start-up Assets | |
| Cash Required | $129,328 |
| Other Current Assets | $350,000 |
| Long-term Assets | $7,000,000 |
| Total Assets | $7,479,328 |
| Total Requirements | $7,500,000 |
| Start-up Funding | |
| Start-up Expenses to Fund | $20,672 |
| Start-up Assets to Fund | $7,479,328 |
| Total Funding Required | $7,500,000 |
| Assets | |
| Non-cash Assets from Start-up | $7,350,000 |
| Cash Requirements from Start-up | $129,328 |
| Additional Cash Raised | $0 |
| Cash Balance on Starting Date | $129,328 |
| Total Assets | $7,479,328 |
| Liabilities and Capital | |
| Liabilities | |
| Current Borrowing | $3,500,000 |
| Long-term Liabilities | $0 |
| Accounts Payable (Outstanding Bills) | $0 |
| Other Current Liabilities (interest-free) | $0 |
| Total Liabilities | $3,500,000 |
| Capital | |
| Planned Investment | |
| Investment Amount | $4,000,000 |
| Other | $0 |
| Additional Investment Requirement | $0 |
| Total Planned Investment | $4,000,000 |
| Loss at Start-up (Start-up Expenses) | ($20,672) |
| Total Capital | $3,979,328 |
| Total Capital and Liabilities | $7,479,328 |
| Total Funding | $7,500,000 |
2.3 Company Locations and Facilities
GER intends to purchase the adjacent 293 acres to Martin Creek for the following reasons. The Missouri and Southern Rail line runs through this property and a rail spur can be constructed to accept rail cars loaded with waste from distant sources, (New York and Chicago). Owning this property will allow GER to haul waste from the rail spur to the landfill on company roads rather than using county roads. The property is an abandoned Barite strip mine with diminished land value, and may eventually be permitted as a landfill. It constitutes an additional buffer for the landfill.
2.3.1 Rail Spur Purchase at D&L Landfill
An abandoned rail spur and receiving facility is situated a quarter of a mile from the Barton landfill. GER will purchase this property in order to accept waste from distant municipalities. Funds for this purchase and its renovation have been allocated.
Services
Martin Creek and Barton landfills are close, easy-access locations for St. Louis metropolitan area waste hauling firms to dispose of solid municipal waste. By sending GER road tractors to haul waste to its sites from more distant waste transfer stations, the tonnage starting with the first day of operations will be assured.
Receiving facilities are enclosed buildings into which all incoming waste is dumped. This waste will be hand sorted removing 99% of all recyclables, then compacted, baled, and moved to the landfill.
The bales will form “bale cells” which include conduits for landfill gas capture. Each cell will be sealed in order to create an anaerobic environment for optimum gas generation and vector control.
After constructing the recycling facility and obtaining a permit, used tires will be crumbled and used throughout the landfill instead of crushed rock (inside bale cells to protect gas conduits, on landfill roads, and in the drainage system). Currently used tires generate an income of $1.75 to $2.00 per tire. Approximately 30,000 to 43,000 tires can be used per acre of landfill. This eliminates the cost of rock and requires no additional space for disposal.
Each bale cell will be wrapped with 60 mil polyvinyl chloride (PVC) sheets and sealed on all sides to trap and collect methane gas generated. Landfill gas is 55% methane (CH4), 45% carbon dioxide (C02), with trace amounts of nitrogen (N). The gas is cleaned, dried, and separated with membranes and filters. The methane can be used as fuel for electrical generators on site, providing substantial electricity savings.
Sales of electricity into the electrical grid is an alternate source of income for GER. Although large electric generators represent a significant capital investment, there is ample return on investment to warrant such expenditure. This option has the potential of adding approximately $4,000,000+ annually to the gross income.
Another process requiring different equipment and a significant capital investment is reforming the methane into methanol and food-grade C02. This process requires filtering, scrubbing, and bottling C02 for use in food and carbonated drinks and methanol for use as fuel, solvents, and windshield washer fluid.
In bulk form, methanol sales can generate $0.48 per gallon. As a vehicle fuel, this product is called M-85 and contains a mixture of 85% methanol and 15% gasoline and is used in vehicles that have dual configured engines. As the price of gasoline skyrockets, this method has more potential for an excellent adjunct profit center. All major automobile manufacturers offer assembly-line automobiles capable of using both M-85 and regular gasoline products in the same vehicle.
3.1 Service Description
Landfill tipping (dumping) fees are $34.00/ton ($11.33/yd) in St. Louis and nearby municipalities. In nearby Washington County, GER will provide landfill dumping for $28.00/ton ($9.33/yd). Tipping fees in Bond County, Illinois, the location of Barton landfill, are considerably lower at $18.00/ton ($6.50/yd) since the owners have not raised rates in over six years. GER will address rate increases at Barton after acquiring the business.
3.2 Competitive Comparison
There are several types of competitors:
- Currently there are two landfills operating in St. Louis County, and two in Illinois across the Mississippi River twenty-five miles from downtown St. Louis. Waste trucks cross the river daily to the Illinois landfills. Round trip for a truck generally requires an hour and a half. At the landfills, roads are muddy in the fall, spring, and winter and dusty in the summer. Here is where the majority of waste truck breakdowns occur due to punctured tires, stalling, and mechanical problems. Both Martin Creek and Barton landfills will have paved dumping areas. Operation hours will be longer as well (6 AM to 8 PM daily and 6 AM to 2 PM on Saturdays). In the four hours after other landfills are closed, GER landfills will attract hauling firms whose trucks have been delayed during the day, or whose pickup routes are longer.
- A city-owned transfer station on the south side of St. Louis operated by USA Waste will continue to service the southern side of the city. The charge for outside waste companies to dump at this facility is $35.93/ton. The facility is managed by USA Waste under contract with the city of St. Louis. Collected waste is hauled to a landfill owned by USA Waste in Milan, Illinois. Fees for the two landfills in Illinois are $34.00 per ton. USA Waste inquired about diverting a portion of their waste stream to Barton. However, the owners of Barton declined as they did not desire to add additional employees that an increased waste stream would require.
3.3 Sales Literature
GER will prepare maps and information about Martin Creek and Barton for dissemination to users. Sales personnel will visit each nearby waste hauler with pricing, maps, and reminders of the facility. Especially noted will be hours of operation, free coffee and sodas for drivers, savings on driving distances, and all other benefits users can obtain when using GER’s facilities.
3.4 Technology
GER intends to lease the most modern equipment for its operation. This will include powerful balers, shredders, and conveyers. Much of this equipment has been used in the recycling industry over the past 10-20 years and has been modified to handle normal waste stream material.
Initially trucks, loaders, and tractors will be leased. In time, GER will purchase these vehicles. Should it opt to construct the methanol reformation facility, the vehicles GER purchases will have methanol fuel engines allowing the use of either methanol or conventional fuels.
New technology to assist in landfill gas generation continues to be developed. Cleaner gas, new processes, and techniques enhance GER’s capability of using landfill gas more effectively.
GER intends to install monitoring systems at the landfill to allow managers and officers to observe activity, verify trucks and loads by remote access and computers.
3.5 Future Services
After the landfill has been operating for at least six months, GER will commence collecting methane gas to power electrical generators. During the first six months, the primary effort will be spent stabilizing the basic operation and working out start-up problems. Subsequently, decisions regarding the final utilization of methane will be made.
Marketing programs will commence to bring in baled waste from cities such as Chicago, Boston, Cleveland, New York, Washington, Providence, Hartford, Newark, and Philadelphia, as well as other Missouri municipalities and markets, such as Fort Leonard Wood, a U.S. Army base approximately 85 miles from the landfill in Rolla, Missouri. All of these locations have increasing problems with burgeoning waste and fewer available landfills. Rail-hauling baled waste is expected to be a significant profit center for GER.
New York City’s residential waste fees are normally $140.00 per ton (currently being held at an artificially low price by city government), whereas St. Louis fees are $34.00 per ton. The rail access at both GER landfills allow importation of this high profit waste stream. Rail shipping costs are approximately $7.00 per ton, thus facilitating reasonable means to import this profitable source of income in a manner that does not attract attention by using surface roads.
Income from methane gas generation will be gravy for an already lucrative waste and recycling business. Nationwide electrical and gasoline shortages add an urgency to utilize this valuable byproduct. The American Methanol Institute has been helpful in providing information regarding methane reformation into methanol.
The cost of waste removal is expected to rise dramatically over the next decade. GER selected its landfill sites in rural locations, yet reasonably close to a major population center to capitalize on the growing need for landfills. Martin Creek and Barton are optimally situated to take advantage of the impending rising costs and landfill closure crisis.
GER intends to defuse any public concern by maintaining highly sanitary facilities that use ozone generators to eliminate odors, insects, and rodents. Baled waste does not cause the landfill to have the messy, littered appearance of traditional landfills. Baled waste is dense, and, with paper and other recyclables removed, there is minimal blowing waste to litter the area. The “active” area is covered by earth and Poly Vinyl Chloride (PVC) sheets, thus reducing odor, vectors, birds, and insects.
3.5.1 New York City Waste Stream
Every five days New York City’s garbage could fill Yankee Stadium. New York City has been wrestling with its garbage disposal for many years now. Its only landfill, Fresh Kills on Staten Island, recently closed. With this closure, its problem has reached crisis proportions. New York USA Waste personnel are scrambling to find a “home” for their never-ending waste. It is the intent of Good Earth Resources to import a portion of this lucrative waste stream. New York City residents and businesses are charged in excess of $1.5 billion per year to dispose of their garbage. New York City pays $46.00 cubic yard ($140.00/ton) to dispose its waste, while the rate in St. Louis is $11.33 cubic yard ($34.00/ton).
Currently most of the New York City waste stream is exported via truck and barge. Necessarily, the truck traffic passes through New Jersey and its residents, greatly dissatisfied with this traffic, continually seek means to stop it. Furthermore, destination states such as Virginia, Pennsylvania, and others also wish to limit waste truck traffic and waste importation. This presents an unusual opportunity for GER. By using rail-hauling and on-site rail spurs, there will be minimal awareness on imported waste. Income from 1,000 tons per day from New York City to each GER landfill will increase the return on investment significantly.
Market Analysis Summary
Barton landfill will be in a positive cash flow condition at close of escrow. During the first month of operations, GER road tractors will haul waste from transfer stations in the cities of St. Louis and St. Charles to the landfill at the rate of 690 tons per day. This will supplement the local waste stream of 250 tons per day to bring the total to over 940 tons per day. An additional 600 tons per day is available from sources near Martin Creek landfill and until Martin Creek construction is complete, GER intends to haul this waste to Barton as well.
With commitments from St. Louis waste collection firms and local hauling firms, GER expects to attain the break-even mark within the first 60 to 90 days after assuming ownership. Once this benchmark is passed, primary focus will be on generating more customers both in the local St. Louis, Washington, Jefferson, and St. Francis Counties.
Martin Creek landfill will require a period of seven to twelve months of construction to become operational. By that time, GER will be able to direct sufficient waste from St. Louis and other municipalities to Martin Creek to create a positive cash flow in the first month of operation.
4.1 Market Segmentation
GER personnel plan to contact waste generators, such as food processing plants, breweries (Anheuser Busch), pet food manufacturers (Purina Dog Chow), restaurants, and financial institutions. Marketing personnel will contact each waste hauler in this part of Missouri and Illinois, alerting them to GER locations, hours and rates.
4.1.1 Market Trends
The most important market trend, landfill closures, favors GER. There are fewer and fewer landfills, while more and more families are moving to suburban locations, discouraging new landfills from opening and expediting the closure of those currently in use. The “nimby” (not in my back yard) cry prevents new landfills from being permitted or significantly slowing the process. State governments refuse to override citizens who adamantly fight landfill construction near their homes even at the prospect of even higher waste collection charges. Neither Martin Creek nor Barton landfills have to experience a public hearing phase. Public opposition to landfills and transfer stations serves to push waste disposal costs higher with transportation to more distant landfills.
Of the companies focused on the profitable business of waste removal, only a minor number have developed an efficient method to remove the gas generated from buried waste. Ninety-eight percent of landfills use earth as a cover (“cut and fill”) rather than PVC covering. This reduces gas purity and volume. Older waste burial practices cause gas retrieval to be difficult and expensive, while the bale cell system GER intends to use will capture the majority of the gas. Sealed cells reduce leachate leakage and water table contamination. Gas production will provide revenues for many years to come.
The U.S. Environmental Protection Agency’s Office of Solid Waste identifies by name and location Non-Hazardous Waste landfills throughout the United States and U.S. territories every several years. 1986 was the first year this census was taken and there were 7,683 landfills identified. In 1992 the document was updated and showed a decline to 5,345 landfills. In 1995, the document was updated once again and showed a further decline in landfills to 3,581. (Source U.S. Environmental Protection Agency website http://www.epa.gov/epaoswer/non-hw/muncpl/landfilVtflist). This report substantiates the increasing value of a landfill permit and the increasing difficulty to obtain a permit to dispose of municipal waste. The trend is obviously favorable for owners of landfills that are available to accept waste. It will not be many years before rates increase substantially and even local waste fees will skyrocket.
4.1.2 Value Enhancing Factors
As mentioned, landfills are becoming more and more scarce, especially on the eastern seaboard. Those possessing permitted landfills own virtual gold mines as values continue to rise. Martin Creek landfill has 284 acres with 42 acres currently permitted by the Missouri Department of Natural Resources. Barton Sanitary landfill has 300 acres and a permitted area of 65 acres and is permitted by the State of Illinois Environmental Protection Agency.
Martin Creek will treble in valuation when construction is complete. A typical landfill with final permits ready for operation carries a price tag from $6-7 million, and, in some cases, more.
Over the past decade, recycling has reached every household in the United States. Many municipalities have mandatory recycling laws. It makes economic sense for people to remove recyclables from the waste stream. This is a practice that can help preserve the earth’s resources. Even when citizens remove the majority of recyclables, an operation such as is proposed in this plan will remove an additional 25% of the volume in white paper, cardboard, glass, plastic, ferrous, and aluminum. GER is performing the ultimate “recycling” by enclosing the baled waste and capturing the gas to be used for productive, profitable means. By using this often-wasted energy, our national dependency on fossil fuels may diminish, albeit slightly. Each bale cell generates methane for years after closure.
Several factors, then, accrue to the benefit of GER. Owning landfills with rail access in the heartland of the USA, landfill closures, population growth, rising waste removal costs, technology advances, and continued fossil fuel dependency adds up to excellent market growth and exemplary value in return for each invested dollar and hour of effort. Landfill gas capture will provide income long after the waste operation ceases.
4.2 Target Market Segment Strategy
There are two large national players operating in practically every major city in the United States, Associated Waste and USA Waste Technologies. Both are NYSE listed and both exceed $1 billion per year in revenues. Their operations include collecting waste, both business and residential, operating transfer stations and landfills.
GER intends to work with both USA Waste and Associated Waste. It may appear that GER will be in competition with these companies, however, in the St. Louis area, the landfills owned by USA Waste are in Illinois, some 30 miles (60 miles round trip) and 40 miles (80 miles round trip) from the city. Associated Waste manages a landfill in St. Louis owned by the Catholic Church due to close in less than eighteen months. Associated also owns a landfill in Roxana, Illinois somewhat more distant than the USA Waste landfills.
USA Waste has offered to provide GER with nearly 700 tons/day of waste in the vicinity of Martin Creek. It has also inquired about purchasing Martin Creek landfill at a future date. As mentioned previously, USA Waste approached the present owners of Barton to accept overflow waste as it attempts to reduce the waste flow to its Milan, Illinois landfill.
GER has contacted local hauling companies for some or all of their business. For these companies, a favorable location with more favorable hours of operation will be of benefit to the owners who realize a closer landfill and longer hours will help increase their profitability.
Currently there is a proposal for several small municipalities in Eastern Missouri to join in an effort to develop a landfill property to meet their collective needs for the next twenty five years. With a projected cost of $37,250,000 there is staunch opposition to the project. The fact that local government would consider such a high cost project underscores the value of Martin Creek and Barton.
4.2.1 Market Trends
Landfills or transfer stations are selected, if dumping fees are the same, solely due to the proximity of the waste hauler’s route to their facility. Most likely, Martin Creek or Barton will not capture the business from hauling firms whose facilities are more than 100 miles distant, unless they need to dump their load after the closing hours of the other facilities. On the other hand, the hauling firms whose routes are close to the landfill will find these locations a boon to their business.
Both Martin Creek and Barton will accept waste on Saturdays. Small trucks and local residents will utilize the facility during this time. Rates for this type of waste are generally higher than for commercial waste hauling firms.
| Market Analysis | |||||||
| Year 1 | Year 2 | Year 3 | Year 4 | Year 5 | |||
| Potential Customers | Growth | CAGR | |||||
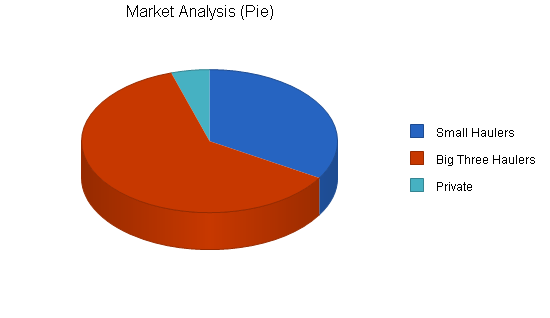
| Small Haulers | 15% | 700 | 805 | 926 | 1,065 | 1,225 | 15.02% |
| Big Three Haulers | 10% | 1,280 | 1,408 | 1,549 | 1,704 | 1,874 | 10.00% |
| Private | 25% | 100 | 125 | 156 | 195 | 244 | 24.98% |
| Total | 12.59% | 2,080 | 2,338 | 2,631 | 2,964 | 3,343 | 12.59% |
4.2.2 Market Growth
As mentioned in preceding sections, Associated Waste and USA Waste Technologies are the two major firms in the waste business nationwide. Both are NYSE listed. Their operations include collecting residential and commercial waste, operating transfer stations, and operating landfills.
Total daily waste collected in the metropolitan St. Louis area, that includes St. Louis city and County, St. Charles County, and Jefferson County, is estimated at between 12,000 and 16,000 yards per day. GER can immediately take 10% of this waste stream daily without competitive concern. In time GER expects to obtain a greater percentage of this waste stream.
Local counties include: Washington; St. Francois; Jefferson; St. Genevieve; Iron; and Madison. Each of these counties has waste collection services.
Washington County trucks drive a round trip distance of 104 miles to a transfer station in St. Genevieve City, St.Genevieve county, Missouri where it is then trucked to DeSoto, Illinois, a round trip distance of 146 miles.
St. Francois trucks drive a round trip distance of 92 miles to a transfer station in St. Genevieve city, St. Genevieve County, Missouri where it is then trucked to DeSoto, Illinois. St. Genevieve trucks drive to a nearby transfer station in St. Genevieve city St. Genevieve County, Missouri where it is then trucked to DeSoto, Illinois.
Jefferson County trucks drive to a transfer station in Barnhart, Jefferson County, where it is trucked to Weber Landfill in St. Louis, a round trip of 70 miles or across the Mississippi to East St. Louis, Illinois, a round trip of 90 miles.
Iron County waste trucks pickup waste and drive to Fredericktown Transfer Station, a round trip of 56 miles, where it is trucked to Butler County Landfill, Poplar Bluff, Missouri, a round trip of 80 miles.
Madison trucks pickup waste and drive to Fredericktown, Madison County Transfer Station where it is trucked to Butler County Landfill, Poplar Bluff, Missouri.
The distance Washington County trucks would travel to Martin Creek is 18 miles round trip vs. 104 miles. The distance St. Francois County trucks would travel to Martin Creek is 36 miles round trip vs. 92 miles. The distance St. Genevieve County trucks would travel to Martin Creek is 72 miles round trip vs. 144 miles. The distance Jefferson County trucks would travel to Martin Creek is 22 to 75 miles round trip vs. 90 miles. The distance Iron County trucks would travel to Martin Creek is 44 miles round trip vs. 56 miles. The distance Madison County trucks would travel to Martin Creek is 68 miles round trip vs. 80 miles.
In every case these county trucks would save time and mileage by using Martin Creek. This translates into money saved for the each county or hauling company. At present there are no long-term contracts that would prevent a change to Martin Creek.
These counties produce the following amounts of waste daily:
- Washington: 80-120 yards.
- St. Francois: 250-300 yards.
- Jefferson: 2,000 yards.
- St. Genevieve:250 yards.
- Iron: 60 yards.
- Madison: 60-80 yards.
- Total: 2,700 to 2,800 yards per day from local counties.
Sales Forecast
The following table and chart outline our proposed sales, which is divided between the estimated sales generated by each of the two landfills.
| Sales Forecast | |||
| Year 1 | Year 2 | Year 3 | |
| Unit Sales | |||
| 690 tons/day x 26 days | 215,280 | 241,750 | 267,350 |
| 250 tons/day x 22 days | 66,000 | 66,000 | 66,000 |
| Other | 0 | 0 | 0 |
| Total Unit Sales | 281,280 | 307,750 | 333,350 |
| Unit Prices | Year 1 | Year 2 | Year 3 |
| 690 tons/day x 26 days | $24.00 | $24.00 | $24.00 |
| 250 tons/day x 22 days | $18.00 | $18.00 | $18.00 |
| Other | $0.00 | $0.00 | $0.00 |
| Sales | |||
| 690 tons/day x 26 days | $5,166,720 | $5,802,000 | $6,416,400 |
| 250 tons/day x 22 days | $1,188,000 | $1,188,000 | $1,188,000 |
| Other | $0 | $0 | $0 |
| Total Sales | $6,354,720 | $6,990,000 | $7,604,400 |
| Direct Unit Costs | Year 1 | Year 2 | Year 3 |
| 690 tons/day x 26 days | $0.30 | $0.12 | $0.12 |
| 250 tons/day x 22 days | $0.32 | $0.15 | $0.15 |
| Other | $0.00 | $0.00 | $0.00 |
| Direct Cost of Sales | |||
| 690 tons/day x 26 days | $63,722 | $28,171 | $31,154 |
| 250 tons/day x 22 days | $21,300 | $9,600 | $9,600 |
| Other | $0 | $0 | $0 |
| Subtotal Direct Cost of Sales | $85,022 | $37,771 | $40,754 |
Management Summary
The initial management team depends on the founders themselves, and a small cadre of professionals. As GER grows, it will add additional consulting help, engineering, sales, and marketing.
6.1 Organizational Structure
GER has two founding principals whose duties will be divided between operations and administrative/sales. Once operations commence, GER will hire supervisors trained to assume responsibility for operations while the principals oversee the business.
One of the principals, Don Smith, has two adult sons who currently work with him at Smith Environmental Services. Both will take the Missouri and Illinois courses offered by each state’s landfill regulatory division for landfill supervisors and will assume supervisorial positions at the landfills.
6.2 Management Team
Co-founder Don Smith currently owns and operates Smith Environmental Services, one of the largest subsurface soil remediating businesses in Missouri with contracts throughout the state. In 1983 Smith built a transfer station in Wellston, Missouri, a St. Louis suburb that accepted waste, removed recyclables, baled and hauled it to the same landfill in Washington County that GER has under contract, Martin Creek. At that time, he obtained the landfill-operating permit from the Missouri Department of Natural Resources and commenced operation. The facility was fully operational 16 years ago. After a partnership dissolution and the subsequent closure of Martin Creek, Smith became manager of three landfills in Chicago, Illinois for Land and Lakes, Inc. Prior to his departure, however, the business was fully operational and generating a reasonable cash flow.
Smith has a full operating familiarity with all of the equipment to be used in GER operations. He has worked with the companies who manufacture various components and suggested numerous design changes in their equipment, many of which continue to be in use to this day.
After his departure from the original Martin Creek operation, Smith took a position with Land and Lakes, Inc of Chicago and eventually supervised the operation of three Chicago landfills for the company. All three of these landfills were in permit violation by the Illinois State Department of Natural Resources prior to Smith’s involvement. Within months under his supervision, all permit violations were cleared. Additionally, he stopped the landfills pollution of the Little Calumet River. This river is no longer polluted and is safe for fishing and boating. Later he worked for D & D Disposal to operate their Gary, Indiana landfill. During these periods he became familiar with all forms of disposal, tire shredding, hauling, and landfill problems.
Between 1990 and 1994 Smith operated a hazardous waste treatment, storage, & disposal facility (TSD) for Industrial Fuels & Resources, Inc. Through his stewardship in this venture, the business went from a $600,000 annual loss prior to his joining the company to an $800,000 net profit on gross sales of $6,000,000+ in the first year, and growing from 33 employees to 130 employees. The business was sold in 1994 to Environmental Services of America, Inc. (Missouri Division). Smith continued to operate the facility through 1995.
After leaving he founded Smith Environmental Services that he currently owns and operates. Smith Environmental has remediated several hundred sub-surface tank sites and hazardous waste spills throughout Missouri, both private and municipal owned.
Co-founder John App met Smith in 1984 and has maintained a business relationship since that time. App owned several mobile home parks, one in House Springs, Missouri. Others were in Tucson, Arizona (four), and Las Vegas, Nevada. App also owned and operated Corporate Pension Funding, Inc. a licensed California Mortgage Brokerage firm. This business operated during the late 1970’s and early 1980’s and funded many mortgages with millions of dollars in private pension money.
Recently App was International Marketing Manager for a computer Compact Disk (CD) Duplicating Tower manufacturing firm based in Rome, Italy. App has a sales and management background both in business and the military, where he was an officer and Marine Aviator for the U.S. Marine Corps and served as helicopter pilot and maintenance test pilot in Vietnam. He was extensively trained in maintenance procedures and is an asset to GER with his extensive engineering and marketing experience. He was educated at Brown University, Providence, Rhode Island.
App will operate the sales and marketing team for GER as well as perform management duties as administrative principal.
G. Calvin Rathbone serves as Corporate Counsel and is a member of the California State Bar. He has specialized in civil litigation, including commercial, products liability, toxic litigation, and environmental issues. Rathbone served in the U.S. Marine Corps as a Marine Aviator and Marine Air Group Operations officer in the Republic of Vietnam. Prior to entering law, he was a professional airline pilot with a major airline and manager of sales and marketing for a manufacturer of severe service control valves for use in the exploration and production of oil and gas. He is a graduate of Carnegie Mellon University and Western State University College of Law. Rathbone will assist in the New York City marketing effort where he has numerous business and personal contacts.
Curtis E. Smith will be one of the landfill supervisors and has 23 years experience in all aspects of landfill operations. He worked for Resource Recycling 1984-1985 and assisted his father, Don Smith, constructing the facility, installing equipment, and starting the recycling center in Wellston, Missouri. He managed the second shift during that period. He is a certified Harris Press baler operator (the compactor/baler GER intends to install at each location). Between 1989 and 1994, he was supervisor of operations at D&D Disposal, Chicago, IL where he managed 45 laborers performing recycling and waste baling.<CURRENTLY,&NBSP;SMITH a for FONT Missouri.
6.3 Management Team Gaps
One of the first positions filled will be for a qualified bookkeeper and financial manager for in-house fiscal and payroll management. This individual will continually advise the principals of accounts payable and receivable, as well as payroll matters. GER will seek out competent management as the operation becomes more mature to allow the principals the opportunity to seek out and develop new sites for expansion. GER intends to employ permanent sales personnel to maintain contact with major cities’ waste commissions.
6.4 Personnel Plan
The following table summarizes GER’s personnel expenditures for the first three years at Barton Landfill. There are also truckers and the employees at Martin Creek constructing that property.
| Personnel Plan | |||
| Year 1 | Year 2 | Year 3 | |
| Office Clerks (2) @$76.00/Day | $47,424 | $49,972 | $52,470 |
| Operators (6) @ $100/day | $187,200 | $196,560 | $206,388 |
| Laborers (1) @ $80/day | $24,960 | $26,208 | $27,518 |
| Maintenance Mechanic (1) @ $100/day | $31,200 | $32,670 | $34,398 |
| Supervisors (3) @ $140/day | $131,040 | $137,592 | $144,471 |
| Managers (2) @ $5000/month | $120,000 | $126,000 | $132,300 |
| Total People | 15 | 15 | 15 |
| Total Payroll | $541,824 | $569,002 | $597,545 |
Strategy and Implementation Summary
After opening and stabilizing operations, management will establish contact with the New York City Residential Waste Department and NYC Trade Waste Association. Contact will also be established with officials and corporations in Chicago, Philadelphia, Washington DC, Cleveland, and other cities on the Eastern Seaboard.
Fort Leonard Wood, the U.S. Army base at Rolla, Missouri approximately 85 miles from Martin Creek generates approximately 275 tons of waste per day. This is a local opportunity that is up for bid every few years.
Recycling, in order to maximize profits, require holding materials until spot prices reach profitable levels. Following are typical spot price variations for recyclables. GER will construct warehouses to hold materials in anticipation of the highest spot prices.
Glass recycling redemption varies between $14 and $39/ton.
Ferris metal redemption value fluctuates widely between $30/ton to as much as $120/ton. Currently it is $78/ton.
Non-ferrous metal (aluminum) is $54/ton. Corrugated redemption value is $107/ton. Newsprint is between $68 to $100/ton. Non-segregated, shredded and baled plastic is $9/ton. Pure white (no printing) paper is a premium at $229/ton.
7.1 Competitive Edge
GER intends to offer clean facilities with easily accessible paved roads as opposed to dusty or muddy, foul-smelling landfills. GER will maintain the same price structure as competing landfills, but with longer hours of operation. The savings to the waste collection companies will be driving time, fuel, wear and tear on the vehicle, and longer hours of operation.
7.2 Milestones
The accompanying table lists important program milestones, with dates and managers in charge, and budgets for each. The milestone schedule indicates GER’s emphasis on planning for implementation.
What the table doesn’t show is the commitment behind it. The GER business plan includes complete provisions for plan-vs.-actual analysis, and it will hold monthly follow-up meetings every month to discuss the variance and course corrections.
| Milestones | |||||
| Milestone | Start Date | End Date | Budget | Manager | Department |
| Complete Incorporation | 4/2/1999 | 4/2/1999 | $500 | John O’Neal | Administrative |
| Offer on Landfill | 6/15/2000 | 7/31/2001 | $5,000 | John O’Neal | Administrative |
| Start Landfill Permit Process | 8/1/2001 | 8/1/2003 | $300,000 | John/Don | Administrative |
| Business Plan | 5/1/2001 | 5/15/2001 | $5,000 | John O’Neal | Administrative |
| Seismic Testing | 6/30/2000 | 8/1/2001 | $20,000 | Don Smith | Operations |
| Totals | $330,500 | ||||
7.3 Marketing Strategy
Good Earth Resources personnel will call on hauling firms to advise them of GER’s facility, and provide maps to the site, hours, and pricing.
GER will offer similar tipping fees charged by other landfills, yet emphasize time and fuel savings, wear and tear savings, and longer operating hours to all users. GER will consider contractual incentives in certain instances and circumstances to increase profitability. Hauling waste with GER road tractors should provide financial incentive to St. Louis waste collection firms. This is a simple, intuitive solution, not employed by other landfills.
GER will attempt to secure tonnage from eastern seaboard and Midwestern cities. GER will offer price incentives in order to win long-term contracts with many of these municipalities. Both Martin Creek and Barton will each be able to handle in excess of 1,000 tons per day hauled into the respective rail spurs.
Financial Plan
The purchase of Barton landfill at the onset is essential. Since Barton is currently operating, it allows GER the opportunity to augment the current waste stream by hauling from St. Louis and St. Charles, Missouri. The present owners of Barton have been ready to retire for several years and have lost interest in increasing this business. This affords GER the opportunity to build both businesses using Barton’s cash flow and customer base. GER can solicit additional business in anticipation of Martin Creek’s opening day. Prior to opening, waste would be transported to Barton. Thus, at Martin Creek’s opening, there will be excellent revenue sources on the first day of business.
8.1 Important Assumptions
The financial plan depends on important assumptions, most of which are shown in the tables. GER expects a 30 to 45 day lag between services rendered and payment receipt because of the nature of the business. Interest rates, tax rates, and personnel burden are based on conservative assumptions.
Some of the more important underlying assumptions are:
- GER assumes to be able to obtain the final Missouri Department of Natural Resources permit for operation of the landfill.
- GER assumes, of course, that there are no unforeseen changes in technology to make landfills obsolete.
- A recessionary economy would not have an major negative effect on the cash flow, however there may be adjustments in both income and expenses should the recession be extensive and long-term. Even during a recession municipalities generate trash and it must be removed to a landfill. This is a recession-proof business that flourishes in good times and bad.
| General Assumptions | |||
| Year 1 | Year 2 | Year 3 | |
| Plan Month | 1 | 2 | 3 |
| Current Interest Rate | 8.00% | 8.00% | 8.00% |
| Long-term Interest Rate | 8.00% | 8.00% | 8.00% |
| Tax Rate | 2.50% | 0.00% | 2.50% |
| Other | 0 | 0 | 0 |
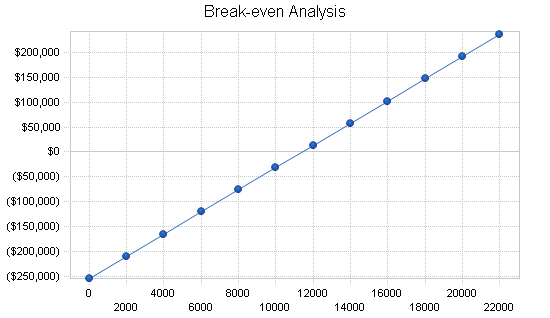
8.2 Break-even Analysis
This chart and table summarize the break-even analysis. GER expects to break even shortly after commencing operations as a result of GER personnel going to the hauler’s transfer stations and using GER road tractors and divert the waste stream. Each trailer holds 80 yards. The monthly units refers to the number of trailer loads with approximately 27 tons (80 yards). Total truckloads for 690 tons daily is 673 loads per month, six days per week easily provided by seven road tractors.
| Break-even Analysis | |
| Monthly Units Break-even | 11,417 |
| Monthly Revenue Break-even | $257,928 |
| Assumptions: | |
| Average Per-Unit Revenue | $22.59 |
| Average Per-Unit Variable Cost | $0.30 |
| Estimated Monthly Fixed Cost | $254,477 |
8.3 Projected Profit and Loss
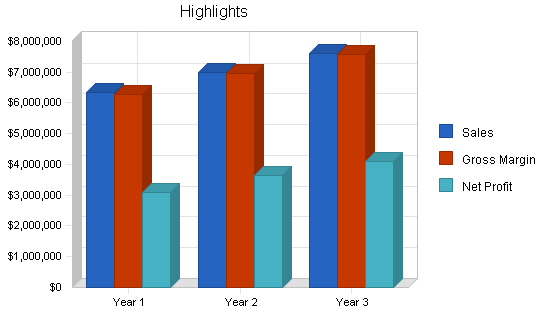
GER projected profit and loss is shown on the following table, with sales at $6,354,720 the first year and increasing each year thereafter. Due to expenditures in the first year, initial profits are lower in comparison to the second year. Once Martin Creek landfill is fully constructed, profits rise dramatically. This chart reflects 940 tons per day to Barton. GER has verbal commitments to bring in this amount starting with the first day of ownership. The Martin Creek Profit & Loss Statement in the Appendix shows 600 tons per day diverted to Barton in the first year and in the 13th month delivered to Martin Creek. By hauling to Barton during Martin Creek’s construction phase, GER will both increase profits and secure this business for Martin Creek at the time it is ready to accept its own waste stream. The additional 600 tons per day provides an additional sales potential of between $4,492,800 on the low side and $5,241,600 on the high side, depending on the length of contract with this transfer station agreed upon.
| Pro Forma Profit and Loss | |||
| Year 1 | Year 2 | Year 3 | |
| Sales | $6,354,720 | $6,990,000 | $7,604,400 |
| Direct Cost of Sales | $85,022 | $37,771 | $40,754 |
| Geothermal Mat | $0 | $0 | $0 |
| Total Cost of Sales | $85,022 | $37,771 | $40,754 |
| Gross Margin | $6,269,698 | $6,952,229 | $7,563,646 |
| Gross Margin % | 98.66% | 99.46% | 99.46% |
| Expenses | |||
| Payroll | $541,824 | $569,002 | $597,545 |
| Sales and Marketing and Other Expenses | $1,901,908 | $2,019,908 | $2,029,908 |
| Depreciation | $0 | $0 | $0 |
| Truck Rental | $280,800 | $280,800 | $280,800 |
| Utilities | $14,400 | $14,400 | $14,400 |
| Insurance | $64,392 | $64,392 | $64,392 |
| Telephone | $12,000 | $12,000 | $12,000 |
| Payroll Taxes | $238,403 | $250,361 | $262,920 |
| Other | $0 | $0 | $0 |
| Total Operating Expenses | $3,053,727 | $3,210,863 | $3,261,965 |
| Profit Before Interest and Taxes | $3,215,971 | $3,741,366 | $4,301,681 |
| EBITDA | $3,215,971 | $3,741,366 | $4,301,681 |
| Interest Expense | $43,287 | $89,530 | $101,582 |
| Taxes Incurred | $67,731 | $0 | $105,002 |
| Net Profit | $3,104,953 | $3,651,836 | $4,095,097 |
| Net Profit/Sales | 48.86% | 52.24% | 53.85% |
8.4 Projected Cash Flow
Cash flow projections are shown in the table below.
| Pro Forma Cash Flow | |||
| Year 1 | Year 2 | Year 3 | |
| Cash Received | |||
| Cash from Operations | |||
| Cash Sales | $1,588,680 | $1,747,500 | $1,901,100 |
| Cash from Receivables | $3,984,939 | $5,164,414 | $5,627,780 |
| Subtotal Cash from Operations | $5,573,619 | $6,911,914 | $7,528,880 |
| Additional Cash Received | |||
| Sales Tax, VAT, HST/GST Received | $0 | $0 | $0 |
| New Current Borrowing | $596,090 | $0 | $0 |
| New Other Liabilities (interest-free) | $0 | $0 | $0 |
| New Long-term Liabilities | $448,692 | $448,692 | $448,692 |
| Sales of Other Current Assets | $0 | $0 | $0 |
| Sales of Long-term Assets | $0 | $0 | $0 |
| New Investment Received | $7,548,000 | $0 | $0 |
| Subtotal Cash Received | $14,166,401 | $7,360,606 | $7,977,572 |
| Expenditures | Year 1 | Year 2 | Year 3 |
| Expenditures from Operations | |||
| Cash Spending | $541,824 | $569,002 | $597,545 |
| Bill Payments | $2,486,914 | $2,762,588 | $2,900,038 |
| Subtotal Spent on Operations | $3,028,738 | $3,331,590 | $3,497,583 |
| Additional Cash Spent | |||
| Sales Tax, VAT, HST/GST Paid Out | $0 | $0 | $0 |
| Principal Repayment of Current Borrowing | $3,500,000 | $300,000 | $296,090 |
| Other Liabilities Principal Repayment | $0 | $0 | $0 |
| Long-term Liabilities Principal Repayment | $0 | $0 | $0 |
| Purchase Other Current Assets | $0 | $0 | $0 |
| Purchase Long-term Assets | $5,002,281 | $0 | $0 |
| Dividends | $0 | $0 | $0 |
| Subtotal Cash Spent | $11,531,019 | $3,631,590 | $3,793,673 |
| Net Cash Flow | $2,635,382 | $3,729,015 | $4,183,899 |
| Cash Balance | $2,764,710 | $6,493,725 | $10,677,624 |
8.5 Projected Balance Sheet
The following table shows the projected balance sheet for Good Earth Resources.
| Pro Forma Balance Sheet | |||
| Year 1 | Year 2 | Year 3 | |
| Assets | |||
| Current Assets | |||
| Cash | $2,764,710 | $6,493,725 | $10,677,624 |
| Accounts Receivable | $781,101 | $859,188 | $934,708 |
| Other Current Assets | $350,000 | $350,000 | $350,000 |
| Total Current Assets | $3,895,811 | $7,702,912 | $11,962,331 |
| Long-term Assets | |||
| Long-term Assets | $12,002,281 | $12,002,281 | $12,002,281 |
| Accumulated Depreciation | $0 | $0 | $0 |
| Total Long-term Assets | $12,002,281 | $12,002,281 | $12,002,281 |
| Total Assets | $15,898,092 | $19,705,193 | $23,964,612 |
| Liabilities and Capital | Year 1 | Year 2 | Year 3 |
| Current Liabilities | |||
| Accounts Payable | $221,029 | $227,602 | $239,323 |
| Current Borrowing | $596,090 | $296,090 | $0 |
| Other Current Liabilities | $0 | $0 | $0 |
| Subtotal Current Liabilities | $817,119 | $523,692 | $239,323 |
| Long-term Liabilities | $448,692 | $897,384 | $1,346,076 |
| Total Liabilities | $1,265,811 | $1,421,076 | $1,585,399 |
| Paid-in Capital | $11,548,000 | $11,548,000 | $11,548,000 |
| Retained Earnings | ($20,672) | $3,084,281 | $6,736,117 |
| Earnings | $3,104,953 | $3,651,836 | $4,095,097 |
| Total Capital | $14,632,281 | $18,284,117 | $22,379,214 |
| Total Liabilities and Capital | $15,898,092 | $19,705,193 | $23,964,612 |
| Net Worth | $14,632,281 | $18,284,117 | $22,379,214 |
8.6 Business Ratios
The following table compares the estimated ratios to the Standard Industry Code #4953, Solid Waste Landfill.
| Ratio Analysis | ||||
| Year 1 | Year 2 | Year 3 | Industry Profile | |
| Sales Growth | 0.00% | 10.00% | 8.79% | 7.24% |
| Percent of Total Assets | ||||
| Accounts Receivable | 4.91% | 4.36% | 3.90% | 7.22% |
| Other Current Assets | 2.20% | 1.78% | 1.46% | 25.93% |
| Total Current Assets | 24.50% | 39.09% | 49.92% | 33.95% |
| Long-term Assets | 75.50% | 60.91% | 50.08% | 66.05% |
| Total Assets | 100.00% | 100.00% | 100.00% | 100.00% |
| Current Liabilities | 5.14% | 2.66% | 1.00% | 17.37% |
| Long-term Liabilities | 2.82% | 4.55% | 5.62% | 23.19% |
| Total Liabilities | 7.96% | 7.21% | 6.62% | 40.56% |
| Net Worth | 92.04% | 92.79% | 93.38% | 59.44% |
| Percent of Sales | ||||
| Sales | 100.00% | 100.00% | 100.00% | 100.00% |
| Gross Margin | 98.66% | 99.46% | 99.46% | 31.67% |
| Selling, General & Administrative Expenses | 48.74% | 47.76% | 45.73% | 14.70% |
| Advertising Expenses | 2.05% | 2.00% | 1.97% | 0.29% |
| Profit Before Interest and Taxes | 50.61% | 53.52% | 56.57% | 2.51% |
| Main Ratios | ||||
| Current | 4.77 | 14.71 | 49.98 | 1.24 |
| Quick | 4.77 | 14.71 | 49.98 | 0.84 |
| Total Debt to Total Assets | 7.96% | 7.21% | 6.62% | 62.44% |
| Pre-tax Return on Net Worth | 21.68% | 19.97% | 18.77% | 2.35% |
| Pre-tax Return on Assets | 19.96% | 18.53% | 17.53% | 6.25% |
| Additional Ratios | Year 1 | Year 2 | Year 3 | |
| Net Profit Margin | 48.86% | 52.24% | 53.85% | n.a |
| Return on Equity | 21.22% | 19.97% | 18.30% | n.a |
| Activity Ratios | ||||
| Accounts Receivable Turnover | 6.10 | 6.10 | 6.10 | n.a |
| Collection Days | 57 | 57 | 57 | n.a |
| Accounts Payable Turnover | 12.25 | 12.17 | 12.17 | n.a |
| Payment Days | 27 | 30 | 29 | n.a |
| Total Asset Turnover | 0.40 | 0.35 | 0.32 | n.a |
| Debt Ratios | ||||
| Debt to Net Worth | 0.09 | 0.08 | 0.07 | n.a |
| Current Liab. to Liab. | 0.65 | 0.37 | 0.15 | n.a |
| Liquidity Ratios | ||||
| Net Working Capital | $3,078,692 | $7,179,220 | $11,723,009 | n.a |
| Interest Coverage | 74.29 | 41.79 | 42.35 | n.a |
| Additional Ratios | ||||
| Assets to Sales | 2.50 | 2.82 | 3.15 | n.a |
| Current Debt/Total Assets | 5% | 3% | 1% | n.a |
| Acid Test | 3.81 | 13.07 | 46.08 | n.a |
| Sales/Net Worth | 0.43 | 0.38 | 0.34 | n.a |
| Dividend Payout | 0.00 | 0.00 | 0.00 | n.a |
Appendix
| Sales Forecast | |||||||||||||
| Month 1 | Month 2 | Month 3 | Month 4 | Month 5 | Month 6 | Month 7 | Month 8 | Month 9 | Month 10 | Month 11 | Month 12 | ||
| Unit Sales | |||||||||||||
| 690 tons/day x 26 days | 0% | 17,940 | 17,940 | 17,940 | 17,940 | 17,940 | 17,940 | 17,940 | 17,940 | 17,940 | 17,940 | 17,940 | 17,940 |
| 250 tons/day x 22 days | 0% | 5,500 | 5,500 | 5,500 | 5,500 | 5,500 | 5,500 | 5,500 | 5,500 | 5,500 | 5,500 | 5,500 | 5,500 |
| Other | 0% | 0 | 0 | 0 | 0 | 0 | 0 | 0 | 0 | 0 | 0 | 0 | 0 |
| Total Unit Sales | 23,440 | 23,440 | 23,440 | 23,440 | 23,440 | 23,440 | 23,440 | 23,440 | 23,440 | 23,440 | 23,440 | 23,440 | |
| Unit Prices | Month 1 | Month 2 | Month 3 | Month 4 | Month 5 | Month 6 | Month 7 | Month 8 | Month 9 | Month 10 | Month 11 | Month 12 | |
| 690 tons/day x 26 days | $24.00 | $24.00 | $24.00 | $24.00 | $24.00 | $24.00 | $24.00 | $24.00 | $24.00 | $24.00 | $24.00 | $24.00 | |
| 250 tons/day x 22 days | $18.00 | $18.00 | $18.00 | $18.00 | $18.00 | $18.00 | $18.00 | $18.00 | $18.00 | $18.00 | $18.00 | $18.00 | |
| Other | $0.00 | $0.00 | $0.00 | $0.00 | $0.00 | $0.00 | $0.00 | $0.00 | $0.00 | $0.00 | $0.00 | $0.00 | |
| Sales | |||||||||||||
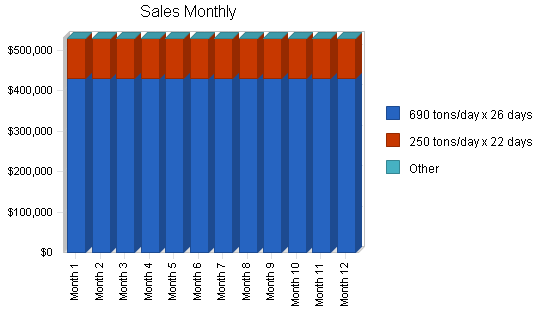
| 690 tons/day x 26 days | $430,560 | $430,560 | $430,560 | $430,560 | $430,560 | $430,560 | $430,560 | $430,560 | $430,560 | $430,560 | $430,560 | $430,560 | |
| 250 tons/day x 22 days | $99,000 | $99,000 | $99,000 | $99,000 | $99,000 | $99,000 | $99,000 | $99,000 | $99,000 | $99,000 | $99,000 | $99,000 | |
| Other | $0 | $0 | $0 | $0 | $0 | $0 | $0 | $0 | $0 | $0 | $0 | $0 | |
| Total Sales | $529,560 | $529,560 | $529,560 | $529,560 | $529,560 | $529,560 | $529,560 | $529,560 | $529,560 | $529,560 | $529,560 | $529,560 | |
| Direct Unit Costs | Month 1 | Month 2 | Month 3 | Month 4 | Month 5 | Month 6 | Month 7 | Month 8 | Month 9 | Month 10 | Month 11 | Month 12 | |
| 690 tons/day x 26 days | 0.00% | $2.08 | $0.13 | $0.13 | $0.13 | $0.13 | $0.13 | $0.13 | $0.13 | $0.13 | $0.13 | $0.13 | $0.13 |
| 250 tons/day x 22 days | 0.00% | $2.27 | $0.15 | $0.15 | $0.15 | $0.15 | $0.15 | $0.15 | $0.15 | $0.15 | $0.15 | $0.15 | $0.15 |
| Other | 0.00% | $0.00 | $0.00 | $0.00 | $0.00 | $0.00 | $0.00 | $0.00 | $0.00 | $0.00 | $0.00 | $0.00 | $0.00 |
| Direct Cost of Sales | |||||||||||||
| 690 tons/day x 26 days | $37,396 | $2,393 | $2,393 | $2,393 | $2,393 | $2,393 | $2,393 | $2,393 | $2,393 | $2,393 | $2,393 | $2,393 | |
| 250 tons/day x 22 days | $12,500 | $800 | $800 | $800 | $800 | $800 | $800 | $800 | $800 | $800 | $800 | $800 | |
| Other | $0 | $0 | $0 | $0 | $0 | $0 | $0 | $0 | $0 | $0 | $0 | $0 | |
| Subtotal Direct Cost of Sales | $49,896 | $3,193 | $3,193 | $3,193 | $3,193 | $3,193 | $3,193 | $3,193 | $3,193 | $3,193 | $3,193 | $3,193 | |
| Personnel Plan | |||||||||||||
| Month 1 | Month 2 | Month 3 | Month 4 | Month 5 | Month 6 | Month 7 | Month 8 | Month 9 | Month 10 | Month 11 | Month 12 | ||
| Office Clerks (2) @$76.00/Day | 0% | $3,952 | $3,952 | $3,952 | $3,952 | $3,952 | $3,952 | $3,952 | $3,952 | $3,952 | $3,952 | $3,952 | $3,952 |
| Operators (6) @ $100/day | 0% | $15,600 | $15,600 | $15,600 | $15,600 | $15,600 | $15,600 | $15,600 | $15,600 | $15,600 | $15,600 | $15,600 | $15,600 |
| Laborers (1) @ $80/day | 0% | $2,080 | $2,080 | $2,080 | $2,080 | $2,080 | $2,080 | $2,080 | $2,080 | $2,080 | $2,080 | $2,080 | $2,080 |
| Maintenance Mechanic (1) @ $100/day | 0% | $2,600 | $2,600 | $2,600 | $2,600 | $2,600 | $2,600 | $2,600 | $2,600 | $2,600 | $2,600 | $2,600 | $2,600 |
| Supervisors (3) @ $140/day | 0% | $10,920 | $10,920 | $10,920 | $10,920 | $10,920 | $10,920 | $10,920 | $10,920 | $10,920 | $10,920 | $10,920 | $10,920 |
| Managers (2) @ $5000/month | 0% | $10,000 | $10,000 | $10,000 | $10,000 | $10,000 | $10,000 | $10,000 | $10,000 | $10,000 | $10,000 | $10,000 | $10,000 |
| Total People | 15 | 15 | 15 | 15 | 15 | 15 | 15 | 15 | 15 | 15 | 15 | 15 | |
| Total Payroll | $45,152 | $45,152 | $45,152 | $45,152 | $45,152 | $45,152 | $45,152 | $45,152 | $45,152 | $45,152 | $45,152 | $45,152 | |
| General Assumptions | |||||||||||||
| Month 1 | Month 2 | Month 3 | Month 4 | Month 5 | Month 6 | Month 7 | Month 8 | Month 9 | Month 10 | Month 11 | Month 12 | ||
| Plan Month | 1 | 2 | 3 | 4 | 5 | 6 | 7 | 8 | 9 | 10 | 11 | 12 | |
| Current Interest Rate | 8.00% | 8.00% | 8.00% | 8.00% | 8.00% | 8.00% | 8.00% | 8.00% | 8.00% | 8.00% | 8.00% | 8.00% | |
| Long-term Interest Rate | 8.00% | 8.00% | 8.00% | 8.00% | 8.00% | 8.00% | 8.00% | 8.00% | 8.00% | 8.00% | 8.00% | 8.00% | |
| Tax Rate | 30.00% | 0.00% | 0.00% | 0.00% | 0.00% | 0.00% | 0.00% | 0.00% | 0.00% | 0.00% | 0.00% | 0.00% | |
| Other | 0 | 0 | 0 | 0 | 0 | 0 | 0 | 0 | 0 | 0 | 0 | 0 | |
| Pro Forma Profit and Loss | |||||||||||||
| Month 1 | Month 2 | Month 3 | Month 4 | Month 5 | Month 6 | Month 7 | Month 8 | Month 9 | Month 10 | Month 11 | Month 12 | ||
| Sales | $529,560 | $529,560 | $529,560 | $529,560 | $529,560 | $529,560 | $529,560 | $529,560 | $529,560 | $529,560 | $529,560 | $529,560 | |
| Direct Cost of Sales | $49,896 | $3,193 | $3,193 | $3,193 | $3,193 | $3,193 | $3,193 | $3,193 | $3,193 | $3,193 | $3,193 | $3,193 | |
| Geothermal Mat | $0 | $0 | $0 | $0 | $0 | $0 | $0 | $0 | $0 | $0 | $0 | $0 | |
| Total Cost of Sales | $49,896 | $3,193 | $3,193 | $3,193 | $3,193 | $3,193 | $3,193 | $3,193 | $3,193 | $3,193 | $3,193 | $3,193 | |
| Gross Margin | $479,664 | $526,367 | $526,367 | $526,367 | $526,367 | $526,367 | $526,367 | $526,367 | $526,367 | $526,367 | $526,367 | $526,367 | |
| Gross Margin % | 90.58% | 99.40% | 99.40% | 99.40% | 99.40% | 99.40% | 99.40% | 99.40% | 99.40% | 99.40% | 99.40% | 99.40% | |
| Expenses | |||||||||||||
| Payroll | $45,152 | $45,152 | $45,152 | $45,152 | $45,152 | $45,152 | $45,152 | $45,152 | $45,152 | $45,152 | $45,152 | $45,152 | |
| Sales and Marketing and Other Expenses | $157,659 | $157,659 | $157,659 | $157,659 | $157,659 | $157,659 | $157,659 | $157,659 | $157,659 | $157,659 | $157,659 | $167,659 | |
| Depreciation | $0 | $0 | $0 | $0 | $0 | $0 | $0 | $0 | $0 | $0 | $0 | $0 | |
| Truck Rental | $23,400 | $23,400 | $23,400 | $23,400 | $23,400 | $23,400 | $23,400 | $23,400 | $23,400 | $23,400 | $23,400 | $23,400 | |
| Utilities | $1,200 | $1,200 | $1,200 | $1,200 | $1,200 | $1,200 | $1,200 | $1,200 | $1,200 | $1,200 | $1,200 | $1,200 | |
| Insurance | $5,366 | $5,366 | $5,366 | $5,366 | $5,366 | $5,366 | $5,366 | $5,366 | $5,366 | $5,366 | $5,366 | $5,366 | |
| Telephone | $1,000 | $1,000 | $1,000 | $1,000 | $1,000 | $1,000 | $1,000 | $1,000 | $1,000 | $1,000 | $1,000 | $1,000 | |
| Payroll Taxes | 44% | $19,867 | $19,867 | $19,867 | $19,867 | $19,867 | $19,867 | $19,867 | $19,867 | $19,867 | $19,867 | $19,867 | $19,867 |
| Other | $0 | $0 | $0 | $0 | $0 | $0 | $0 | $0 | $0 | $0 | $0 | $0 | |
| Total Operating Expenses | $253,644 | $253,644 | $253,644 | $253,644 | $253,644 | $253,644 | $253,644 | $253,644 | $253,644 | $253,644 | $253,644 | $263,644 | |
| Profit Before Interest and Taxes | $226,020 | $272,723 | $272,723 | $272,723 | $272,723 | $272,723 | $272,723 | $272,723 | $272,723 | $272,723 | $272,723 | $262,723 | |
| EBITDA | $226,020 | $272,723 | $272,723 | $272,723 | $272,723 | $272,723 | $272,723 | $272,723 | $272,723 | $272,723 | $272,723 | $262,723 | |
| Interest Expense | $249 | $860 | $1,470 | $2,081 | $2,691 | $3,302 | $3,913 | $4,523 | $5,134 | $5,744 | $6,355 | $6,965 | |
| Taxes Incurred | $67,731 | $0 | $0 | $0 | $0 | $0 | $0 | $0 | $0 | $0 | $0 | $0 | |
| Net Profit | $158,040 | $271,863 | $271,252 | $270,642 | $270,031 | $269,421 | $268,810 | $268,200 | $267,589 | $266,979 | $266,368 | $255,758 | |
| Net Profit/Sales | 29.84% | 51.34% | 51.22% | 51.11% | 50.99% | 50.88% | 50.76% | 50.65% | 50.53% | 50.42% | 50.30% | 48.30% | |
| Pro Forma Cash Flow | |||||||||||||
| Month 1 | Month 2 | Month 3 | Month 4 | Month 5 | Month 6 | Month 7 | Month 8 | Month 9 | Month 10 | Month 11 | Month 12 | ||
| Cash Received | |||||||||||||
| Cash from Operations | |||||||||||||
| Cash Sales | $132,390 | $132,390 | $132,390 | $132,390 | $132,390 | $132,390 | $132,390 | $132,390 | $132,390 | $132,390 | $132,390 | $132,390 | |
| Cash from Receivables | $0 | $13,239 | $397,170 | $397,170 | $397,170 | $397,170 | $397,170 | $397,170 | $397,170 | $397,170 | $397,170 | $397,170 | |
| Subtotal Cash from Operations | $132,390 | $145,629 | $529,560 | $529,560 | $529,560 | $529,560 | $529,560 | $529,560 | $529,560 | $529,560 | $529,560 | $529,560 | |
| Additional Cash Received | |||||||||||||
| Sales Tax, VAT, HST/GST Received | 0.00% | $0 | $0 | $0 | $0 | $0 | $0 | $0 | $0 | $0 | $0 | $0 | $0 |
| New Current Borrowing | $0 | $54,190 | $54,190 | $54,190 | $54,190 | $54,190 | $54,190 | $54,190 | $54,190 | $54,190 | $54,190 | $54,190 | |
| New Other Liabilities (interest-free) | $0 | $0 | $0 | $0 | $0 | $0 | $0 | $0 | $0 | $0 | $0 | $0 | |
| New Long-term Liabilities | $37,391 | $37,391 | $37,391 | $37,391 | $37,391 | $37,391 | $37,391 | $37,391 | $37,391 | $37,391 | $37,391 | $37,391 | |
| Sales of Other Current Assets | $0 | $0 | $0 | $0 | $0 | $0 | $0 | $0 | $0 | $0 | $0 | $0 | |
| Sales of Long-term Assets | $0 | $0 | $0 | $0 | $0 | $0 | $0 | $0 | $0 | $0 | $0 | $0 | |
| New Investment Received | $5,848,000 | $1,700,000 | $0 | $0 | $0 | $0 | $0 | $0 | $0 | $0 | $0 | $0 | |
| Subtotal Cash Received | $6,017,781 | $1,937,210 | $621,141 | $621,141 | $621,141 | $621,141 | $621,141 | $621,141 | $621,141 | $621,141 | $621,141 | $621,141 | |
| Expenditures | Month 1 | Month 2 | Month 3 | Month 4 | Month 5 | Month 6 | Month 7 | Month 8 | Month 9 | Month 10 | Month 11 | Month 12 | |
| Expenditures from Operations | |||||||||||||
| Cash Spending | $45,152 | $45,152 | $45,152 | $45,152 | $45,152 | $45,152 | $45,152 | $45,152 | $45,152 | $45,152 | $45,152 | $45,152 | |
| Bill Payments | $10,879 | $322,574 | $212,565 | $213,176 | $213,786 | $214,397 | $215,008 | $215,618 | $216,229 | $216,839 | $217,450 | $218,394 | |
| Subtotal Spent on Operations | $56,031 | $367,726 | $257,717 | $258,328 | $258,938 | $259,549 | $260,160 | $260,770 | $261,381 | $261,991 | $262,602 | $263,546 | |
| Additional Cash Spent | |||||||||||||
| Sales Tax, VAT, HST/GST Paid Out | $0 | $0 | $0 | $0 | $0 | $0 | $0 | $0 | $0 | $0 | $0 | $0 | |
| Principal Repayment of Current Borrowing | $3,500,000 | $0 | $0 | $0 | $0 | $0 | $0 | $0 | $0 | $0 | $0 | $0 | |
| Other Liabilities Principal Repayment | $0 | $0 | $0 | $0 | $0 | $0 | $0 | $0 | $0 | $0 | $0 | $0 | |
| Long-term Liabilities Principal Repayment | $0 | $0 | $0 | $0 | $0 | $0 | $0 | $0 | $0 | $0 | $0 | $0 | |
| Purchase Other Current Assets | $0 | $0 | $0 | $0 | $0 | $0 | $0 | $0 | $0 | $0 | $0 | $0 | |
| Purchase Long-term Assets | $2,422,018 | $319,933 | $150,833 | $218,833 | $145,833 | $196,033 | $465,833 | $220,133 | $313,333 | $13,333 | $278,083 | $258,083 | |
| Dividends | $0 | $0 | $0 | $0 | $0 | $0 | $0 | $0 | $0 | $0 | $0 | $0 | |
| Subtotal Cash Spent | $5,978,049 | $687,659 | $408,550 | $477,161 | $404,771 | $455,582 | $725,993 | $480,903 | $574,714 | $275,324 | $540,685 | $521,629 | |
| Net Cash Flow | $39,732 | $1,249,551 | $212,591 | $143,980 | $216,370 | $165,559 | ($104,852) | $140,238 | $46,427 | $345,817 | $80,456 | $99,512 | |
| Cash Balance | $169,060 | $1,418,611 | $1,631,202 | $1,775,182 | $1,991,551 | $2,157,110 | $2,052,259 | $2,192,497 | $2,238,924 | $2,584,741 | $2,665,197 | $2,764,710 | |
| Pro Forma Balance Sheet | |||||||||||||
| Month 1 | Month 2 | Month 3 | Month 4 | Month 5 | Month 6 | Month 7 | Month 8 | Month 9 | Month 10 | Month 11 | Month 12 | ||
| Assets | Starting Balances | ||||||||||||
| Current Assets | |||||||||||||
| Cash | $129,328 | $169,060 | $1,418,611 | $1,631,202 | $1,775,182 | $1,991,551 | $2,157,110 | $2,052,259 | $2,192,497 | $2,238,924 | $2,584,741 | $2,665,197 | $2,764,710 |
| Accounts Receivable | $0 | $397,170 | $781,101 | $781,101 | $781,101 | $781,101 | $781,101 | $781,101 | $781,101 | $781,101 | $781,101 | $781,101 | $781,101 |
| Other Current Assets | $350,000 | $350,000 | $350,000 | $350,000 | $350,000 | $350,000 | $350,000 | $350,000 | $350,000 | $350,000 | $350,000 | $350,000 | $350,000 |
| Total Current Assets | $479,328 | $916,230 | $2,549,712 | $2,762,303 | $2,906,283 | $3,122,652 | $3,288,211 | $3,183,360 | $3,323,598 | $3,370,025 | $3,715,842 | $3,796,298 | $3,895,811 |
| Long-term Assets | |||||||||||||
| Long-term Assets | $7,000,000 | $9,422,018 | $9,741,951 | $9,892,784 | $10,111,617 | $10,257,450 | $10,453,483 | $10,919,316 | $11,139,449 | $11,452,782 | $11,466,115 | $11,744,198 | $12,002,281 |
| Accumulated Depreciation | $0 | $0 | $0 | $0 | $0 | $0 | $0 | $0 | $0 | $0 | $0 | $0 | $0 |
| Total Long-term Assets | $7,000,000 | $9,422,018 | $9,741,951 | $9,892,784 | $10,111,617 | $10,257,450 | $10,453,483 | $10,919,316 | $11,139,449 | $11,452,782 | $11,466,115 | $11,744,198 | $12,002,281 |
| Total Assets | $7,479,328 | $10,338,248 | $12,291,663 | $12,655,087 | $13,017,900 | $13,380,102 | $13,741,694 | $14,102,676 | $14,463,047 | $14,822,807 | $15,181,957 | $15,540,496 | $15,898,092 |
| Liabilities and Capital | Month 1 | Month 2 | Month 3 | Month 4 | Month 5 | Month 6 | Month 7 | Month 8 | Month 9 | Month 10 | Month 11 | Month 12 | |
| Current Liabilities | |||||||||||||
| Accounts Payable | $0 | $315,489 | $205,460 | $206,050 | $206,641 | $207,231 | $207,821 | $208,411 | $209,001 | $209,592 | $210,182 | $210,772 | $221,029 |
| Current Borrowing | $3,500,000 | $0 | $54,190 | $108,380 | $162,570 | $216,760 | $270,950 | $325,140 | $379,330 | $433,520 | $487,710 | $541,900 | $596,090 |
| Other Current Liabilities | $0 | $0 | $0 | $0 | $0 | $0 | $0 | $0 | $0 | $0 | $0 | $0 | $0 |
| Subtotal Current Liabilities | $3,500,000 | $315,489 | $259,650 | $314,430 | $369,211 | $423,991 | $478,771 | $533,551 | $588,331 | $643,112 | $697,892 | $752,672 | $817,119 |
| Long-term Liabilities | $0 | $37,391 | $74,782 | $112,173 | $149,564 | $186,955 | $224,346 | $261,737 | $299,128 | $336,519 | $373,910 | $411,301 | $448,692 |
| Total Liabilities | $3,500,000 | $352,880 | $334,432 | $426,603 | $518,775 | $610,946 | $703,117 | $795,288 | $887,459 | $979,631 | $1,071,802 | $1,163,973 | $1,265,811 |
| Paid-in Capital | $4,000,000 | $9,848,000 | $11,548,000 | $11,548,000 | $11,548,000 | $11,548,000 | $11,548,000 | $11,548,000 | $11,548,000 | $11,548,000 | $11,548,000 | $11,548,000 | $11,548,000 |
| Retained Earnings | ($20,672) | ($20,672) | ($20,672) | ($20,672) | ($20,672) | ($20,672) | ($20,672) | ($20,672) | ($20,672) | ($20,672) | ($20,672) | ($20,672) | ($20,672) |
| Earnings | $0 | $158,040 | $429,903 | $701,155 | $971,797 | $1,241,828 | $1,511,249 | $1,780,060 | $2,048,259 | $2,315,848 | $2,582,827 | $2,849,195 | $3,104,953 |
| Total Capital | $3,979,328 | $9,985,368 | $11,957,231 | $12,228,483 | $12,499,125 | $12,769,156 | $13,038,577 | $13,307,388 | $13,575,587 | $13,843,176 | $14,110,155 | $14,376,523 | $14,632,281 |
| Total Liabilities and Capital | $7,479,328 | $10,338,248 | $12,291,663 | $12,655,087 | $13,017,900 | $13,380,102 | $13,741,694 | $14,102,676 | $14,463,047 | $14,822,807 | $15,181,957 | $15,540,496 | $15,898,092 |
| Net Worth | $3,979,328 | $9,985,368 | $11,957,231 | $12,228,483 | $12,499,125 | $12,769,156 | $13,038,577 | $13,307,388 | $13,575,587 | $13,843,176 | $14,110,155 | $14,376,523 | $14,632,281 |

