
Amerihall
Executive Summary
Our place in the market, though just pure luck and a lot of arrogance, has put us in a position to literally change the real estate industry forever. The advent of e-commerce and the growth of the Internet has no bearing on our current business plan. The Internet, in our opinion, is just a tool used by our company to supply services directly to an agent’s home office, but still conform to all our legal obligations under state and federal laws. We have the ability to offer our agents 100% of the commission from their sale, a situation that is afforded only the most successful realtors in the industry. We can do this by charging them only $200 per month, plus $100 per listing and/or sale. If you look at our projections, we can accomplish this and still generate astronomical profits from the deal. The agents save thousands of dollars, which makes it imperative to join our company. We make a great profit, and consumers save a great deal of money as well. The agents affiliated with Amerihall are called Amerihall Realest®; this title is awarded once they have reached the highest quality of professionalism and knowledge of the real estate industry.
The partners in this program are very capable in the automation of businesses as well as knowing the needs of real estate agents. This, combined with the timeline for change via the Web, gave us this opportunity to develop a site dedicated to the needs of the real estate industry. This includes agents, clients, suppliers, and even real estate educational services. Our company envisions continuing education classes provided to our agents exclusively through our website allowing agents, for a fee, directly from their home computers, to accomplish all the continuing educational needs required by the various states. The process will be complete all the way down to automatically filling their state license renewal through the appropriate agencies.
We are, simply put, “the future of real estate” and with the cooperation of the following affiliated organizations, we believe this will revolutionize the real estate industry.
1.1 Strategic Alliances
AT&T will supply all of our Web needs as well as automate servers designed specifically for our agents allowing them to receive all of their calls through our virtual floor time plan. Each agent will be assigned an extension number. When clients call our toll-free phone number, they will be prompted to enter the agent’s extension. This call will then be forwarded directly to the agent’s home office. If a client does not have a particular agent’s extension number, they will be instructed to enter a second option and the call will be automatically forwarded to the closest Amerihall agent. AT&T realizes the strength of our business plan and has already anticipated that our growth will be so rapid, they needed to automate their systems further just to handle the demand. Their projection, which is independent of our own, is 10,000 within the 1st year and an anticipation for 100,000 transactions on their network before retooling their system. Their strength in our future lies in their ability to supply all of our potential clients with wide-band Internet access through cable modems. We are currently looking at a script page to allow our agents easy sign up and discounted installation program. This will allow our agents easy sign-up and a discounted installation program, and will also allow our agents a direct link through our website, promoting fast Internet access at discounted rates. Our company’s growth will be directly impacted on how fast clients and agents adapt to technology: AT&T is the best bet for implementing these future products
Bank of America has provided the most services to date for our company. They recognized early on in preliminary talks with our Web developer that this company will be a huge asset to the real estate industry. In addition to providing merchant services dedicated to our special billing needs, they have also developed special script in association with our Web development staff to handle the very specific needs of Amerihall agents. Bank of America and Amerihall have developed a system that will allow our agents to deposit their escrow checks directly into our corporate account right from their virtual office terminal. The electronic transfer will be instantaneous and will print direct deposit receipt instantly to the realtors’ printer. We are the first in the industry to provide this service. The bank will also certify our escrow accounts on a monthly basis providing our clients the highest quality control in the industry. These measures surpass all state requirements for escrow managements. Bank of America’s software developers are currently working on more features with future plans to allow our agents and their clients the ability to watch the transaction progress through all stages from start to finish.
Sterling Capital Mortgage is a national brokerage firm for residential mortgages. The have offered, at no expense to us, the ability for our agents to go online through our site exclusively and run a brief credit history on the clients. The server will automatically print a prequalification letter immediately allowing the agent and client to submit with an offer to purchase a particular property. This, again, is a system that was developed specifically for Amerihall and its members.
Lowen Signs is the largest real estate sign manufacturer in the country. They have developed a dedicated Web page for our agents to order their personalized Amerihall signs and ship them directly to the agent.
1.2 Service Description
Our product will be furnished on the Internet giving our agents the power to handle all of their real estate activities. The Internet already provides them access to our regional multiple listing services. This allows them to post their listings and reports their sales. We want to offer them all of the services that a traditional office offers without ever having to visit the designated office.
The website will allow agents to pick a duty to perform and be placed on the appropriate page to accomplish that particular task.
If agents need to order paper supplies, they simply go to our vendor area and pick the style, quantity, and the personal information to be printed. This site will be connected to a printer who will fill the order and ship the material directly to their home office. We ultimately would like to see the event as totally transparent to the agent and make it seem to be just another service provided by Amerihall. The same system would apply to house signs, Errors & Omissions Insurance, home inspection agencies, and real estate lawyers. We will also offer a site to a nationally recognized mortgage company. The realtor has the ability to punch in their clients personal information and the site will immediately run a credit check and download a prequalification letter for the purchase of the new home.
Our system will allow agents to be billed by credit card for all services, including monthly fees.
Our company will carry a blanket Error & Omissions insurance policy. Amerihall will pay the insurance carrier one fee annually and bill agents a quarterly fee of approximately $60 each.

Finally we will offer all the agents a nationally advertised toll-free number. This number will be advertised on participating Realest® signs with their phone extension. A caller will dial the toll free number and be prompted to provide the extension. The phone call would then be forwarded to the agent’s home office.
The number will also be a nationally advertised general number for the company allowing us to market the same number to all of our prospective clients via traditional advertising techniques. When a prospect calls the toll-free number and chooses option #2, AT&T automation will search out the closest Amerihall agent using the address finding service and forward the call to the agent. If the service fails to find an Amerihall Realest® agent in the area, the call will return to the corporate office and then be referred to a non-participating agent with an expressed agreement that they will pay a 20% referral fee to our office.
This feature will allow us to pay for national advertising to increase our public attention, without having to over-burden the individual agents with high advertising costs. As technology progresses, we are interested in ultimately doing all of the phone features in-house.
We will have a live online help desk, available during business hours, to answer all of our agents’ questions and concerns. There will also be an email help desk constantly online.
In addition to all these feature, the agents will be able to download all of the forms used in the sale and management of real estate via the website.
In the future, our virtual office will take advantage of a live chat through NetMeeting, which will allow all agents (with the appropriate equipment) to communicate with each other, as well as deal with questions and concerns directly with our staff.
We would also like to offer all the agents their own email address that corresponds with their Amerihall image.
1.3 Description of Company
Amerihall is a culmination of the ownership of several real estate companies both franchises and partnerships. Hall Properties Realty, Inc. has been in business for over 18 years with ownership in a commercial real estate sales and management company. Hall properties has also owned franchise rights for a residential real estate franchise D.B.A. Re/Max Junction. We have focused our real estate sales on creative marketing through the use of technology.
We have found shortcomings in real estate sales technique as a whole. The traditional real estate office follows a plan where brokers supply an office and basic equipment (i.e. phone, fax, computer, printers). They also supply all prerequisites dictated by state law, in that the company will have a place of business that is open for inspection by the appointed agencies of the state during normal business hours. The office and all pertinent documents for running the business will be open for inspection through the designated business hours. They also must supply at least one designated broker who answers to the state agencies concerning all real estate related issues.
There is no limit to the number of agents under one broker’s license, and the only rule designated by the state concerning the amount of agents is that all of their licenses must be displayed conspicuously in the office.
In the traditional office, the company receives 20%-50% of all commissions received from sales generated by the agent. This can amount to tens of thousands of dollars, and they still charge the agents for all miscellaneous items, which can run into hundreds of dollars monthly.
The Re/Max plan is a simple desk fee that is paid monthly on a triple net lease. This means an agent pays an average of $2,000 per month for desk rental and pays a shared fee for all other expenses (utilities, salaries, supplies, etc.).
In both cases, the agent is still liable for all personal advertising that is set up in a way to benefit the office as much as the agent. They are never guaranteed to get the fullest return on their investment.
Our plan is to take advantage of the Internet and provide individual agents with the ability to work out of their own homes using a computer, fax, and Internet connection to service all of their clients’ needs, thus eliminating the overhead of an expensive office. The agent gets to advertise in a fashion allowed by law and receives all the proceeds from their investment. Amerihall agents pay our company a flat fee of $200.00 per month and $100.00 per transaction. In return, the agent receives 100% of their commissions.
1.4 Mission
The mission of Amerihall is to change the way we all do business in real estate by reducing the expense of a traditional office and replacing it with a virtual real estate office using the Internet. We are literally saving real estate agents $30,000 to $50,000 per year, which will increase their profits and put them in a position to underbid all other conventional realtors in the commissions charged to consumers, ultimately saving the consumer thousands of dollars on the sale of the property.
1.5 Financing Requirements
The owner invests a total of $125,000 into the company. The rest will be funded by new membership and sales of services.
Our interest in seeking outside funding is solely for the purpose of expanding on a national level. The funds will be used for developing and marketing Amerihall through the continental United States. We will be using a direct marketing campaign through lists received through the Freedom of Information Act from the individual state licensing agencies. Our campaign will be modified only slightly to accommodate the different state laws and regional policies associated with real estate agents.
Company Summary
Our staff has the knowledge and foresight to help the industry into the 21st century. We are committed to technology growth and the changes in the real estate industry.
- Providing agents with all the tools associated with the traditional real estate office at a fraction of the price.
- Affording all the service vendors in the industry with a captured market of realtors through our website. These companies may market their products and services directly to Amerihall Realests® and its represented agents as long as we agree to their sales co-op.
- Offering clientele an avenue to list their properties without the expense of a full-service real estate company. This particular service has already been proven successful through other Internet-based companies.
2.1 Organizational Structure
Regional office (1 per state):
- 1 Managing Broker
- 1 Clerical Secretary
- 1 Regional Sales Administrator
Corporate office:
- 1 Managing Director (David Hall)
- 1 Director of Realest® Relations
- 2 Clerical Secretaries
- 2 Online Help Representatives
- 1 Regional Sales Administrator
- 2 National Convention Administrators
- 1 Convention\Sales Coordinator
2.2 Guarantees and Warranties
Our service agreement with the agents will include all requirements dictated by each state in performing our broker duties. We will also provide technical support for all of the services and software provided on our website. The computer manufacturer will provide all hardware warranties.
Errors and Omissions Insurance will be mandatory and billed directly to the agent quarterly ($60).
The escrow account will be balanced and certified monthly by a subsidiary of Bank of America.
All agents will be required to hold a membership with the National Association of Realtors and be subject to all of their rules of ethics and standard operating procedures.
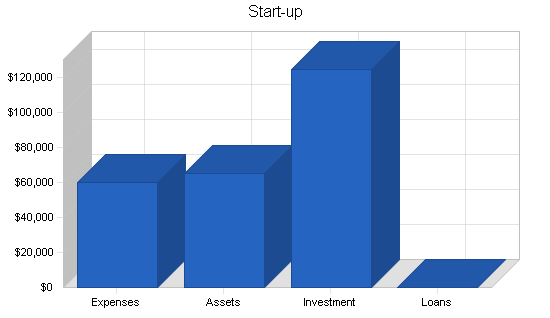
2.3 Start-up Summary
Our start-up is fully financed by David Hall. He is capable of supplying the capital for regional development. It is assumed that, without financing, the company’s growth will be fulfilled by revenues. The profile suggests such a low overhead that no need for further financing is needed. Our only advantage to financial help is to accelerate the growth process for a national presence.
| Start-up | |
| Requirements | |
| Start-up Expenses | |
| Legal | $15,000 |
| Stationery etc. | $1,200 |
| Brochures | $6,000 |
| Consultants | $2,000 |
| Insurance | $850 |
| Rent | $0 |
| Research and Development | $20,000 |
| Expensed Equipment | $12,000 |
| Other | $3,000 |
| Total Start-up Expenses | $60,050 |
| Start-up Assets | |
| Cash Required | $65,000 |
| Other Current Assets | $0 |
| Long-term Assets | $0 |
| Total Assets | $65,000 |
| Total Requirements | $125,050 |
| Start-up Funding | |
| Start-up Expenses to Fund | $60,050 |
| Start-up Assets to Fund | $65,000 |
| Total Funding Required | $125,050 |
| Assets | |
| Non-cash Assets from Start-up | $0 |
| Cash Requirements from Start-up | $65,000 |
| Additional Cash Raised | $0 |
| Cash Balance on Starting Date | $65,000 |
| Total Assets | $65,000 |
| Liabilities and Capital | |
| Liabilities | |
| Current Borrowing | $0 |
| Long-term Liabilities | $0 |
| Accounts Payable (Outstanding Bills) | $0 |
| Other Current Liabilities (interest-free) | $0 |
| Total Liabilities | $0 |
| Capital | |
| Planned Investment | |
| David Hall | $125,050 |
| Investor 2 | $0 |
| Other | $0 |
| Additional Investment Requirement | $0 |
| Total Planned Investment | $125,050 |
| Loss at Start-up (Start-up Expenses) | ($60,050) |
| Total Capital | $65,000 |
| Total Capital and Liabilities | $65,000 |
| Total Funding | $125,050 |
2.4 Technology
We will be spending a large amount of our profits on development and compter equipment to better service our agents and stay slightly ahead of the technology trends. The project demand for capital will grow only slightly over the first three years as our template for the business pan will copy well from one state to another. Our expense will be centered on maintenance and upgrading over a long term and should not exceed 2% of gross revenues.
Market Analysis Summary
This revolutionary plan is setting the stage for the future of real estate. No existing franchised or corporate owned traditional real estate company will be able to compete with the fees and subsequent profits established by our industry plan.
Even if the structure of real estate sales in the future is automated to the point of not needing real estate agents, our company will have a firm hold on the FSBO (For Sale By Owner) market. We are committed to change and embrace the idea that is inevitable. Our ability to foresee needs for change will prepare us for a profitable future in the industry.
3.1 Market Segmentation
Established Realtors: The majority of our market will consist of the Established Realtor and is viewed as the future of real estate. These agents have embraced technology and are constantly looking for new ways to increase their profit margin. Our service is ideal for them in that the majority of this part of the market has already sought out a 100% commission program and has established a home office as well as a Web presence. This technology-savvy group will be the fundamental part of the industry in the future and will see our company as simply “the wave of the future,” in real estate.
New Real Estate Agents: We project our New Agent segment to be a much smaller share than our Established Realtors segment. We assume that agents new to the real estate industry will need more hands-on training found in traditional real estate offices. Though, as technology progresses and our website matures, even inexperienced agents will find Amerihall beneficial.
Old Timers: Our research shows that the Old Timers will resist change and not be as willing to accept new technology as the Established Realtors. This part of the market is predicted to be our slowest growth area.

| Market Analysis | |||||||
| Year 1 | Year 2 | Year 3 | Year 4 | Year 5 | |||
| Potential Customers | Growth | CAGR | |||||
| Established Realtors | 43% | 15,000 | 21,450 | 30,674 | 43,864 | 62,726 | 43.00% |
| New Realtors | 5% | 500 | 525 | 551 | 579 | 608 | 5.01% |
| Old Time Realtors | 3% | 300 | 309 | 318 | 328 | 338 | 3.03% |
| Total | 41.68% | 15,800 | 22,284 | 31,543 | 44,771 | 63,672 | 41.68% |
3.2 Target Market Segment Strategy
Originally our target will be the more experienced, computer-literate agent in the state of Illinois. We will expand the target as our system becomes more refined. The expansion to a national level should take no less than two years. Our research shows that in the beginning, our clients will be within the age of 30 to 45, with annual sales between $1.5 and $5 million. The clientele should be centered on the northwest suburbs, expanding to the western suburbs, followed by greater metropolitan Chicago, and finally fanning out to rural Illinois. At this point we will re-evaluate the growth market to determine the best plan of action.
3.2.1 Market Needs
We believe that, with our direction centered on e-commerce, our business can focus on expanding Web services with a boundless growth potential. Our market may be directed to providing specialized real estate software to all real estate agents, including our competitors.
Phase 2 of our plan will focus on clients looking to sell real estate on their own. The term used for this type of client is FSBO (For Sale By Owner, pronounced fisbo). This part of the market is growing at an alarming rate. Research from many independent sources show this growth factor will result in a decline of top-producing real estate agents by as much as 50%.
We believe our service, through Web technology, and the largest market share of realtors will provide us with the needed tools to overcome the changing real estate sales trends. Our goal is to provide full-service real estate sales at a fraction of the cost associated with traditional real estate office.
Currently, the traditional real estate office provides the listing and sale of a client’s property at approximately 6% commission of the total sale. This figure is an industry norm that is usually set by the managing broker. This figure can go as low as 5% in metropolitan areas and as high as 10% for commercial or other unique properties. To put this in perspective, a home selling for $200,000 will cost an average of $12,000 in commissions alone, not to mention legal fees and other closing costs which can bring the figure to as high as $15,000 before capital gains tax. It is plain to see why clients are scrambling to find ways to sell their own properties. The current figures for licensed real estate agents in Illinois alone are 49,000 with a 98.2% share of all sales in real estate. The untold truth is that, of the sales of real estate, 82% of the listings are sold by another real estate agent outside the listing office. The buyer’s agent receives 2.5 to 3.0% of the total commission charged to the seller. This is the saving grace of the industry and the key to our future roles as a real estate sales company. Our proposal for Phase 2 is simply to establish a revenue base from the ever-growing FSBO market.
Our plan is to initiate a Web-based tool which allows the public to input a listing directly into the Multiple Listing Service (MLS). The client will be able to list a home and show the properties themselves. The advantage is that this will be accomplished by only paying 2.5% – 3.5%, compared to the industry standard of 6%. Through automation, the public will have the option of saving thousands of dollars and receive the same marketing strength of a client listing a property the conventional way. The client will still receive offers from other realtors who, upon closing, will still receive 2.5%-3.5% commission for bringing in the buyer.
If the client is in need of a full-service realtor at any time through the transaction, there is always the option of searching out a local Amerihall Realest® agent with whom they can negotiate a deal, depending on the services needed.
Our agents benefit by being guaranteed added income when services are rendered. In this regard, we hope that agents will accept our proposed strategy to pull in a new market and not consider it a threat to their livelihood.
Clients benefit by saving thousands of dollars when taking on the responsibility of showing their homes themselves, a task that is legal and preformed more and more by consumers on a regular basis in the industry.
Our share of the profit is 1% commission on the sale, and no overhead on our part. This will establish a future market in this ever-changing environment. This phase of the plan will not be initiated until the Web volume is appropriate.
3.2.2 Market Growth
Our initial plan will provide for 27,000 Amerihall brochures to be mailed to all of the active realtors within the Multiple Listing Services of Northern Illinois (MLSNI). The response should be expected to be no less then 1,800. The responding agents will receive a start-up package, which details our services and provides transfer forms and related independent contractors agreement, or the agent can join Amerihall at our website, www.Amerihall.com. This process is expected to bring in 1,000 new agents The bulk of our agents should then trickle in as their contracts expire with their existing offices. We project 1,500 agents within the first year.
3.3 Service Business Analysis
The following topics will list a number of attributes associated with our business structure. Our plan is simple: that we will have no competition due to the fact that no company will be able to compete under the existing structure of their corporations. The established national real estate companies (i.e. Re/Max, Century 21 and Coldwell Banker) cannot compete while under a franchise structure. Independently owned offices have too much overhead to be able to compete with our corporate structure.
3.3.1 Competitive Edge
We project that all agents working for Amerihall will increase their profit margin by 70%. We suggest that, by volume of agents alone, our advertising and sales will stand out well above the other real estate companies. Our agents will be able to offer their services for 25% of the normal rates and still realize a significant profit.
Our agents will have the ability of changing the industry standard by under bidding the competition to the point that traditional real estate companies will be unable to compete due to high operating cost.
3.3.2 Main Competitors
The two largest companies are Re/Max and Century 21. We expect much resistance from these two leaders in the industry. Our first obstacle may lie in a direct legal assault on our company in an effort to drain our assets, and give them strength through diffusion; the second effort will probably be centered on credibility. The focus will be on how a rogue real estate agent could possibly provide services as efficiently as traditional office agents. These situations can both be defended by a professional image and certainly by the technology our agents can bring to their disposal.
3.3.3 Competition and Buying Patterns
The uniqueness of our company, and our knowledge of the realtors’ needs, gives us an exceptional lead over any competitor. Our concern is over copycat companies and the ease of repeating our idea before we grab a firm national position. We are investing a great amount of energy using copyrights and patent laws to assure a firm position.
Strategy and Implementation Summary
During the first phase of our plan, we will focus on the region of Illinois covered by the MLSNI. This service is the tool used by all realtors in the northwest region of the state to market their clients’ properties. This company is owned by 13 of the surrounding realtor boards, each holding a position on the board. This collaborative effort has established the largest real estate multiple listing service (MLS) in the country. This fact is the reason why Amerihall decided to use this region as its test market. This move allows us to prove the validity of our corporate plans well as test all the features associated with the different phases of the operation.
4.1 Sales Strategy
Our sales strategy is to automate the process so agents may apply for membership on the website and, after answering several questions, will be instructed to print out the required forms for making application to our company as well as the state and appropriate MLS.
Our services are automated and profits are based on volume. The agent, to be competitive in our real estate market, will have to join our company or succumb to the industry change. We are leaving no choice but to conform to our way or vanish into the past. The patent pending on our business plan will hopefully stop copycat companies and give us time to gain a strong foothold in the industry.
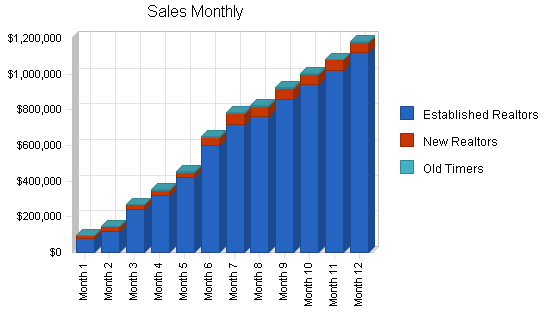
4.1.1 Sales Forecast
The following chart and table give a run-down on forecasted sales. We expect to have strong sales growth for each product in the first few months.
August through September we expect slow sales due to process of transferring agents from one office to another. Our services will promote more realtors signing on steadily over the first several years. We will truly be tested by the volume of agents entering the office, particularly through the first year.
| Sales Forecast | |||
| Year 1 | Year 2 | Year 3 | |
| Unit Sales | |||
| Established Realtors | 18,000 | 54,000 | 180,000 |
| New Realtors | 1,790 | 5,370 | 17,900 |
| Old Timers | 176 | 528 | 1,760 |
| Total Unit Sales | 19,966 | 59,898 | 199,660 |
| Unit Prices | Year 1 | Year 2 | Year 3 |
| Established Realtors | $400.00 | $400.00 | $400.00 |
| New Realtors | $300.00 | $300.00 | $300.00 |
| Old Timers | $250.00 | $250.00 | $250.00 |
| Sales | |||
| Established Realtors | $7,200,000 | $21,600,000 | $72,000,000 |
| New Realtors | $537,000 | $1,611,000 | $5,370,000 |
| Old Timers | $44,000 | $132,000 | $440,000 |
| Total Sales | $7,781,000 | $23,343,000 | $77,810,000 |
| Direct Unit Costs | Year 1 | Year 2 | Year 3 |
| Established Realtors | $65.00 | $65.00 | $65.00 |
| New Realtors | $60.00 | $60.00 | $60.00 |
| Old Timers | $60.00 | $60.00 | $60.00 |
| Direct Cost of Sales | |||
| Established Realtors | $1,170,000 | $3,510,000 | $11,700,000 |
| New Realtors | $107,400 | $322,200 | $1,074,000 |
| Old Timers | $10,560 | $31,680 | $105,600 |
| Subtotal Direct Cost of Sales | $1,287,960 | $3,863,880 | $12,879,600 |
4.2 Milestones
The following table is self explanatory, but as with all good plans, the dates are not written in stone. Our plan will vary drastically depending on capital. Everything listed in the following plan could be easily accomplished within a 12-month period of time, which would keep right in pace with the Internet growth technology.
What the table doesn’t show is the commitment behind it. Our business plan includes complete provisions for a plan-vs-actual analysis, and we will hold monthly follow-up meetings to discuss the variance and course corrections.

| Milestones | |||||
| Milestone | Start Date | End Date | Budget | Manager | Department |
| Web Implementation | 9/1/1999 | 8/1/2000 | $20,000 | Catherine | CG-2 |
| Brochure Mailing | 8/10/2000 | 8/10/2000 | $6,000 | Ellisa | Corporate |
| File Patent | 5/10/2000 | 5/10/2000 | $2,000 | Mertes | Legal |
| Realest® Trademark | 5/1/2000 | 5/1/2000 | $2,000 | Mertes | Legal |
| Open 2nd Market | 1/1/2001 | 3/1/2001 | $5,000 | David Hall | Corporate |
| Open 3rd thru 10th Markets | 12/1/2002 | 12/1/2004 | $65,000 | David Hall | Corporate |
| Open 11th thru 50th States | 12/1/2005 | 12/1/2010 | $1,256,000 | David Hall | Corporate |
| FSBO Market | 5/1/2001 | 12/1/2001 | $25,000 | Catherine | CG-2 |
| Vendor Web Market | 1/1/2002 | 1/1/2003 | $40,000 | Catherine | CG-2 |
| Instant Transaction Access | 12/1/2000 | 1/1/2001 | $100,000 | Catherine | CG-2 |
| Totals | $1,521,000 | ||||
Management Summary
The management is one of our strongest points in this plan. Our Internet-based service allows for automation to be our key asset. This virtual office is the most automated office environment known in the industry. Our planning has been based on servicing all clients using an Internet-based system allowing for a very low overhead. This process, though expensive in the beginning, will allow us to realize unbelievable profit over the years.
Our ability to keep each state-represented office to a mere three full-time personnel, and the corporate office to 13 employees allows us to man the entire country with a staff of 163-170 personnel. The traditional office holds an average of three personnel per office with the average office, servicing only 30 agents.
To put this in another light, in Illinois there are over 42,000 agents with over 45,000 offices. The average office employs three full-time personnel and one part-time employee for a total of 13,500 full-time employees. A fully-staffed, National Amerihall corporate presence will need no more then 200 employees to service up to 525,000 agents, or one employee for every 2,625 agents. This compares to the national average of one employee for every 3.1 agents. This figure amounts to millions of dollars in savings and just by design, no other established real estate company in the world can compete.
5.1 Personnel Plan
From the outset, our staff will be kept to a bare minimum and replaced at every opportunity by automation. The key to our success is dependent on our ability to provide high quality service at a low cost. The best way to accomplish our goals is with the use of automated database applications and the Internet.
The following table summarizes our personnel expenditures for the first three years, with compensation increasing from less than $240,000 for the first year to over $2.1 million in the third. We believe this plan is a equitable balance between fairness and expedience, and meets the commitment of our mission statement.
| Personnel Plan | |||
| Year 1 | Year 2 | Year 3 | |
| Secretary Corporate | $24,000 | $50,000 | $150,000 |
| Director of Conventions/Sales | $11,250 | $45,000 | $47,000 |
| National Convention Staff | $12,500 | $40,000 | $85,000 |
| Online Help | $0 | $60,000 | $62,000 |
| Director of Realest® Relations | $64,996 | $65,000 | $75,000 |
| Clerical Secretary | $13,336 | $120,000 | $400,000 |
| Managing Director | $69,996 | $120,000 | $130,000 |
| Regional Sales Administrator | $0 | $120,000 | $400,000 |
| Managing Broker | $36,000 | $240,000 | $800,000 |
| Total People | 7 | 9 | 41 |
| Total Payroll | $232,078 | $860,000 | $2,149,000 |
5.2 Management Team
David Hall, Managing Director, before founding Amerihall, was the founder of Hall Properties Reality, Inc., which was derived from family-owned real estate holdings. Hall Properties was located in Chicago for 15 years before moving to the NW suburbs and ultimately settling in Prospect Heights. David’s expertise has been in the medical industry originating from a 10-year service with Chicago. Fire Department where he served as a Paramedic officer. During his tenure he studied computer sciences and became an expert in office automation techniques where he finally developed several computer oriented real estate services.
Ellisa Hall, Director Of Realest® Relations, was originally hired to take over management of the office staff and bookkeeping. Ellisa has a long employment history in management positions. She is familiarizing us with the positive and negative aspects of the major real estate companies, knowledge gained from her search for perfecting a smooth office operations system. Ellisa spent 5 years exploring all of the companies through hands on employment as office manager. These companies ranged from small, individually owned operations, to large corporate offices handling up to 60 agents per office. The largest was a privately owned company holding 43 individual offices with as many as 800 agents. Ellisa is the undisputable leader in her field and has insight to the needs of the average real estate agent.
We intend to hire two full-time realtors to handle office duties and client relations. We also plan to extend the staff to include an Internet server administrator and marketing personnel to service our advertising.
Financial Plan
We want to finance growth mainly through cash flow. We recognize that this means we will have to grow more slowly than we might like. The most important factor in our case is collection days. Our agents are committed to a year lease with a 30-day cancellation agreement. These 30 days are not prorated and payment comes at the first of every month through direct withdrawal from either a major credit card or electronic transfer. If a credit card transaction fails because the agent has exceeded his/her limit or has received an NSF from his/her bank, he/she will be locked out of the members area automatically. This will prohibit him/her from performing any duties as a real estate agent until the problem has been remedied.
6.1 Funding Options
The owner plans to invest $125,000 of his own money (the proceeds of the liquidation of properties and assets of Hall Properties Realty, Inc.). The cash flow projections show that the business will require $65,000 of working capital during the early months of the first year of operations. If a new corporate site is needed for unforeseen growth, additional financing may be necessary. We have identified three options for raising further funds
- The sale of equity, perhaps to unknown investors, with a goal to raise between $200,000 and $300,000. This would provide some capital to allow for growth. Any shortfall could be funded either by a line of credit or a bank loan. This option is not needed due to current capital and should only be considered as a term loan with no equity stake.
- Approach our bank with a view to raising a medium-term loan of $200,000 and a line of credit of $60,000. David Hall could provide any lender with security for part, if not all, of this facility.
- Option: This third option has been added due to the overwhelming response of real estate agents and other professionals in the real estate field. Our national presence should be guaranteed and only capital will set the pace for accomplishing this goal. Our figures to date have been with no financing, and it could take as long as five years to complete. Our belief is that this period of time could leave an area open for competition and should possibly be addressed now. Our figures, though not set in stone, should be placed at $1 million, but that should be considered low end. If you take into account the other untouched markets that have not been addressed in Phase 1 of our plan, we should be ready to seek an additional $1 million for future growth as the need arises .
6.2 Important Assumptions
The financial plan depends on important assumptions, most of which are shown in the following table as annual assumptions. From the beginning, we recognize that collection days are critical, but not a factor we can easily influence. At least we are planning on the problem, and dealing with it. Interest rates, tax rates, and personnel burden are based on conservative assumptions.
Some of the more important underlying assumptions are:
-
We assume a strong economy, without major recession.
-
We assume, of course, that there are no unforseen changes in technology to make our products and services immediately obsolete.
-
We assume that no laws will change to interfere with the real estate market as we see it now.
| General Assumptions | |||
| Year 1 | Year 2 | Year 3 | |
| Plan Month | 1 | 2 | 3 |
| Current Interest Rate | 10.00% | 10.00% | 10.00% |
| Long-term Interest Rate | 10.00% | 10.00% | 10.00% |
| Tax Rate | 25.42% | 25.00% | 25.42% |
| Other | 0 | 0 | 0 |
6.3 Break-even Analysis
The following chart and table summarize our Break-even Analysis. With fixed costs of $37,000 per month at the outset (a bare minimum), we need to bill $45,000 to cover our costs.

| Break-even Analysis | |
| Monthly Units Break-even | 114 |
| Monthly Revenue Break-even | $44,342 |
| Assumptions: | |
| Average Per-Unit Revenue | $389.71 |
| Average Per-Unit Variable Cost | $64.51 |
| Estimated Monthly Fixed Cost | $37,002 |
6.4 Projected Profit and Loss
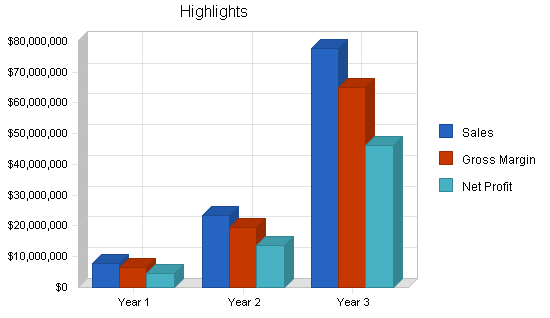
Our projected profit and loss is shown in the following chart and table, with sales increasing from $7.78 million the first year to more than $77 million in the third, and substantial profits even in the start-up phase of the business.

| Pro Forma Profit and Loss | |||
| Year 1 | Year 2 | Year 3 | |
| Sales | $7,781,000 | $23,343,000 | $77,810,000 |
| Direct Cost of Sales | $1,287,960 | $3,863,880 | $12,879,600 |
| Other Production Expenses | $0 | $0 | $0 |
| Total Cost of Sales | $1,287,960 | $3,863,880 | $12,879,600 |
| Gross Margin | $6,493,040 | $19,479,120 | $64,930,400 |
| Gross Margin % | 83.45% | 83.45% | 83.45% |
| Expenses | |||
| Payroll | $232,078 | $860,000 | $2,149,000 |
| Sales and Marketing and Other Expenses | $72,940 | $143,800 | $424,600 |
| Depreciation | $2,400 | $5,000 | $5,000 |
| Website | $55,000 | $100,000 | $100,000 |
| Utilities | $9,600 | $28,800 | $96,000 |
| Insurance | $1,200 | $2,400 | $7,200 |
| Rent | $36,000 | $50,300 | $51,200 |
| Payroll Taxes | $34,812 | $129,000 | $322,350 |
| Other | $0 | $0 | $0 |
| Total Operating Expenses | $444,030 | $1,319,300 | $3,155,350 |
| Profit Before Interest and Taxes | $6,049,010 | $18,159,820 | $61,775,050 |
| EBITDA | $6,051,410 | $18,164,820 | $61,780,050 |
| Interest Expense | $0 | $0 | $0 |
| Taxes Incurred | $1,514,143 | $4,539,955 | $15,701,159 |
| Net Profit | $4,534,868 | $13,619,865 | $46,073,891 |
| Net Profit/Sales | 58.28% | 58.35% | 59.21% |
6.5 Projected Cash Flow
The company’s projected cash flow analysis for FY2001-2003 is provided below.

| Pro Forma Cash Flow | |||
| Year 1 | Year 2 | Year 3 | |
| Cash Received | |||
| Cash from Operations | |||
| Cash Sales | $7,781,000 | $23,343,000 | $77,810,000 |
| Subtotal Cash from Operations | $7,781,000 | $23,343,000 | $77,810,000 |
| Additional Cash Received | |||
| Sales Tax, VAT, HST/GST Received | $0 | $0 | $0 |
| New Current Borrowing | $0 | $0 | $0 |
| New Other Liabilities (interest-free) | $0 | $0 | $0 |
| New Long-term Liabilities | $0 | $0 | $0 |
| Sales of Other Current Assets | $0 | $0 | $0 |
| Sales of Long-term Assets | $0 | $0 | $0 |
| New Investment Received | $0 | $0 | $0 |
| Subtotal Cash Received | $7,781,000 | $23,343,000 | $77,810,000 |
| Expenditures | Year 1 | Year 2 | Year 3 |
| Expenditures from Operations | |||
| Cash Spending | $232,078 | $860,000 | $2,149,000 |
| Bill Payments | $2,578,130 | $8,563,593 | $27,878,768 |
| Subtotal Spent on Operations | $2,810,208 | $9,423,593 | $30,027,768 |
| Additional Cash Spent | |||
| Sales Tax, VAT, HST/GST Paid Out | $0 | $0 | $0 |
| Principal Repayment of Current Borrowing | $0 | $0 | $0 |
| Other Liabilities Principal Repayment | $0 | $0 | $0 |
| Long-term Liabilities Principal Repayment | $0 | $0 | $0 |
| Purchase Other Current Assets | $0 | $0 | $0 |
| Purchase Long-term Assets | $100,000 | $120,000 | $130,000 |
| Dividends | $0 | $0 | $0 |
| Subtotal Cash Spent | $2,910,208 | $9,543,593 | $30,157,768 |
| Net Cash Flow | $4,870,792 | $13,799,407 | $47,652,232 |
| Cash Balance | $4,935,792 | $18,735,199 | $66,387,430 |
6.6 Projected Balance Sheet
The following table shows managed but sufficient growth of net worth, and a sufficiently healthy financial position.
| Pro Forma Balance Sheet | |||
| Year 1 | Year 2 | Year 3 | |
| Assets | |||
| Current Assets | |||
| Cash | $4,935,792 | $18,735,199 | $66,387,430 |
| Other Current Assets | $0 | $0 | $0 |
| Total Current Assets | $4,935,792 | $18,735,199 | $66,387,430 |
| Long-term Assets | |||
| Long-term Assets | $100,000 | $220,000 | $350,000 |
| Accumulated Depreciation | $2,400 | $7,400 | $12,400 |
| Total Long-term Assets | $97,600 | $212,600 | $337,600 |
| Total Assets | $5,033,392 | $18,947,799 | $66,725,030 |
| Liabilities and Capital | Year 1 | Year 2 | Year 3 |
| Current Liabilities | |||
| Accounts Payable | $433,524 | $728,066 | $2,431,406 |
| Current Borrowing | $0 | $0 | $0 |
| Other Current Liabilities | $0 | $0 | $0 |
| Subtotal Current Liabilities | $433,524 | $728,066 | $2,431,406 |
| Long-term Liabilities | $0 | $0 | $0 |
| Total Liabilities | $433,524 | $728,066 | $2,431,406 |
| Paid-in Capital | $125,050 | $125,050 | $125,050 |
| Retained Earnings | ($60,050) | $4,474,818 | $18,094,683 |
| Earnings | $4,534,868 | $13,619,865 | $46,073,891 |
| Total Capital | $4,599,868 | $18,219,733 | $64,293,624 |
| Total Liabilities and Capital | $5,033,392 | $18,947,799 | $66,725,030 |
| Net Worth | $4,599,868 | $18,219,733 | $64,293,624 |
6.7 Business Ratios
Business ratios for the years of this plan are shown below. Industry profile ratios based on the Standard Industrial Classification (SIC) code 6531, Real Estate Agents and Managers, are shown for comparison.
| Ratio Analysis | ||||
| Year 1 | Year 2 | Year 3 | Industry Profile | |
| Sales Growth | 0.00% | 200.00% | 233.33% | 3.60% |
| Percent of Total Assets | ||||
| Other Current Assets | 0.00% | 0.00% | 0.00% | 49.90% |
| Total Current Assets | 98.06% | 98.88% | 99.49% | 57.30% |
| Long-term Assets | 1.94% | 1.12% | 0.51% | 42.70% |
| Total Assets | 100.00% | 100.00% | 100.00% | 100.00% |
| Current Liabilities | 8.61% | 3.84% | 3.64% | 28.50% |
| Long-term Liabilities | 0.00% | 0.00% | 0.00% | 27.20% |
| Total Liabilities | 8.61% | 3.84% | 3.64% | 55.70% |
| Net Worth | 91.39% | 96.16% | 96.36% | 44.30% |
| Percent of Sales | ||||
| Sales | 100.00% | 100.00% | 100.00% | 100.00% |
| Gross Margin | 83.45% | 83.45% | 83.45% | 100.00% |
| Selling, General & Administrative Expenses | 25.14% | 25.10% | 23.90% | 67.40% |
| Advertising Expenses | 0.73% | 0.49% | 0.44% | 3.60% |
| Profit Before Interest and Taxes | 77.74% | 77.80% | 79.39% | 3.90% |
| Main Ratios | ||||
| Current | 11.39 | 25.73 | 27.30 | 1.87 |
| Quick | 11.39 | 25.73 | 27.30 | 1.11 |
| Total Debt to Total Assets | 8.61% | 3.84% | 3.64% | 55.70% |
| Pre-tax Return on Net Worth | 131.50% | 99.67% | 96.08% | 1.70% |
| Pre-tax Return on Assets | 120.18% | 95.84% | 92.58% | 3.80% |
| Additional Ratios | Year 1 | Year 2 | Year 3 | |
| Net Profit Margin | 58.28% | 58.35% | 59.21% | n.a |
| Return on Equity | 98.59% | 74.75% | 71.66% | n.a |
| Activity Ratios | ||||
| Accounts Payable Turnover | 6.95 | 12.17 | 12.17 | n.a |
| Payment Days | 27 | 24 | 19 | n.a |
| Total Asset Turnover | 1.55 | 1.23 | 1.17 | n.a |
| Debt Ratios | ||||
| Debt to Net Worth | 0.09 | 0.04 | 0.04 | n.a |
| Current Liab. to Liab. | 1.00 | 1.00 | 1.00 | n.a |
| Liquidity Ratios | ||||
| Net Working Capital | $4,502,268 | $18,007,133 | $63,956,024 | n.a |
| Interest Coverage | 0.00 | 0.00 | 0.00 | n.a |
| Additional Ratios | ||||
| Assets to Sales | 0.65 | 0.81 | 0.86 | n.a |
| Current Debt/Total Assets | 9% | 4% | 4% | n.a |
| Acid Test | 11.39 | 25.73 | 27.30 | n.a |
| Sales/Net Worth | 1.69 | 1.28 | 1.21 | n.a |
| Dividend Payout | 0.00 | 0.00 | 0.00 | n.a |
Business Controls
The following is a brief outlook into control issues pertaining to this new concept. Amerihall recognizes that many issues will present themselves that will need to be addressed from the outset. This is just a preliminary summary of the most obvious of situations. Our staff is ready and willing to make all appropriate changes as the needs arise.
7.1 Quality Control
We will be developing outlined scripts to help the sales staff manage inquiries. This will insure that all incoming phone calls are dealt with in the same way and meet a high standard.
-
We will encourage people inquiring about our real estate office to be familiar with basic software including the function of the typical duties in real estate.
- Their ability to access the Web using Windows 98 and Internet Explorer software.
- Negotiate the MLSNI website and perform basic listing tasks over the Internet.
- Have a working knowledge of all real estate form and contracts.
- Must be a licensed Realtor.
- All agents, upon initiation into the company, will receive a designation of Realest®. The designation will place our agents in a catagory of their own.
7.2 Capacity
We can accommodate an unlimited amount of realtors (Note: all realtors’ licenses must be displayed on a wall plaque in the office). Our office can accommodate up to 1,000 agents before our need for new facilities. The capacity is only limited by the amount of clerical staff needed to manage their accounts.
7.3 Long-term Goals
The financial objective is to be operating at, or close to, break-even cash flow within the first three months with steady growth over the next five years. We aim to be profitable from year one onward. Our goal is to earn at least $4 million post tax profit in year one and nearly $45 million in year three. Our profit margin on sales by year three will be a more than respectable figure over 55%.
The future goals, as far as the market is concerned, is 25% of the total market share. This is a conservative estimate and is based on need as well as competitive edge. The only possible effect an outside source may have on our future is if a competitor may be allowed to duplicate our process. A large emphasis must be put on establishing our patents and defending them upon completion.
The future is totally left up to our imaginations and knowing that the trillion dollar real estate market is open ended with the development of new technology.
7.4 Steps for Achieving Goals
Amerihall’s strategy for achieving our goals consists of seven major points:
- Establish an extensive public relations campaign.
- Develop a user-friendly website to promote relator services.
- Deliver superior sales through technology.
- Provide high quality customer service.
- Provide inexpensive answers for servicing the real estate industry through automation.
- Offer competitive pricing on all services.
- Realest® Designation.
The first step to achieving our goal is to hire experienced, service oriented personnel who will provide all manual duties that cannot be automated, directing state-of-the-art services through Internet access, and providing key services at reasonable prices.
7.5 Risks Associated with Growth
We see some risks associated with our expected growth:
- Our ability to handle our Web capacity.
- Loss of clientele by not being able to handle volume.
- Inability to supply services due to untried technology.
- The attention associated with fast expansion can lead to scrutiny by the licensing agencies of the government.
- The risk factor facing the expansion of Amerihall may ultimately be competition. In order to sustain our position in the area as the “Premiere Real Estate Service,” we will need to outperform all other companies by using technology creatively and supplying these services at a very low price to our agents.
Appendix
| Sales Forecast | |||||||||||||
| Month 1 | Month 2 | Month 3 | Month 4 | Month 5 | Month 6 | Month 7 | Month 8 | Month 9 | Month 10 | Month 11 | Month 12 | ||
| Unit Sales | |||||||||||||
| Established Realtors | 0% | 200 | 300 | 600 | 800 | 1,050 | 1,500 | 1,800 | 1,900 | 2,150 | 2,350 | 2,550 | 2,800 |
| New Realtors | 0% | 50 | 90 | 100 | 100 | 100 | 150 | 200 | 200 | 200 | 200 | 200 | 200 |
| Old Timers | 0% | 0 | 0 | 6 | 10 | 20 | 20 | 20 | 20 | 20 | 20 | 20 | 20 |
| Total Unit Sales | 250 | 390 | 706 | 910 | 1,170 | 1,670 | 2,020 | 2,120 | 2,370 | 2,570 | 2,770 | 3,020 | |
| Unit Prices | Month 1 | Month 2 | Month 3 | Month 4 | Month 5 | Month 6 | Month 7 | Month 8 | Month 9 | Month 10 | Month 11 | Month 12 | |
| Established Realtors | $400.00 | $400.00 | $400.00 | $400.00 | $400.00 | $400.00 | $400.00 | $400.00 | $400.00 | $400.00 | $400.00 | $400.00 | |
| New Realtors | $300.00 | $300.00 | $300.00 | $300.00 | $300.00 | $300.00 | $300.00 | $300.00 | $300.00 | $300.00 | $300.00 | $300.00 | |
| Old Timers | $250.00 | $250.00 | $250.00 | $250.00 | $250.00 | $250.00 | $250.00 | $250.00 | $250.00 | $250.00 | $250.00 | $250.00 | |
| Sales | |||||||||||||
| Established Realtors | $80,000 | $120,000 | $240,000 | $320,000 | $420,000 | $600,000 | $720,000 | $760,000 | $860,000 | $940,000 | $1,020,000 | $1,120,000 | |
| New Realtors | $15,000 | $27,000 | $30,000 | $30,000 | $30,000 | $45,000 | $60,000 | $60,000 | $60,000 | $60,000 | $60,000 | $60,000 | |
| Old Timers | $0 | $0 | $1,500 | $2,500 | $5,000 | $5,000 | $5,000 | $5,000 | $5,000 | $5,000 | $5,000 | $5,000 | |
| Total Sales | $95,000 | $147,000 | $271,500 | $352,500 | $455,000 | $650,000 | $785,000 | $825,000 | $925,000 | $1,005,000 | $1,085,000 | $1,185,000 | |
| Direct Unit Costs | Month 1 | Month 2 | Month 3 | Month 4 | Month 5 | Month 6 | Month 7 | Month 8 | Month 9 | Month 10 | Month 11 | Month 12 | |
| Established Realtors | 0.00% | $65.00 | $65.00 | $65.00 | $65.00 | $65.00 | $65.00 | $65.00 | $65.00 | $65.00 | $65.00 | $65.00 | $65.00 |
| New Realtors | 0.00% | $60.00 | $60.00 | $60.00 | $60.00 | $60.00 | $60.00 | $60.00 | $60.00 | $60.00 | $60.00 | $60.00 | $60.00 |
| Old Timers | 0.00% | $60.00 | $60.00 | $60.00 | $60.00 | $60.00 | $60.00 | $60.00 | $60.00 | $60.00 | $60.00 | $60.00 | $60.00 |
| Direct Cost of Sales | |||||||||||||
| Established Realtors | $13,000 | $19,500 | $39,000 | $52,000 | $68,250 | $97,500 | $117,000 | $123,500 | $139,750 | $152,750 | $165,750 | $182,000 | |
| New Realtors | $3,000 | $5,400 | $6,000 | $6,000 | $6,000 | $9,000 | $12,000 | $12,000 | $12,000 | $12,000 | $12,000 | $12,000 | |
| Old Timers | $0 | $0 | $360 | $600 | $1,200 | $1,200 | $1,200 | $1,200 | $1,200 | $1,200 | $1,200 | $1,200 | |
| Subtotal Direct Cost of Sales | $16,000 | $24,900 | $45,360 | $58,600 | $75,450 | $107,700 | $130,200 | $136,700 | $152,950 | $165,950 | $178,950 | $195,200 | |
| Personnel Plan | |||||||||||||
| Month 1 | Month 2 | Month 3 | Month 4 | Month 5 | Month 6 | Month 7 | Month 8 | Month 9 | Month 10 | Month 11 | Month 12 | ||
| Secretary Corporate | 0% | $2,000 | $2,000 | $2,000 | $2,000 | $2,000 | $2,000 | $2,000 | $2,000 | $2,000 | $2,000 | $2,000 | $2,000 |
| Director of Conventions/Sales | 0% | $0 | $0 | $0 | $0 | $0 | $0 | $0 | $0 | $0 | $3,750 | $3,750 | $3,750 |
| National Convention Staff | 0% | $0 | $0 | $0 | $0 | $0 | $0 | $0 | $0 | $0 | $2,500 | $5,000 | $5,000 |
| Online Help | 0% | $0 | $0 | $0 | $0 | $0 | $0 | $0 | $0 | $0 | $0 | $0 | $0 |
| Director of Realest® Relations | 0% | $5,409 | $5,417 | $5,417 | $5,417 | $5,417 | $5,417 | $5,417 | $5,417 | $5,417 | $5,417 | $5,417 | $5,417 |
| Clerical Secretary | 0% | $0 | $0 | $0 | $0 | $1,667 | $1,667 | $1,667 | $1,667 | $1,667 | $1,667 | $1,667 | $1,667 |
| Managing Director | 0% | $5,833 | $5,833 | $5,833 | $5,833 | $5,833 | $5,833 | $5,833 | $5,833 | $5,833 | $5,833 | $5,833 | $5,833 |
| Regional Sales Administrator | 0% | $0 | $0 | $0 | $0 | $0 | $0 | $0 | $0 | $0 | $0 | $0 | $0 |
| Managing Broker | 0% | $3,000 | $3,000 | $3,000 | $3,000 | $3,000 | $3,000 | $3,000 | $3,000 | $3,000 | $3,000 | $3,000 | $3,000 |
| Total People | 4 | 4 | 4 | 4 | 5 | 5 | 5 | 5 | 5 | 7 | 7 | 7 | |
| Total Payroll | $16,242 | $16,250 | $16,250 | $16,250 | $17,917 | $17,917 | $17,917 | $17,917 | $17,917 | $24,167 | $26,667 | $26,667 | |
| General Assumptions | |||||||||||||
| Month 1 | Month 2 | Month 3 | Month 4 | Month 5 | Month 6 | Month 7 | Month 8 | Month 9 | Month 10 | Month 11 | Month 12 | ||
| Plan Month | 1 | 2 | 3 | 4 | 5 | 6 | 7 | 8 | 9 | 10 | 11 | 12 | |
| Current Interest Rate | 10.00% | 10.00% | 10.00% | 10.00% | 10.00% | 10.00% | 10.00% | 10.00% | 10.00% | 10.00% | 10.00% | 10.00% | |
| Long-term Interest Rate | 10.00% | 10.00% | 10.00% | 10.00% | 10.00% | 10.00% | 10.00% | 10.00% | 10.00% | 10.00% | 10.00% | 10.00% | |
| Tax Rate | 30.00% | 25.00% | 25.00% | 25.00% | 25.00% | 25.00% | 25.00% | 25.00% | 25.00% | 25.00% | 25.00% | 25.00% | |
| Other | 0 | 0 | 0 | 0 | 0 | 0 | 0 | 0 | 0 | 0 | 0 | 0 | |
| Pro Forma Profit and Loss | |||||||||||||
| Month 1 | Month 2 | Month 3 | Month 4 | Month 5 | Month 6 | Month 7 | Month 8 | Month 9 | Month 10 | Month 11 | Month 12 | ||
| Sales | $95,000 | $147,000 | $271,500 | $352,500 | $455,000 | $650,000 | $785,000 | $825,000 | $925,000 | $1,005,000 | $1,085,000 | $1,185,000 | |
| Direct Cost of Sales | $16,000 | $24,900 | $45,360 | $58,600 | $75,450 | $107,700 | $130,200 | $136,700 | $152,950 | $165,950 | $178,950 | $195,200 | |
| Other Production Expenses | $0 | $0 | $0 | $0 | $0 | $0 | $0 | $0 | $0 | $0 | $0 | $0 | |
| Total Cost of Sales | $16,000 | $24,900 | $45,360 | $58,600 | $75,450 | $107,700 | $130,200 | $136,700 | $152,950 | $165,950 | $178,950 | $195,200 | |
| Gross Margin | $79,000 | $122,100 | $226,140 | $293,900 | $379,550 | $542,300 | $654,800 | $688,300 | $772,050 | $839,050 | $906,050 | $989,800 | |
| Gross Margin % | 83.16% | 83.06% | 83.29% | 83.38% | 83.42% | 83.43% | 83.41% | 83.43% | 83.46% | 83.49% | 83.51% | 83.53% | |
| Expenses | |||||||||||||
| Payroll | $16,242 | $16,250 | $16,250 | $16,250 | $17,917 | $17,917 | $17,917 | $17,917 | $17,917 | $24,167 | $26,667 | $26,667 | |
| Sales and Marketing and Other Expenses | $3,420 | $6,320 | $6,320 | $6,320 | $6,320 | $6,320 | $6,320 | $6,320 | $6,320 | $6,320 | $6,320 | $6,320 | |
| Depreciation | $200 | $200 | $200 | $200 | $200 | $200 | $200 | $200 | $200 | $200 | $200 | $200 | |
| Website | $15,000 | $15,000 | $2,500 | $2,500 | $2,500 | $2,500 | $2,500 | $2,500 | $2,500 | $2,500 | $2,500 | $2,500 | |
| Utilities | $800 | $800 | $800 | $800 | $800 | $800 | $800 | $800 | $800 | $800 | $800 | $800 | |
| Insurance | $100 | $100 | $100 | $100 | $100 | $100 | $100 | $100 | $100 | $100 | $100 | $100 | |
| Rent | $3,000 | $3,000 | $3,000 | $3,000 | $3,000 | $3,000 | $3,000 | $3,000 | $3,000 | $3,000 | $3,000 | $3,000 | |
| Payroll Taxes | 15% | $2,436 | $2,438 | $2,438 | $2,438 | $2,688 | $2,688 | $2,688 | $2,688 | $2,688 | $3,625 | $4,000 | $4,000 |
| Other | $0 | $0 | $0 | $0 | $0 | $0 | $0 | $0 | $0 | $0 | $0 | $0 | |
| Total Operating Expenses | $41,198 | $44,108 | $31,608 | $31,608 | $33,525 | $33,525 | $33,525 | $33,525 | $33,525 | $40,712 | $43,587 | $43,587 | |
| Profit Before Interest and Taxes | $37,802 | $77,993 | $194,533 | $262,293 | $346,025 | $508,775 | $621,275 | $654,775 | $738,525 | $798,338 | $862,463 | $946,213 | |
| EBITDA | $38,002 | $78,193 | $194,733 | $262,493 | $346,225 | $508,975 | $621,475 | $654,975 | $738,725 | $798,538 | $862,663 | $946,413 | |
| Interest Expense | $0 | $0 | $0 | $0 | $0 | $0 | $0 | $0 | $0 | $0 | $0 | $0 | |
| Taxes Incurred | $11,341 | $19,498 | $48,633 | $65,573 | $86,506 | $127,194 | $155,319 | $163,694 | $184,631 | $199,584 | $215,616 | $236,553 | |
| Net Profit | $26,461 | $58,494 | $145,899 | $196,719 | $259,519 | $381,582 | $465,957 | $491,082 | $553,894 | $598,753 | $646,847 | $709,660 | |
| Net Profit/Sales | 27.85% | 39.79% | 53.74% | 55.81% | 57.04% | 58.70% | 59.36% | 59.53% | 59.88% | 59.58% | 59.62% | 59.89% | |
| Pro Forma Cash Flow | |||||||||||||
| Month 1 | Month 2 | Month 3 | Month 4 | Month 5 | Month 6 | Month 7 | Month 8 | Month 9 | Month 10 | Month 11 | Month 12 | ||
| Cash Received | |||||||||||||
| Cash from Operations | |||||||||||||
| Cash Sales | $95,000 | $147,000 | $271,500 | $352,500 | $455,000 | $650,000 | $785,000 | $825,000 | $925,000 | $1,005,000 | $1,085,000 | $1,185,000 | |
| Subtotal Cash from Operations | $95,000 | $147,000 | $271,500 | $352,500 | $455,000 | $650,000 | $785,000 | $825,000 | $925,000 | $1,005,000 | $1,085,000 | $1,185,000 | |
| Additional Cash Received | |||||||||||||
| Sales Tax, VAT, HST/GST Received | 0.00% | $0 | $0 | $0 | $0 | $0 | $0 | $0 | $0 | $0 | $0 | $0 | $0 |
| New Current Borrowing | $0 | $0 | $0 | $0 | $0 | $0 | $0 | $0 | $0 | $0 | $0 | $0 | |
| New Other Liabilities (interest-free) | $0 | $0 | $0 | $0 | $0 | $0 | $0 | $0 | $0 | $0 | $0 | $0 | |
| New Long-term Liabilities | $0 | $0 | $0 | $0 | $0 | $0 | $0 | $0 | $0 | $0 | $0 | $0 | |
| Sales of Other Current Assets | $0 | $0 | $0 | $0 | $0 | $0 | $0 | $0 | $0 | $0 | $0 | $0 | |
| Sales of Long-term Assets | $0 | $0 | $0 | $0 | $0 | $0 | $0 | $0 | $0 | $0 | $0 | $0 | |
| New Investment Received | $0 | $0 | $0 | $0 | $0 | $0 | $0 | $0 | $0 | $0 | $0 | $0 | |
| Subtotal Cash Received | $95,000 | $147,000 | $271,500 | $352,500 | $455,000 | $650,000 | $785,000 | $825,000 | $925,000 | $1,005,000 | $1,085,000 | $1,185,000 | |
| Expenditures | Month 1 | Month 2 | Month 3 | Month 4 | Month 5 | Month 6 | Month 7 | Month 8 | Month 9 | Month 10 | Month 11 | Month 12 | |
| Expenditures from Operations | |||||||||||||
| Cash Spending | $16,242 | $16,250 | $16,250 | $16,250 | $17,917 | $17,917 | $17,917 | $17,917 | $17,917 | $24,167 | $26,667 | $26,667 | |
| Bill Payments | $1,737 | $52,762 | $73,292 | $110,157 | $140,598 | $179,795 | $251,989 | $301,422 | $317,041 | $353,952 | $382,860 | $412,525 | |
| Subtotal Spent on Operations | $17,979 | $69,012 | $89,542 | $126,407 | $158,515 | $197,712 | $269,906 | $319,339 | $334,958 | $378,119 | $409,527 | $439,192 | |
| Additional Cash Spent | |||||||||||||
| Sales Tax, VAT, HST/GST Paid Out | $0 | $0 | $0 | $0 | $0 | $0 | $0 | $0 | $0 | $0 | $0 | $0 | |
| Principal Repayment of Current Borrowing | $0 | $0 | $0 | $0 | $0 | $0 | $0 | $0 | $0 | $0 | $0 | $0 | |
| Other Liabilities Principal Repayment | $0 | $0 | $0 | $0 | $0 | $0 | $0 | $0 | $0 | $0 | $0 | $0 | |
| Long-term Liabilities Principal Repayment | $0 | $0 | $0 | $0 | $0 | $0 | $0 | $0 | $0 | $0 | $0 | $0 | |
| Purchase Other Current Assets | $0 | $0 | $0 | $0 | $0 | $0 | $0 | $0 | $0 | $0 | $0 | $0 | |
| Purchase Long-term Assets | $5,000 | $5,000 | $5,000 | $5,000 | $10,000 | $10,000 | $10,000 | $10,000 | $10,000 | $10,000 | $10,000 | $10,000 | |
| Dividends | $0 | $0 | $0 | $0 | $0 | $0 | $0 | $0 | $0 | $0 | $0 | $0 | |
| Subtotal Cash Spent | $22,979 | $74,012 | $94,542 | $131,407 | $168,515 | $207,712 | $279,906 | $329,339 | $344,958 | $388,119 | $419,527 | $449,192 | |
| Net Cash Flow | $72,021 | $72,988 | $176,958 | $221,093 | $286,485 | $442,288 | $505,094 | $495,661 | $580,042 | $616,881 | $665,473 | $735,808 | |
| Cash Balance | $137,021 | $210,009 | $386,967 | $608,061 | $894,545 | $1,336,833 | $1,841,927 | $2,337,588 | $2,917,630 | $3,534,511 | $4,199,984 | $4,935,792 | |
| Pro Forma Balance Sheet | |||||||||||||
| Month 1 | Month 2 | Month 3 | Month 4 | Month 5 | Month 6 | Month 7 | Month 8 | Month 9 | Month 10 | Month 11 | Month 12 | ||
| Assets | Starting Balances | ||||||||||||
| Current Assets | |||||||||||||
| Cash | $65,000 | $137,021 | $210,009 | $386,967 | $608,061 | $894,545 | $1,336,833 | $1,841,927 | $2,337,588 | $2,917,630 | $3,534,511 | $4,199,984 | $4,935,792 |
| Other Current Assets | $0 | $0 | $0 | $0 | $0 | $0 | $0 | $0 | $0 | $0 | $0 | $0 | $0 |
| Total Current Assets | $65,000 | $137,021 | $210,009 | $386,967 | $608,061 | $894,545 | $1,336,833 | $1,841,927 | $2,337,588 | $2,917,630 | $3,534,511 | $4,199,984 | $4,935,792 |
| Long-term Assets | |||||||||||||
| Long-term Assets | $0 | $5,000 | $10,000 | $15,000 | $20,000 | $30,000 | $40,000 | $50,000 | $60,000 | $70,000 | $80,000 | $90,000 | $100,000 |
| Accumulated Depreciation | $0 | $200 | $400 | $600 | $800 | $1,000 | $1,200 | $1,400 | $1,600 | $1,800 | $2,000 | $2,200 | $2,400 |
| Total Long-term Assets | $0 | $4,800 | $9,600 | $14,400 | $19,200 | $29,000 | $38,800 | $48,600 | $58,400 | $68,200 | $78,000 | $87,800 | $97,600 |
| Total Assets | $65,000 | $141,821 | $219,609 | $401,367 | $627,261 | $923,545 | $1,375,633 | $1,890,527 | $2,395,988 | $2,985,830 | $3,612,511 | $4,287,784 | $5,033,392 |
| Liabilities and Capital | Month 1 | Month 2 | Month 3 | Month 4 | Month 5 | Month 6 | Month 7 | Month 8 | Month 9 | Month 10 | Month 11 | Month 12 | |
| Current Liabilities | |||||||||||||
| Accounts Payable | $0 | $50,360 | $69,654 | $105,512 | $134,686 | $171,452 | $241,958 | $290,896 | $305,275 | $341,223 | $369,150 | $397,576 | $433,524 |
| Current Borrowing | $0 | $0 | $0 | $0 | $0 | $0 | $0 | $0 | $0 | $0 | $0 | $0 | $0 |
| Other Current Liabilities | $0 | $0 | $0 | $0 | $0 | $0 | $0 | $0 | $0 | $0 | $0 | $0 | $0 |
| Subtotal Current Liabilities | $0 | $50,360 | $69,654 | $105,512 | $134,686 | $171,452 | $241,958 | $290,896 | $305,275 | $341,223 | $369,150 | $397,576 | $433,524 |
| Long-term Liabilities | $0 | $0 | $0 | $0 | $0 | $0 | $0 | $0 | $0 | $0 | $0 | $0 | $0 |
| Total Liabilities | $0 | $50,360 | $69,654 | $105,512 | $134,686 | $171,452 | $241,958 | $290,896 | $305,275 | $341,223 | $369,150 | $397,576 | $433,524 |
| Paid-in Capital | $125,050 | $125,050 | $125,050 | $125,050 | $125,050 | $125,050 | $125,050 | $125,050 | $125,050 | $125,050 | $125,050 | $125,050 | $125,050 |
| Retained Earnings | ($60,050) | ($60,050) | ($60,050) | ($60,050) | ($60,050) | ($60,050) | ($60,050) | ($60,050) | ($60,050) | ($60,050) | ($60,050) | ($60,050) | ($60,050) |
| Earnings | $0 | $26,461 | $84,956 | $230,855 | $427,574 | $687,093 | $1,068,675 | $1,534,632 | $2,025,713 | $2,579,607 | $3,178,361 | $3,825,208 | $4,534,868 |
| Total Capital | $65,000 | $91,461 | $149,956 | $295,855 | $492,574 | $752,093 | $1,133,675 | $1,599,632 | $2,090,713 | $2,644,607 | $3,243,361 | $3,890,208 | $4,599,868 |
| Total Liabilities and Capital | $65,000 | $141,821 | $219,609 | $401,367 | $627,261 | $923,545 | $1,375,633 | $1,890,527 | $2,395,988 | $2,985,830 | $3,612,511 | $4,287,784 | $5,033,392 |
| Net Worth | $65,000 | $91,461 | $149,956 | $295,855 | $492,574 | $752,093 | $1,133,675 | $1,599,632 | $2,090,713 | $2,644,607 | $3,243,361 | $3,890,208 | $4,599,868 |


