
Reed Properties
Executive Summary
While many people hope one day to purchase their own home, cultural barriers and shortages in affordable housing are just two of the issues that can prevent these dreams from materializing. Reed Properties is working to keep these dreams alive. This new real estate brokerage will not only define success by the number of units closed and sales volume but also by whether people were helped in the process.
Claudia Reed, owner of Reed Properties, is a professional with over 15 years experience in the Richmond Metro area.
A recent Census Bureau report on the economic status of the nation’s minority groups should noted that all segments surveyed–African American, Hispanic, and Asian-Pacific–registered significant growth in average family income during the past two years. In addition, Fannie Mae, the secondary market mortgage giant, reports that the number of immigrant homeowners, which grew 47 percent between 1980 and 1995, is expected to grow another 45 percent to 6.8 million people over the next ten years. A recent Fannie Mae survey found that immigrants who rent are three times more likely than all other adult renters to consider home buying their # 1 priority. On the whole, immigrants are more likely than any other adult demographic group to buy a home in the next three years.
In Richmond, the Latino community has grown tremendously, but have not been targeted by the city’s real estate professionals. Latino immigrants from 25 to 34 years old made up 27% of new entrants to Richmond’s housing market two years ago. Targeting Latino home buyers is good business. Latinos are expected to make up half of the metro population in 20 years–making them the fastest-growing segment of the city’s housing market.
As the Richmond Metro section revives, Reed Properties will be a major player serving this emerging group of homeowners.
Claudia Reed will offer educational programs, credit repair initiatives and HUD counseling. In addition, she will also host her own radio talk show, “Your New Home,” which focuses on promoting affordable housing.
Currently, there are three low-income housing renovation projects underway in Richmond with a combined total of 1,500 units that will be sold as affordable housing. Claudia was instrumental in helping community organizations in winning the ten million dollar grant for the renovation projects.
1.1 Objectives
- Open the door of home ownership to residents of the Richmond Metro area.
- Build a business that demonstrates that a real estate brokerage can thrive serving the residents of the intercity.
- Capture a significant market share of the new business being generated by the current and future renovation and building projects.
1.2 Mission
The mission of Reed Properties is to increase minority homeownership in the Richmond Metro area.
Company Summary
Reed properties is a single-agent real estate brokerage that will serve the Richmond Metro area.
2.1 Company Ownership
Reed Properties is owned by Claudia Reed.
2.2 Start-up Summary
The start-up costs are outlined in the following chart. Start-up costs derive from office equipment, computer station complete with software, stationery, legal costs, furnishings, office advertising and services, and expenses associated with opening our office. The start-up costs are to be financed by direct owner investment. The assumptions are shown in the following table and chart. Lease office space averages $1.10-1.60 per square foot to equal an approximate of $1,500 per month, plus utilities, for efficient leased office space. Commercial lease will be for a three to five year agreement with the first month and a security deposit equal to the monthly lease rate payable at the time of lease start date.

| Start-up Funding | |
| Start-up Expenses to Fund | $15,050 |
| Start-up Assets to Fund | $9,950 |
| Total Funding Required | $25,000 |
| Assets | |
| Non-cash Assets from Start-up | $0 |
| Cash Requirements from Start-up | $9,950 |
| Additional Cash Raised | $0 |
| Cash Balance on Starting Date | $9,950 |
| Total Assets | $9,950 |
| Liabilities and Capital | |
| Liabilities | |
| Current Borrowing | $0 |
| Long-term Liabilities | $0 |
| Accounts Payable (Outstanding Bills) | $0 |
| Other Current Liabilities (interest-free) | $0 |
| Total Liabilities | $0 |
| Capital | |
| Planned Investment | |
| Claudia Reed | $25,000 |
| Investor 2 | $0 |
| Other | $0 |
| Additional Investment Requirement | $0 |
| Total Planned Investment | $25,000 |
| Loss at Start-up (Start-up Expenses) | ($15,050) |
| Total Capital | $9,950 |
| Total Capital and Liabilities | $9,950 |
| Total Funding | $25,000 |
| Start-up | |
| Requirements | |
| Start-up Expenses | |
| Legal | $900 |
| Stationery etc. | $500 |
| Brochures | $1,000 |
| Advertising | $2,500 |
| Insurance | $200 |
| Rent | $3,000 |
| Answering Service | $200 |
| Utilities Start Up | $250 |
| Office Furnishings | $1,000 |
| Expensed Equipment | $3,000 |
| Business Software | $2,000 |
| Office Supplies | $500 |
| Other | $0 |
| Total Start-up Expenses | $15,050 |
| Start-up Assets | |
| Cash Required | $9,950 |
| Other Current Assets | $0 |
| Long-term Assets | $0 |
| Total Assets | $9,950 |
| Total Requirements | $25,000 |
2.3 Company Locations and Facilities
Reed Properties will be located downtown in the new Richmond Bank Building.
Services
Reed Properties will break through the barriers that impede homeownership for those who wish to realize the American Dream. Reed Properties will launch several programs to help residents purchase the homes, working with the community, residents, local banks and contractors to get special financing and prices on all the necessary home buying services. Claudia will work with residents to find special financing for these first-time home buyers.
Market Analysis Summary
It is estimated that the Richmond Metro area will need 10,000 units of affordable housing in the next seven years. Currently, there are three renovation projects that represent 1,500 new housing units. Next year, two new construction projects will be completed offering another 1,000 units of affordable housing. Another 1,000 unit project, to be located in the Garden Meadows section downtown, is currently in the planning stages.
This is part of a larger urban development program to attract businesses and money back into the city center. By focusing on the first-time inner-city home buyer, Reed Properties can become an important partner in the revitalization of the Metro area.
4.1 Target Market Segment Strategy
Reed Properties cannot survive waiting for customers to come in. Instead, Claudia must focus on targeted segments as the key to its future.
Claudia will offer educational programs, credit repair initiatives and HUD counseling. In addition, she will also host her own radio talk show, “Your New Home,” which focuses on promoting affordable housing.
Strategy and Implementation Summary
Reed Properties will focus on the first-time home buyers who live in the Richmond Metro area.
5.1 Competitive Edge
Reed Properties’ competitive edge is Claudia who will be the most visible realtor to first-time home buyers in the Richmond Metro area. Claudia will have a weekly radio program and lecture weekly to the area’s numerous neighborhood councils and civic groups.
Most importantly, Claudia has contacts in the local civic groups that are driving the redevelopment of the Richmond Metro area. Referrals from these contacts alone will create all the leads Claudia needs to succeed.
5.2 Marketing Strategy
Traditional marketing techniques will not work with the residents of the Richmond Metro area. Cultural and language barriers create suspicions of a home-buying process that is confusing and inaccessible. Building relationships with the community is a crucial first step in reducing anxiety in the home-buying process. Reed Properties will build relationships that will lead to referrals and business success.
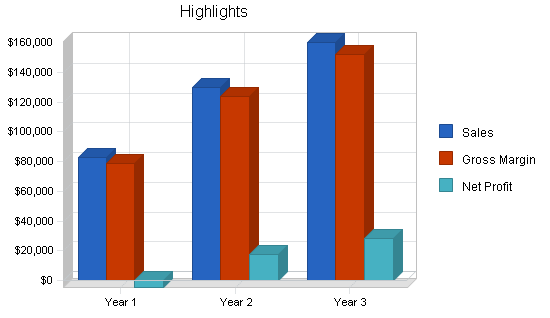
5.3 Sales Forecast
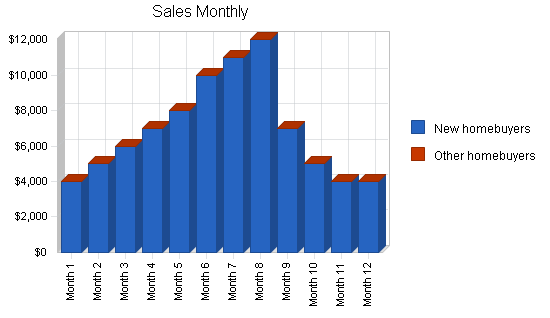
The following table and chart give a run-down on forecasted sales. We expect sales to build between January-March with the most growth during the months of March through August. We expect sales to drop off from September till the end of the year.

| Sales Forecast | |||
| Year 1 | Year 2 | Year 3 | |
| Sales | |||
| New homebuyers | $83,000 | $90,000 | $100,000 |
| Other homebuyers | $0 | $40,000 | $60,000 |
| Total Sales | $83,000 | $130,000 | $160,000 |
| Direct Cost of Sales | Year 1 | Year 2 | Year 3 |
| New homebuyers | $4,150 | $4,500 | $5,000 |
| Other homebuyers | $0 | $2,000 | $3,000 |
| Subtotal Direct Cost of Sales | $4,150 | $6,500 | $8,000 |
Personnel Plan
Claudia Reed is the sole employee of Reed Properties.
| Personnel Plan | |||
| Year 1 | Year 2 | Year 3 | |
| Claudia Reed | $48,000 | $50,000 | $55,000 |
| Part Time Admin | $0 | $10,000 | $14,000 |
| Total People | 1 | 1 | 1 |
| Total Payroll | $48,000 | $60,000 | $69,000 |
Financial Plan
-
Reed Properties wants to finance growth mainly through cash flow.
-
The most important factor is closing sales days. These dates will be determined ultimately by the seller and the buyer and a move out/move in schedule will be complied with.
7.1 Important Assumptions
The financial plan depends on important assumptions, most of which are shown in the following table as annual assumptions. The monthly assumptions are included in the appendix. From the beginning, we recognize that collection days are critical, but not a factor we can influence easily. Interest rates, tax rates, and personnel burden are based on conservative assumptions. Some of the more important underlying assumptions are:
-
We assume a strong economy, without major recession.
-
We assume that there are no unforeseen changes in the economy that would change our estimations.
| General Assumptions | |||
| Year 1 | Year 2 | Year 3 | |
| Plan Month | 1 | 2 | 3 |
| Current Interest Rate | 10.00% | 10.00% | 10.00% |
| Long-term Interest Rate | 10.00% | 10.00% | 10.00% |
| Tax Rate | 30.00% | 30.00% | 30.00% |
| Other | 0 | 0 | 0 |
7.2 Break-even Analysis
The following table and chart will summarize our break-even analysis.

| Break-even Analysis | |
| Monthly Revenue Break-even | $7,316 |
| Assumptions: | |
| Average Percent Variable Cost | 5% |
| Estimated Monthly Fixed Cost | $6,950 |
7.3 Projected Profit and Loss
The projected three year profit and loss is shown on the following table and chart.

| Pro Forma Profit and Loss | |||
| Year 1 | Year 2 | Year 3 | |
| Sales | $83,000 | $130,000 | $160,000 |
| Direct Cost of Sales | $4,150 | $6,500 | $8,000 |
| Other Production Expenses | $0 | $0 | $0 |
| Total Cost of Sales | $4,150 | $6,500 | $8,000 |
| Gross Margin | $78,850 | $123,500 | $152,000 |
| Gross Margin % | 95.00% | 95.00% | 95.00% |
| Expenses | |||
| Payroll | $48,000 | $60,000 | $69,000 |
| Sales and Marketing and Other Expenses | $6,900 | $8,100 | $11,300 |
| Depreciation | $0 | $0 | $0 |
| Leased Equipment | $0 | $0 | $0 |
| Utilities | $3,000 | $3,000 | $3,000 |
| Insurance | $300 | $300 | $300 |
| Rent | $18,000 | $18,000 | $18,000 |
| Payroll Taxes | $7,200 | $9,000 | $10,350 |
| Other | $0 | $0 | $0 |
| Total Operating Expenses | $83,400 | $98,400 | $111,950 |
| Profit Before Interest and Taxes | ($4,550) | $25,100 | $40,050 |
| EBITDA | ($4,550) | $25,100 | $40,050 |
| Interest Expense | $0 | $0 | $0 |
| Taxes Incurred | $0 | $7,530 | $12,015 |
| Net Profit | ($4,550) | $17,570 | $28,035 |
| Net Profit/Sales | -5.48% | 13.52% | 17.52% |
7.4 Projected Cash Flow
The following table and chart highlights projected cash flow for three years.

| Pro Forma Cash Flow | |||
| Year 1 | Year 2 | Year 3 | |
| Cash Received | |||
| Cash from Operations | |||
| Cash Sales | $20,750 | $32,500 | $40,000 |
| Cash from Receivables | $56,350 | $94,159 | $117,867 |
| Subtotal Cash from Operations | $77,100 | $126,659 | $157,867 |
| Additional Cash Received | |||
| Sales Tax, VAT, HST/GST Received | $0 | $0 | $0 |
| New Current Borrowing | $0 | $0 | $0 |
| New Other Liabilities (interest-free) | $0 | $0 | $0 |
| New Long-term Liabilities | $0 | $0 | $0 |
| Sales of Other Current Assets | $0 | $0 | $0 |
| Sales of Long-term Assets | $0 | $0 | $0 |
| New Investment Received | $6,000 | $0 | $0 |
| Subtotal Cash Received | $83,100 | $126,659 | $157,867 |
| Expenditures | Year 1 | Year 2 | Year 3 |
| Expenditures from Operations | |||
| Cash Spending | $48,000 | $60,000 | $69,000 |
| Bill Payments | $36,529 | $51,142 | $62,099 |
| Subtotal Spent on Operations | $84,529 | $111,142 | $131,099 |
| Additional Cash Spent | |||
| Sales Tax, VAT, HST/GST Paid Out | $0 | $0 | $0 |
| Principal Repayment of Current Borrowing | $0 | $0 | $0 |
| Other Liabilities Principal Repayment | $0 | $0 | $0 |
| Long-term Liabilities Principal Repayment | $0 | $0 | $0 |
| Purchase Other Current Assets | $0 | $0 | $0 |
| Purchase Long-term Assets | $0 | $0 | $0 |
| Dividends | $0 | $0 | $0 |
| Subtotal Cash Spent | $84,529 | $111,142 | $131,099 |
| Net Cash Flow | ($1,429) | $15,518 | $26,768 |
| Cash Balance | $8,521 | $24,038 | $50,807 |
7.5 Projected Balance Sheet
The following table is the projected balance sheet for three years.
| Pro Forma Balance Sheet | |||
| Year 1 | Year 2 | Year 3 | |
| Assets | |||
| Current Assets | |||
| Cash | $8,521 | $24,038 | $50,807 |
| Accounts Receivable | $5,900 | $9,241 | $11,373 |
| Other Current Assets | $0 | $0 | $0 |
| Total Current Assets | $14,421 | $33,279 | $62,180 |
| Long-term Assets | |||
| Long-term Assets | $0 | $0 | $0 |
| Accumulated Depreciation | $0 | $0 | $0 |
| Total Long-term Assets | $0 | $0 | $0 |
| Total Assets | $14,421 | $33,279 | $62,180 |
| Liabilities and Capital | Year 1 | Year 2 | Year 3 |
| Current Liabilities | |||
| Accounts Payable | $3,021 | $4,309 | $5,175 |
| Current Borrowing | $0 | $0 | $0 |
| Other Current Liabilities | $0 | $0 | $0 |
| Subtotal Current Liabilities | $3,021 | $4,309 | $5,175 |
| Long-term Liabilities | $0 | $0 | $0 |
| Total Liabilities | $3,021 | $4,309 | $5,175 |
| Paid-in Capital | $31,000 | $31,000 | $31,000 |
| Retained Earnings | ($15,050) | ($19,600) | ($2,030) |
| Earnings | ($4,550) | $17,570 | $28,035 |
| Total Capital | $11,400 | $28,970 | $57,005 |
| Total Liabilities and Capital | $14,421 | $33,279 | $62,180 |
| Net Worth | $11,400 | $28,970 | $57,005 |
7.6 Business Ratios
The following table provides important ratios for the real estate industry, as determined by the Standard Industry Classification (SIC) Index, 6531, Real Estate Agent and Managers.
| Ratio Analysis | ||||
| Year 1 | Year 2 | Year 3 | Industry Profile | |
| Sales Growth | 0.00% | 56.63% | 23.08% | 3.60% |
| Percent of Total Assets | ||||
| Accounts Receivable | 40.91% | 27.77% | 18.29% | 6.90% |
| Other Current Assets | 0.00% | 0.00% | 0.00% | 49.90% |
| Total Current Assets | 100.00% | 100.00% | 100.00% | 57.30% |
| Long-term Assets | 0.00% | 0.00% | 0.00% | 42.70% |
| Total Assets | 100.00% | 100.00% | 100.00% | 100.00% |
| Current Liabilities | 20.95% | 12.95% | 8.32% | 28.50% |
| Long-term Liabilities | 0.00% | 0.00% | 0.00% | 27.20% |
| Total Liabilities | 20.95% | 12.95% | 8.32% | 55.70% |
| Net Worth | 79.05% | 87.05% | 91.68% | 44.30% |
| Percent of Sales | ||||
| Sales | 100.00% | 100.00% | 100.00% | 100.00% |
| Gross Margin | 95.00% | 95.00% | 95.00% | 100.00% |
| Selling, General & Administrative Expenses | 100.48% | 81.48% | 77.48% | 67.40% |
| Advertising Expenses | 7.23% | 5.38% | 6.25% | 3.60% |
| Profit Before Interest and Taxes | -5.48% | 19.31% | 25.03% | 3.90% |
| Main Ratios | ||||
| Current | 4.77 | 7.72 | 12.02 | 1.87 |
| Quick | 4.77 | 7.72 | 12.02 | 1.11 |
| Total Debt to Total Assets | 20.95% | 12.95% | 8.32% | 55.70% |
| Pre-tax Return on Net Worth | -39.91% | 86.64% | 70.26% | 1.70% |
| Pre-tax Return on Assets | -31.55% | 75.42% | 64.41% | 3.80% |
| Additional Ratios | Year 1 | Year 2 | Year 3 | |
| Net Profit Margin | -5.48% | 13.52% | 17.52% | n.a |
| Return on Equity | -39.91% | 60.65% | 49.18% | n.a |
| Activity Ratios | ||||
| Accounts Receivable Turnover | 10.55 | 10.55 | 10.55 | n.a |
| Collection Days | 58 | 28 | 31 | n.a |
| Accounts Payable Turnover | 13.09 | 12.17 | 12.17 | n.a |
| Payment Days | 27 | 26 | 27 | n.a |
| Total Asset Turnover | 5.76 | 3.91 | 2.57 | n.a |
| Debt Ratios | ||||
| Debt to Net Worth | 0.26 | 0.15 | 0.09 | n.a |
| Current Liab. to Liab. | 1.00 | 1.00 | 1.00 | n.a |
| Liquidity Ratios | ||||
| Net Working Capital | $11,400 | $28,970 | $57,005 | n.a |
| Interest Coverage | 0.00 | 0.00 | 0.00 | n.a |
| Additional Ratios | ||||
| Assets to Sales | 0.17 | 0.26 | 0.39 | n.a |
| Current Debt/Total Assets | 21% | 13% | 8% | n.a |
| Acid Test | 2.82 | 5.58 | 9.82 | n.a |
| Sales/Net Worth | 7.28 | 4.49 | 2.81 | n.a |
| Dividend Payout | 0.00 | 0.00 | 0.00 | n.a |
Appendix
| Sales Forecast | |||||||||||||
| Month 1 | Month 2 | Month 3 | Month 4 | Month 5 | Month 6 | Month 7 | Month 8 | Month 9 | Month 10 | Month 11 | Month 12 | ||
| Sales | |||||||||||||
| New homebuyers | 0% | $4,000 | $5,000 | $6,000 | $7,000 | $8,000 | $10,000 | $11,000 | $12,000 | $7,000 | $5,000 | $4,000 | $4,000 |
| Other homebuyers | 0% | $0 | $0 | $0 | $0 | $0 | $0 | $0 | $0 | $0 | $0 | $0 | $0 |
| Total Sales | $4,000 | $5,000 | $6,000 | $7,000 | $8,000 | $10,000 | $11,000 | $12,000 | $7,000 | $5,000 | $4,000 | $4,000 | |
| Direct Cost of Sales | Month 1 | Month 2 | Month 3 | Month 4 | Month 5 | Month 6 | Month 7 | Month 8 | Month 9 | Month 10 | Month 11 | Month 12 | |
| New homebuyers | $200 | $250 | $300 | $350 | $400 | $500 | $550 | $600 | $350 | $250 | $200 | $200 | |
| Other homebuyers | $0 | $0 | $0 | $0 | $0 | $0 | $0 | $0 | $0 | $0 | $0 | $0 | |
| Subtotal Direct Cost of Sales | $200 | $250 | $300 | $350 | $400 | $500 | $550 | $600 | $350 | $250 | $200 | $200 | |
| Personnel Plan | |||||||||||||
| Month 1 | Month 2 | Month 3 | Month 4 | Month 5 | Month 6 | Month 7 | Month 8 | Month 9 | Month 10 | Month 11 | Month 12 | ||
| Claudia Reed | 0% | $4,000 | $4,000 | $4,000 | $4,000 | $4,000 | $4,000 | $4,000 | $4,000 | $4,000 | $4,000 | $4,000 | $4,000 |
| Part Time Admin | 0% | $0 | $0 | $0 | $0 | $0 | $0 | $0 | $0 | $0 | $0 | $0 | $0 |
| Total People | 1 | 1 | 1 | 1 | 1 | 1 | 1 | 1 | 1 | 1 | 1 | 1 | |
| Total Payroll | $4,000 | $4,000 | $4,000 | $4,000 | $4,000 | $4,000 | $4,000 | $4,000 | $4,000 | $4,000 | $4,000 | $4,000 | |
| General Assumptions | |||||||||||||
| Month 1 | Month 2 | Month 3 | Month 4 | Month 5 | Month 6 | Month 7 | Month 8 | Month 9 | Month 10 | Month 11 | Month 12 | ||
| Plan Month | 1 | 2 | 3 | 4 | 5 | 6 | 7 | 8 | 9 | 10 | 11 | 12 | |
| Current Interest Rate | 10.00% | 10.00% | 10.00% | 10.00% | 10.00% | 10.00% | 10.00% | 10.00% | 10.00% | 10.00% | 10.00% | 10.00% | |
| Long-term Interest Rate | 10.00% | 10.00% | 10.00% | 10.00% | 10.00% | 10.00% | 10.00% | 10.00% | 10.00% | 10.00% | 10.00% | 10.00% | |
| Tax Rate | 30.00% | 30.00% | 30.00% | 30.00% | 30.00% | 30.00% | 30.00% | 30.00% | 30.00% | 30.00% | 30.00% | 30.00% | |
| Other | 0 | 0 | 0 | 0 | 0 | 0 | 0 | 0 | 0 | 0 | 0 | 0 | |
| Pro Forma Profit and Loss | |||||||||||||
| Month 1 | Month 2 | Month 3 | Month 4 | Month 5 | Month 6 | Month 7 | Month 8 | Month 9 | Month 10 | Month 11 | Month 12 | ||
| Sales | $4,000 | $5,000 | $6,000 | $7,000 | $8,000 | $10,000 | $11,000 | $12,000 | $7,000 | $5,000 | $4,000 | $4,000 | |
| Direct Cost of Sales | $200 | $250 | $300 | $350 | $400 | $500 | $550 | $600 | $350 | $250 | $200 | $200 | |
| Other Production Expenses | $0 | $0 | $0 | $0 | $0 | $0 | $0 | $0 | $0 | $0 | $0 | $0 | |
| Total Cost of Sales | $200 | $250 | $300 | $350 | $400 | $500 | $550 | $600 | $350 | $250 | $200 | $200 | |
| Gross Margin | $3,800 | $4,750 | $5,700 | $6,650 | $7,600 | $9,500 | $10,450 | $11,400 | $6,650 | $4,750 | $3,800 | $3,800 | |
| Gross Margin % | 95.00% | 95.00% | 95.00% | 95.00% | 95.00% | 95.00% | 95.00% | 95.00% | 95.00% | 95.00% | 95.00% | 95.00% | |
| Expenses | |||||||||||||
| Payroll | $4,000 | $4,000 | $4,000 | $4,000 | $4,000 | $4,000 | $4,000 | $4,000 | $4,000 | $4,000 | $4,000 | $4,000 | |
| Sales and Marketing and Other Expenses | $575 | $575 | $575 | $575 | $575 | $575 | $575 | $575 | $575 | $575 | $575 | $575 | |
| Depreciation | $0 | $0 | $0 | $0 | $0 | $0 | $0 | $0 | $0 | $0 | $0 | $0 | |
| Leased Equipment | $0 | $0 | $0 | $0 | $0 | $0 | $0 | $0 | $0 | $0 | $0 | $0 | |
| Utilities | $250 | $250 | $250 | $250 | $250 | $250 | $250 | $250 | $250 | $250 | $250 | $250 | |
| Insurance | $300 | $0 | $0 | $0 | $0 | $0 | $0 | $0 | $0 | $0 | $0 | $0 | |
| Rent | $1,500 | $1,500 | $1,500 | $1,500 | $1,500 | $1,500 | $1,500 | $1,500 | $1,500 | $1,500 | $1,500 | $1,500 | |
| Payroll Taxes | 15% | $600 | $600 | $600 | $600 | $600 | $600 | $600 | $600 | $600 | $600 | $600 | $600 |
| Other | $0 | $0 | $0 | $0 | $0 | $0 | $0 | $0 | $0 | $0 | $0 | $0 | |
| Total Operating Expenses | $7,225 | $6,925 | $6,925 | $6,925 | $6,925 | $6,925 | $6,925 | $6,925 | $6,925 | $6,925 | $6,925 | $6,925 | |
| Profit Before Interest and Taxes | ($3,425) | ($2,175) | ($1,225) | ($275) | $675 | $2,575 | $3,525 | $4,475 | ($275) | ($2,175) | ($3,125) | ($3,125) | |
| EBITDA | ($3,425) | ($2,175) | ($1,225) | ($275) | $675 | $2,575 | $3,525 | $4,475 | ($275) | ($2,175) | ($3,125) | ($3,125) | |
| Interest Expense | $0 | $0 | $0 | $0 | $0 | $0 | $0 | $0 | $0 | $0 | $0 | $0 | |
| Taxes Incurred | $0 | $0 | $0 | $0 | $0 | $0 | $0 | $0 | $0 | $0 | $0 | $0 | |
| Net Profit | ($3,425) | ($2,175) | ($1,225) | ($275) | $675 | $2,575 | $3,525 | $4,475 | ($275) | ($2,175) | ($3,125) | ($3,125) | |
| Net Profit/Sales | -85.63% | -43.50% | -20.42% | -3.93% | 8.44% | 25.75% | 32.05% | 37.29% | -3.93% | -43.50% | -78.13% | -78.13% | |
| Pro Forma Cash Flow | |||||||||||||
| Month 1 | Month 2 | Month 3 | Month 4 | Month 5 | Month 6 | Month 7 | Month 8 | Month 9 | Month 10 | Month 11 | Month 12 | ||
| Cash Received | |||||||||||||
| Cash from Operations | |||||||||||||
| Cash Sales | $1,000 | $1,250 | $1,500 | $1,750 | $2,000 | $2,500 | $2,750 | $3,000 | $1,750 | $1,250 | $1,000 | $1,000 | |
| Cash from Receivables | $0 | $100 | $3,025 | $3,775 | $4,525 | $5,275 | $6,050 | $7,525 | $8,275 | $8,875 | $5,200 | $3,725 | |
| Subtotal Cash from Operations | $1,000 | $1,350 | $4,525 | $5,525 | $6,525 | $7,775 | $8,800 | $10,525 | $10,025 | $10,125 | $6,200 | $4,725 | |
| Additional Cash Received | |||||||||||||
| Sales Tax, VAT, HST/GST Received | 0.00% | $0 | $0 | $0 | $0 | $0 | $0 | $0 | $0 | $0 | $0 | $0 | $0 |
| New Current Borrowing | $0 | $0 | $0 | $0 | $0 | $0 | $0 | $0 | $0 | $0 | $0 | $0 | |
| New Other Liabilities (interest-free) | $0 | $0 | $0 | $0 | $0 | $0 | $0 | $0 | $0 | $0 | $0 | $0 | |
| New Long-term Liabilities | $0 | $0 | $0 | $0 | $0 | $0 | $0 | $0 | $0 | $0 | $0 | $0 | |
| Sales of Other Current Assets | $0 | $0 | $0 | $0 | $0 | $0 | $0 | $0 | $0 | $0 | $0 | $0 | |
| Sales of Long-term Assets | $0 | $0 | $0 | $0 | $0 | $0 | $0 | $0 | $0 | $0 | $0 | $0 | |
| New Investment Received | $0 | $0 | $6,000 | $0 | $0 | $0 | $0 | $0 | $0 | $0 | $0 | $0 | |
| Subtotal Cash Received | $1,000 | $1,350 | $10,525 | $5,525 | $6,525 | $7,775 | $8,800 | $10,525 | $10,025 | $10,125 | $6,200 | $4,725 | |
| Expenditures | Month 1 | Month 2 | Month 3 | Month 4 | Month 5 | Month 6 | Month 7 | Month 8 | Month 9 | Month 10 | Month 11 | Month 12 | |
| Expenditures from Operations | |||||||||||||
| Cash Spending | $4,000 | $4,000 | $4,000 | $4,000 | $4,000 | $4,000 | $4,000 | $4,000 | $4,000 | $4,000 | $4,000 | $4,000 | |
| Bill Payments | $114 | $3,417 | $3,177 | $3,227 | $3,277 | $3,328 | $3,427 | $3,477 | $3,517 | $3,272 | $3,173 | $3,125 | |
| Subtotal Spent on Operations | $4,114 | $7,417 | $7,177 | $7,227 | $7,277 | $7,328 | $7,427 | $7,477 | $7,517 | $7,272 | $7,173 | $7,125 | |
| Additional Cash Spent | |||||||||||||
| Sales Tax, VAT, HST/GST Paid Out | $0 | $0 | $0 | $0 | $0 | $0 | $0 | $0 | $0 | $0 | $0 | $0 | |
| Principal Repayment of Current Borrowing | $0 | $0 | $0 | $0 | $0 | $0 | $0 | $0 | $0 | $0 | $0 | $0 | |
| Other Liabilities Principal Repayment | $0 | $0 | $0 | $0 | $0 | $0 | $0 | $0 | $0 | $0 | $0 | $0 | |
| Long-term Liabilities Principal Repayment | $0 | $0 | $0 | $0 | $0 | $0 | $0 | $0 | $0 | $0 | $0 | $0 | |
| Purchase Other Current Assets | $0 | $0 | $0 | $0 | $0 | $0 | $0 | $0 | $0 | $0 | $0 | $0 | |
| Purchase Long-term Assets | $0 | $0 | $0 | $0 | $0 | $0 | $0 | $0 | $0 | $0 | $0 | $0 | |
| Dividends | $0 | $0 | $0 | $0 | $0 | $0 | $0 | $0 | $0 | $0 | $0 | $0 | |
| Subtotal Cash Spent | $4,114 | $7,417 | $7,177 | $7,227 | $7,277 | $7,328 | $7,427 | $7,477 | $7,517 | $7,272 | $7,173 | $7,125 | |
| Net Cash Flow | ($3,114) | ($6,067) | $3,348 | ($1,702) | ($752) | $447 | $1,373 | $3,048 | $2,508 | $2,853 | ($973) | ($2,400) | |
| Cash Balance | $6,836 | $769 | $4,118 | $2,416 | $1,664 | $2,111 | $3,484 | $6,533 | $9,041 | $11,894 | $10,921 | $8,521 | |
| Pro Forma Balance Sheet | |||||||||||||
| Month 1 | Month 2 | Month 3 | Month 4 | Month 5 | Month 6 | Month 7 | Month 8 | Month 9 | Month 10 | Month 11 | Month 12 | ||
| Assets | Starting Balances | ||||||||||||
| Current Assets | |||||||||||||
| Cash | $9,950 | $6,836 | $769 | $4,118 | $2,416 | $1,664 | $2,111 | $3,484 | $6,533 | $9,041 | $11,894 | $10,921 | $8,521 |
| Accounts Receivable | $0 | $3,000 | $6,650 | $8,125 | $9,600 | $11,075 | $13,300 | $15,500 | $16,975 | $13,950 | $8,825 | $6,625 | $5,900 |
| Other Current Assets | $0 | $0 | $0 | $0 | $0 | $0 | $0 | $0 | $0 | $0 | $0 | $0 | $0 |
| Total Current Assets | $9,950 | $9,836 | $7,419 | $12,243 | $12,016 | $12,739 | $15,411 | $18,984 | $23,508 | $22,991 | $20,719 | $17,546 | $14,421 |
| Long-term Assets | |||||||||||||
| Long-term Assets | $0 | $0 | $0 | $0 | $0 | $0 | $0 | $0 | $0 | $0 | $0 | $0 | $0 |
| Accumulated Depreciation | $0 | $0 | $0 | $0 | $0 | $0 | $0 | $0 | $0 | $0 | $0 | $0 | $0 |
| Total Long-term Assets | $0 | $0 | $0 | $0 | $0 | $0 | $0 | $0 | $0 | $0 | $0 | $0 | $0 |
| Total Assets | $9,950 | $9,836 | $7,419 | $12,243 | $12,016 | $12,739 | $15,411 | $18,984 | $23,508 | $22,991 | $20,719 | $17,546 | $14,421 |
| Liabilities and Capital | Month 1 | Month 2 | Month 3 | Month 4 | Month 5 | Month 6 | Month 7 | Month 8 | Month 9 | Month 10 | Month 11 | Month 12 | |
| Current Liabilities | |||||||||||||
| Accounts Payable | $0 | $3,311 | $3,069 | $3,118 | $3,166 | $3,214 | $3,311 | $3,359 | $3,408 | $3,166 | $3,069 | $3,021 | $3,021 |
| Current Borrowing | $0 | $0 | $0 | $0 | $0 | $0 | $0 | $0 | $0 | $0 | $0 | $0 | $0 |
| Other Current Liabilities | $0 | $0 | $0 | $0 | $0 | $0 | $0 | $0 | $0 | $0 | $0 | $0 | $0 |
| Subtotal Current Liabilities | $0 | $3,311 | $3,069 | $3,118 | $3,166 | $3,214 | $3,311 | $3,359 | $3,408 | $3,166 | $3,069 | $3,021 | $3,021 |
| Long-term Liabilities | $0 | $0 | $0 | $0 | $0 | $0 | $0 | $0 | $0 | $0 | $0 | $0 | $0 |
| Total Liabilities | $0 | $3,311 | $3,069 | $3,118 | $3,166 | $3,214 | $3,311 | $3,359 | $3,408 | $3,166 | $3,069 | $3,021 | $3,021 |
| Paid-in Capital | $25,000 | $25,000 | $25,000 | $31,000 | $31,000 | $31,000 | $31,000 | $31,000 | $31,000 | $31,000 | $31,000 | $31,000 | $31,000 |
| Retained Earnings | ($15,050) | ($15,050) | ($15,050) | ($15,050) | ($15,050) | ($15,050) | ($15,050) | ($15,050) | ($15,050) | ($15,050) | ($15,050) | ($15,050) | ($15,050) |
| Earnings | $0 | ($3,425) | ($5,600) | ($6,825) | ($7,100) | ($6,425) | ($3,850) | ($325) | $4,150 | $3,875 | $1,700 | ($1,425) | ($4,550) |
| Total Capital | $9,950 | $6,525 | $4,350 | $9,125 | $8,850 | $9,525 | $12,100 | $15,625 | $20,100 | $19,825 | $17,650 | $14,525 | $11,400 |
| Total Liabilities and Capital | $9,950 | $9,836 | $7,419 | $12,243 | $12,016 | $12,739 | $15,411 | $18,984 | $23,508 | $22,991 | $20,719 | $17,546 | $14,421 |
| Net Worth | $9,950 | $6,525 | $4,350 | $9,125 | $8,850 | $9,525 | $12,100 | $15,625 | $20,100 | $19,825 | $17,650 | $14,525 | $11,400 |

