
PRfect Greens
Executive Summary
PRfect Greens is a Eugene, Ore. based public relations firm that specializes in environmental PR. PRfect Greens’ areas of specialty are crisis management, image creation, management of publicity events. All of these activities ensure the proper management of sensitive environmental concerns by companies who are not typically seen as environmentally friendly.
Typical clients will include mining companies, natural gas extraction companies, and lumber companies. These clients seek a professional firm to assist in their perceived public environmental image. PRfect Greens will rapidly gain market share through the use of specialized, innovative customer attention.
By leveraging it’s competitive advantages, PRfect Greens will quickly grow it’s customer base. Having a specialized skill set with experience in environmental PR work will provide PRfect Greens with valuable insight that other PR firms are unable to offer. Additionally, PRfect Greens prides themselves on offering unmatched flexibility which will allow PRfect Greens to seamlessly meet any need a client may have.
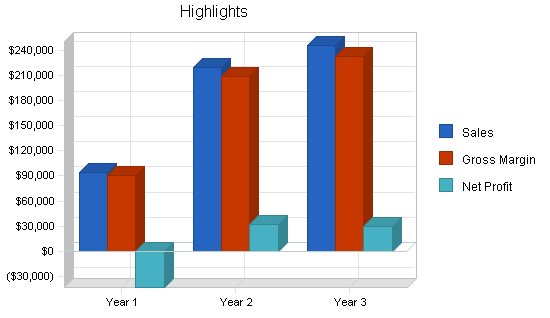
PRfect Greens is a partnership of two industry professionals with years of experience and insight. PRfect Greens will leverage their skills, experience, and innovative approach to reach profitability by month 10, generating noteworthy revenues by year three.
1.1 Mission
PRfect Greens’ mission is to provide the customer the highest quality of environmental PR consultancy. We exist to attract and maintain customers. When we adhere to this maxim, everything else will fall into place. Our services will exceed the expectations of our customers.
1.2 Keys to Success
The keys to success are:
- Attention to detail.
- Thinking outside the box.
- Professionalism.
- Results.
1.3 Objectives
The objectives for the first three years include:
- To create a start-up company whose primary goal is to exceed customer’s expectations.
- To increase the number of clients served by at least 20% per year through superior performance and referrals.
- To develop a sustainable business that is able to survive off its own cash flow.
Company Summary
PRfect Greens is an environmental public relations consultancy firm that specializes in working with companies that are typically perceived by the public as anti-environmental.
PRfect Greens is a partnership of two industry PR veterans, Birk Grunola and Arbor Hugger.
PRfect Greens will provide PR services to local, as well as regional firms, that are in need of immediate reactionary help, as well as long-term management.
2.1 Company Ownership
PRfect Greens is a private partnership owned equally by Birk Grunola and Arbor Hugger.
2.2 Start-up Summary
The following equipment will be needed. Please note that those items which are considered assets to be used for more than a year will be labeled long-term assets and will be depreciated using G.A.A.P. approved straight-line depreciation method.
- Two desks and chairs.
- Two file cabinets.
- Two computer systems including one license of QuickBooks Pro, two licenses of Microsoft Office, a CD-RW, printer, digital camera and a DSL connection.
- Burrelle’s media directory.
- Subscription to LexisNexis researching tools.
- Website development.

| Start-up | |
| Requirements | |
| Start-up Expenses | |
| Legal | $1,000 |
| Stationery etc. | $50 |
| Brochures | $100 |
| Website development | $1,000 |
| Lexis Nexus subscription | $300 |
| Total Start-up Expenses | $2,450 |
| Start-up Assets | |
| Cash Required | $59,850 |
| Other Current Assets | $0 |
| Long-term Assets | $3,700 |
| Total Assets | $63,550 |
| Total Requirements | $66,000 |
| Start-up Funding | |
| Start-up Expenses to Fund | $2,450 |
| Start-up Assets to Fund | $63,550 |
| Total Funding Required | $66,000 |
| Assets | |
| Non-cash Assets from Start-up | $3,700 |
| Cash Requirements from Start-up | $59,850 |
| Additional Cash Raised | $0 |
| Cash Balance on Starting Date | $59,850 |
| Total Assets | $63,550 |
| Liabilities and Capital | |
| Liabilities | |
| Current Borrowing | $0 |
| Long-term Liabilities | $0 |
| Accounts Payable (Outstanding Bills) | $0 |
| Other Current Liabilities (interest-free) | $0 |
| Total Liabilities | $0 |
| Capital | |
| Planned Investment | |
| Arbor | $33,000 |
| Birk | $33,000 |
| Additional Investment Requirement | $0 |
| Total Planned Investment | $66,000 |
| Loss at Start-up (Start-up Expenses) | ($2,450) |
| Total Capital | $63,550 |
| Total Capital and Liabilities | $63,550 |
| Total Funding | $66,000 |
Services
PRfect Greens offers a wide range of environmental PR services. These services will typically be used by gas companies, mining companies, and lumber companies who are looking to improve their environmental image or manage a crisis. The main services offered are:
- Crisis management. This is a reactionary/proactive service that helps the customer manage a crisis or situation that if left unattended could create significant amounts of bad press and tarnish the public image of companies that already have sensitive environmental images by virtue of the fact that they operate in sensitive environmental areas.
- Image creation. This service designs and implements a certain public image, typically an image that is pro-environment for a company that is in an anti-environment industry.
- Management of publicity events. These services develop and manage client sponsored publicity events which are designed to strengthen the clients perceived environmental commitment.
Market Analysis Summary
PRfect Greens will primarily serve three different target segments within the environmental PR space: gas companies, mining companies, and lumber companies. These different industries will be targeted because they represent a large amount of business activity in this region and because they have struggled in the past to maintain an ideal/reasonable public image.
These segments will be targeted through an advertising campaign and networking activities tailored to each industry customer.
4.1 Market Segmentation
PRfect Greens has three distinct groups of customers:
- Gas companies. These companies are performing subterranean drilling in search of natural gas reserves. They might utilize PRfect Greens to help strengthen their image as an environmentally friendly provider of energy (the burning of natural gas releases far fewer pollutants, specifically CO2 than other fossil fuels). Additionally they may need PRfect Greens for crisis management services or promotional activities.
- Mining companies. The mining companies have a negative public environmental image due to the general destruction of the land that occurs when evaluating the mineral deposits below the land as well as the release of tailing into water sources and the general destruction of the land that occurs during mining operations. A perfect example of a company that could have used PRfect Greens’ service was the Kinross Mining Company, a company that was mining copper in Willamette National Forest. Kinross had to endure a public relations fiasco when multiple environmental groups were bringing legal claims against Kinross due to the release of effluents into the Santiam River, the main source for the Santiam Watershed, the source of water for Salem and other nearby cities.
- Lumber companies. There are a lot of lumber industry jobs in Oregon. Both Georgia Pacific and Willamette Industry are two multinational corporations that 1) do a lot of logging as well as processing 2) and have struggled to maintain a environmentally friendly public perception.

| Market Analysis | |||||||
| Year 1 | Year 2 | Year 3 | Year 4 | Year 5 | |||
| Potential Customers | Growth | CAGR | |||||
| Gas companies | 8% | 15 | 16 | 17 | 18 | 19 | 6.09% |
| Mining companies | 9% | 44 | 48 | 52 | 57 | 62 | 8.95% |
| Lumbar companies | 7% | 38 | 41 | 44 | 47 | 50 | 7.10% |
| Total | 7.80% | 97 | 105 | 113 | 122 | 131 | 7.80% |
4.2 Target Market Segment Strategy
The selected customer segments will be targeted in a specific advertising and networking campaign.
- Advertising. This campaign will target each of the prospective customers. The advertisements will generally be placed within the appropriate industry trade journal. The advertisements will be used to communicate the message that PRfect Greens is a specialized environmental PR firm that can work hand and hand with the company, providing them with both proactive, as well as reactive PR services. The advertisements will detail the different services PRfect Greens provides as well as the experience the founders have in this niche.
- Networking. Since both of the founders have a long history in this market space, they have a long list of contacts that they have developed over the years. PRfect Greens will leverage these contacts to raise visibility regarding PRfect Greens and establish relationships so PRfect Greens can began to serve them. Because this market niche is fairly small and specific, people in the space tend to know each other and a lot of business is transacted among acquaintances. This nature of the industry will make networking activities all the more effective.
4.3 Service Business Analysis
The PR industry in Eugene has many different competitors, however few have the specialized skills for environmental PR work. The competitors generally take the form of general communication firms, small local PR firms, and large national firms.

PRfect Greens will rapidly gain market share in their specific space by leveraging their competitive edges. These edges consist of a specialized skill set honed for the demands of environmental PR and the high degree of flexibility. As a small specialized firm, PRfect Greens is able to address any need generated by a client.
4.3.1 Competition and Buying Patterns
Competition takes many forms:
- General communications firms. These firms practice a wide range of communication services from press releases, to promotional materials, to corporate imaging. Some of the general communication firms are large and have dedicated departments for different types of communications, others have generalists that do everything.
- Small, local PR firms. These companies are small, typically one principal, and their clients are from the surrounding area.
- Large national firms. These firms are quite large and they serve national clients. The clients are usually very large companies and these national firms travel to wherever to support the account.
Buying patterns for companies typically take the form of RFP’s for the larger companies, and informal referrals/networking for the smaller clients.
Strategy and Implementation Summary
PRfect Greens’ marketing and sales strategies will be based on developing visibility for PRfect Greens and communicating the message that PRfect Greens is able to provide an unmatched service offering due to the special skill set and flexibility in serving the client.
5.1 Competitive Edge
PRfect Greens has two complementary competitive edges:
- Specialized skill set. While this will be detailed further in the management section, this competitive edge allows PRfect Greens to provide keen insight into the customer’s industry and how that applies to public relations.
- Flexibility. As a small firm, PRfect Greens is able to meet the customer’s special needs by offering a very flexible service. This flexibility allows PRfect Greens to work hand in hand with company and the community to support their customer. While many competitors will have an initial interview with the customer on their site, most of the work is completed on the PR firms terms, typically at the home office. PRfect Greens’ flexibility allows them to work with the client in any capacity required to serve the customer in the most effective way. Often this means working closely with the customer and the various hierarchical levels within the company. This will sometimes mean extended time spent at the company’s work site, a service that PRfect Greens is more than happy to offer.
5.2 Marketing Strategy
As stated before in the target market segment strategy, PRfect Greens will use a combination of targeted advertising and networking to generate visibility and communicate PRfect Greens’ message that they are the premier environmental PR firm in the area that possesses the ability to offer unprecedented specialized services and flexibility to help the customer manage their public image and deal with any unfortunate crisis.
The advertising will be done in specific industry journals. These will be chosen because the journal readership is a very specific demographic that PRfect Greens is trying to reach.
The networking activities will be quite effective in leveraging the already existing relationships that Birk and Arbor have established through years working in the different industries.
5.3 Sales Strategy
The sale strategy will be based on turning prospective customers into long-term clients. The primary way this will be accomplished is through a dog and pony show performed for the decision maker. This presentation will outline all of the different services and value that PRfect Greens offers: their rich specialized experience and very personalized attention that their clients receive. They will emphasize the smallness of PRfect Greens that allows it to serve every client with individual attention that one would expect from an in-house staff.
The dog and pony show will also highlight PRfect Greens’ portfolio of past clients served and the creative “out of the box” thinking that prevails at PRfect Greens. The portfolio itself will be quite creative, not just a standard display of past projects, but a representation in itself of PRfect Greens’ creativity and competence.
5.3.1 Sales Forecast
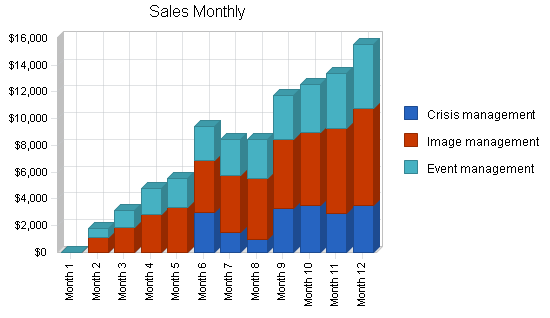
The first month of operation will not have any sales activity. The office will be set up and the marketing campaign will be devised. The second month will see a small amount of activity, primarily small projects of limited duration.
By month three and four, visibility of PRfect Greens will have begun to take root and there will be an increasing number of inquiries that will be turned into projects.
Sales will steadily ramp from month four on with profitability being reached by month 10 and sales steadily increasing through the end of year three.

| Sales Forecast | |||
| Year 1 | Year 2 | Year 3 | |
| Sales | |||
| Crisis management | $18,700 | $48,000 | $55,000 |
| Image management | $46,069 | $104,556 | $115,676 |
| Event management | $29,945 | $67,961 | $75,189 |
| Total Sales | $94,714 | $220,517 | $245,865 |
| Direct Cost of Sales | Year 1 | Year 2 | Year 3 |
| Crisis management | $935 | $2,400 | $2,750 |
| Image management | $2,303 | $5,228 | $5,784 |
| Event management | $1,497 | $3,398 | $3,759 |
| Subtotal Direct Cost of Sales | $4,736 | $11,026 | $12,293 |
5.4 Milestones
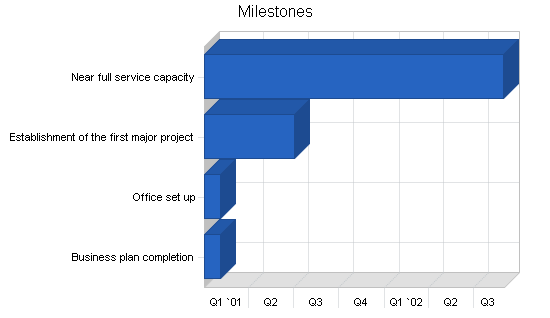
PRfect Greens will have several milestones early on:
- Business plan completion. While business plans are typically created on requirement to secure capital, PRfect Greens will use the plan as a way to develop a strategic focus as well as a gauge to track adherence to the plan at multiple intervals in the coming quarters and years.
- Office set up.
- Establishment of the first major project.
- Near full service capacity.
| Milestones | |||||
| Milestone | Start Date | End Date | Budget | Manager | Department |
| Business plan completion | 1/1/2001 | 2/1/2001 | $0 | Arbor | Marketing |
| Office set up | 1/1/2001 | 2/1/2001 | $0 | Birk | Department |
| Establishment of the first major project | 1/1/2001 | 7/1/2001 | $0 | Arbor & Birk | Department |
| Near full service capacity | 1/1/2001 | 8/30/2002 | $0 | Everyone | Department |
| Totals | $0 | ||||
Web Plan Summary
The website will be used as a resource for developing visibility, disseminating information such as a portfolio of past projects and case studies, as well as a way that prospective customers can contact PRfect Greens.
6.1 Website Marketing Strategy
The marketing of the website will incorporate the following actions:
- Search engine submission. For all prospective customers that are unaware of PRfect Greens and are using the Internet to research the possible service solutions to their problem, PRfect Greens will professionally submit their site individually to all of the popular search engines so that PRfect Greens’ site appears at the top of the search list.
- Advertising of the site through the various written materials that PRfect Greens will disseminate to prospective customers.
6.2 Development Requirements
The website development will be the product of a University of Oregon computer science graduate student. The utilization of the graduate student will be used because of their technical competence as well as their below-market rates that they typically charge as a student.
Management Summary
Birk Grunola
Birk received a BS in communications and environmental science from the University of Oregon. Beyond school, Birk went to work for the Weyerhauser corporation in their marketing department. After six years, Birk was promoted to the head of the in-house staff for external communications. It was his responsibility to shape the public’s perception of Weyerhauser as an environmental corporate citizen. After five years at this position Birk began looking for an opportunity that would give him more flexibility and autonomy.
Arbor Hugger
Arbor received a biology degree from American University. After college, Arbor went to work for the Environmental Protection Industry (EPA) in Washington D.C. Arbor had varying degrees of responsibility at the EPA, ultimately working as a manager for external communications. After 10 years at the EPA, Arbor was seeking a more progressive, less bureaucratic organization to serve. Arbor was able to leverage his skills at the EPA and parlay it into a position as the PR director for the National Gas Exploration Association. At this position, Arbor was responsible for all of the external communications of the Association, crisis management, and management of publicity events. After three years Arbor was searching for a more flexible opportunity. Through the years, Arbor remained in contact with his best friend from high school, Birk. On a specific vacation retreat the two took together, they became cognizant of the fact that both were somewhat unhappy at their current jobs and were looking for new opportunities. This revelation lead to a year of dialogue between the two at which point they both decided to leave their current jobs and start their own firm.
7.1 Personnel Plan
Birk and Arbor are the two principals of the firm. They will hire a part-time administrative assistant by month four.
| Personnel Plan | |||
| Year 1 | Year 2 | Year 3 | |
| Arbor | $48,000 | $60,000 | $70,000 |
| Birk | $48,000 | $60,000 | $70,000 |
| Administrative assistant | $8,640 | $11,520 | $15,000 |
| Total People | 3 | 3 | 3 |
| Total Payroll | $104,640 | $131,520 | $155,000 |
Financial Plan
The following sections will outline important financial information.
8.1 Important Assumptions
The following table details important financial assumptions.
| General Assumptions | |||
| Year 1 | Year 2 | Year 3 | |
| Plan Month | 1 | 2 | 3 |
| Current Interest Rate | 10.00% | 10.00% | 10.00% |
| Long-term Interest Rate | 10.00% | 10.00% | 10.00% |
| Tax Rate | 30.00% | 30.00% | 30.00% |
| Other | 0 | 0 | 0 |
8.2 Key Financial Indicators
The following table outlines the key financial indictors.

8.3 Break-even Analysis
The Break-even Analysis indicates what will be needed in monthly revenue to reach the break-even point.

| Break-even Analysis | |
| Monthly Revenue Break-even | $11,725 |
| Assumptions: | |
| Average Percent Variable Cost | 5% |
| Estimated Monthly Fixed Cost | $11,139 |
8.4 Projected Profit and Loss
The following table will indicate projected profit and loss.


| Pro Forma Profit and Loss | |||
| Year 1 | Year 2 | Year 3 | |
| Sales | $94,714 | $220,517 | $245,865 |
| Direct Cost of Sales | $4,736 | $11,026 | $12,293 |
| Other Production Expenses | $0 | $0 | $0 |
| Total Cost of Sales | $4,736 | $11,026 | $12,293 |
| Gross Margin | $89,978 | $209,492 | $233,572 |
| Gross Margin % | 95.00% | 95.00% | 95.00% |
| Expenses | |||
| Payroll | $104,640 | $131,520 | $155,000 |
| Sales and Marketing and Other Expenses | $4,200 | $4,200 | $4,200 |
| Depreciation | $732 | $732 | $732 |
| Leased Equipment | $0 | $0 | $0 |
| Utilities | $1,200 | $1,200 | $1,200 |
| Insurance | $1,200 | $1,200 | $1,200 |
| Rent | $6,000 | $6,000 | $6,000 |
| Payroll Taxes | $15,696 | $19,728 | $23,250 |
| Other | $0 | $0 | $0 |
| Total Operating Expenses | $133,668 | $164,580 | $191,582 |
| Profit Before Interest and Taxes | ($43,690) | $44,912 | $41,990 |
| EBITDA | ($42,958) | $45,644 | $42,722 |
| Interest Expense | $0 | $0 | $0 |
| Taxes Incurred | $0 | $13,473 | $12,597 |
| Net Profit | ($43,690) | $31,438 | $29,393 |
| Net Profit/Sales | -46.13% | 14.26% | 11.95% |
8.5 Projected Cash Flow
The following chart and table will indicate projected cash flow.

| Pro Forma Cash Flow | |||
| Year 1 | Year 2 | Year 3 | |
| Cash Received | |||
| Cash from Operations | |||
| Cash Sales | $33,150 | $77,181 | $86,053 |
| Cash from Receivables | $43,071 | $118,773 | $154,863 |
| Subtotal Cash from Operations | $76,221 | $195,954 | $240,916 |
| Additional Cash Received | |||
| Sales Tax, VAT, HST/GST Received | $0 | $0 | $0 |
| New Current Borrowing | $0 | $0 | $0 |
| New Other Liabilities (interest-free) | $0 | $0 | $0 |
| New Long-term Liabilities | $0 | $0 | $0 |
| Sales of Other Current Assets | $0 | $0 | $0 |
| Sales of Long-term Assets | $0 | $0 | $0 |
| New Investment Received | $0 | $0 | $0 |
| Subtotal Cash Received | $76,221 | $195,954 | $240,916 |
| Expenditures | Year 1 | Year 2 | Year 3 |
| Expenditures from Operations | |||
| Cash Spending | $104,640 | $131,520 | $155,000 |
| Bill Payments | $29,966 | $55,222 | $60,419 |
| Subtotal Spent on Operations | $134,606 | $186,742 | $215,419 |
| Additional Cash Spent | |||
| Sales Tax, VAT, HST/GST Paid Out | $0 | $0 | $0 |
| Principal Repayment of Current Borrowing | $0 | $0 | $0 |
| Other Liabilities Principal Repayment | $0 | $0 | $0 |
| Long-term Liabilities Principal Repayment | $0 | $0 | $0 |
| Purchase Other Current Assets | $0 | $0 | $0 |
| Purchase Long-term Assets | $0 | $0 | $0 |
| Dividends | $0 | $0 | $0 |
| Subtotal Cash Spent | $134,606 | $186,742 | $215,419 |
| Net Cash Flow | ($58,385) | $9,212 | $25,497 |
| Cash Balance | $1,465 | $10,676 | $36,174 |
8.6 Projected Balance Sheet
The following table will indicate the projected balance sheet.
| Pro Forma Balance Sheet | |||
| Year 1 | Year 2 | Year 3 | |
| Assets | |||
| Current Assets | |||
| Cash | $1,465 | $10,676 | $36,174 |
| Accounts Receivable | $18,493 | $43,057 | $48,006 |
| Other Current Assets | $0 | $0 | $0 |
| Total Current Assets | $19,958 | $53,733 | $84,180 |
| Long-term Assets | |||
| Long-term Assets | $3,700 | $3,700 | $3,700 |
| Accumulated Depreciation | $732 | $1,464 | $2,196 |
| Total Long-term Assets | $2,968 | $2,236 | $1,504 |
| Total Assets | $22,926 | $55,969 | $85,684 |
| Liabilities and Capital | Year 1 | Year 2 | Year 3 |
| Current Liabilities | |||
| Accounts Payable | $3,066 | $4,671 | $4,992 |
| Current Borrowing | $0 | $0 | $0 |
| Other Current Liabilities | $0 | $0 | $0 |
| Subtotal Current Liabilities | $3,066 | $4,671 | $4,992 |
| Long-term Liabilities | $0 | $0 | $0 |
| Total Liabilities | $3,066 | $4,671 | $4,992 |
| Paid-in Capital | $66,000 | $66,000 | $66,000 |
| Retained Earnings | ($2,450) | ($46,140) | ($14,702) |
| Earnings | ($43,690) | $31,438 | $29,393 |
| Total Capital | $19,860 | $51,298 | $80,691 |
| Total Liabilities and Capital | $22,926 | $55,969 | $85,684 |
| Net Worth | $19,860 | $51,298 | $80,691 |
8.7 Business Ratios
Business ratios for the years of this plan are shown below. Industry profile ratios based on the Standard Industrial Classification (SIC) code 8743, Public Relations Service, are shown for comparison.
| Ratio Analysis | ||||
| Year 1 | Year 2 | Year 3 | Industry Profile | |
| Sales Growth | 0.00% | 132.82% | 11.49% | 8.60% |
| Percent of Total Assets | ||||
| Accounts Receivable | 80.67% | 76.93% | 56.03% | 24.20% |
| Other Current Assets | 0.00% | 0.00% | 0.00% | 44.30% |
| Total Current Assets | 87.05% | 96.00% | 98.24% | 72.50% |
| Long-term Assets | 12.95% | 4.00% | 1.76% | 27.50% |
| Total Assets | 100.00% | 100.00% | 100.00% | 100.00% |
| Current Liabilities | 13.37% | 8.35% | 5.83% | 45.00% |
| Long-term Liabilities | 0.00% | 0.00% | 0.00% | 17.00% |
| Total Liabilities | 13.37% | 8.35% | 5.83% | 62.00% |
| Net Worth | 86.63% | 91.65% | 94.17% | 38.00% |
| Percent of Sales | ||||
| Sales | 100.00% | 100.00% | 100.00% | 100.00% |
| Gross Margin | 95.00% | 95.00% | 95.00% | 0.00% |
| Selling, General & Administrative Expenses | 141.13% | 80.74% | 83.05% | 79.40% |
| Advertising Expenses | 2.53% | 1.09% | 0.98% | 1.20% |
| Profit Before Interest and Taxes | -46.13% | 20.37% | 17.08% | 2.40% |
| Main Ratios | ||||
| Current | 6.51 | 11.50 | 16.86 | 1.71 |
| Quick | 6.51 | 11.50 | 16.86 | 1.36 |
| Total Debt to Total Assets | 13.37% | 8.35% | 5.83% | 62.00% |
| Pre-tax Return on Net Worth | -219.99% | 87.55% | 52.04% | 5.10% |
| Pre-tax Return on Assets | -190.57% | 80.24% | 49.01% | 13.50% |
| Additional Ratios | Year 1 | Year 2 | Year 3 | |
| Net Profit Margin | -46.13% | 14.26% | 11.95% | n.a |
| Return on Equity | -219.99% | 61.28% | 36.43% | n.a |
| Activity Ratios | ||||
| Accounts Receivable Turnover | 3.33 | 3.33 | 3.33 | n.a |
| Collection Days | 55 | 78 | 104 | n.a |
| Accounts Payable Turnover | 10.78 | 12.17 | 12.17 | n.a |
| Payment Days | 27 | 25 | 29 | n.a |
| Total Asset Turnover | 4.13 | 3.94 | 2.87 | n.a |
| Debt Ratios | ||||
| Debt to Net Worth | 0.15 | 0.09 | 0.06 | n.a |
| Current Liab. to Liab. | 1.00 | 1.00 | 1.00 | n.a |
| Liquidity Ratios | ||||
| Net Working Capital | $16,892 | $49,062 | $79,187 | n.a |
| Interest Coverage | 0.00 | 0.00 | 0.00 | n.a |
| Additional Ratios | ||||
| Assets to Sales | 0.24 | 0.25 | 0.35 | n.a |
| Current Debt/Total Assets | 13% | 8% | 6% | n.a |
| Acid Test | 0.48 | 2.29 | 7.25 | n.a |
| Sales/Net Worth | 4.77 | 4.30 | 3.05 | n.a |
| Dividend Payout | 0.00 | 0.00 | 0.00 | n.a |
Appendix
| Sales Forecast | |||||||||||||
| Month 1 | Month 2 | Month 3 | Month 4 | Month 5 | Month 6 | Month 7 | Month 8 | Month 9 | Month 10 | Month 11 | Month 12 | ||
| Sales | |||||||||||||
| Crisis management | 0% | $0 | $0 | $0 | $0 | $0 | $3,000 | $1,500 | $1,000 | $3,300 | $3,500 | $2,900 | $3,500 |
| Image management | 0% | $0 | $1,100 | $1,898 | $2,878 | $3,345 | $3,878 | $4,223 | $4,501 | $5,112 | $5,500 | $6,334 | $7,300 |
| Event management | 0% | $0 | $715 | $1,234 | $1,871 | $2,174 | $2,521 | $2,745 | $2,926 | $3,323 | $3,575 | $4,117 | $4,745 |
| Total Sales | $0 | $1,815 | $3,132 | $4,749 | $5,519 | $9,399 | $8,468 | $8,427 | $11,735 | $12,575 | $13,351 | $15,545 | |
| Direct Cost of Sales | Month 1 | Month 2 | Month 3 | Month 4 | Month 5 | Month 6 | Month 7 | Month 8 | Month 9 | Month 10 | Month 11 | Month 12 | |
| Crisis management | $0 | $0 | $0 | $0 | $0 | $150 | $75 | $50 | $165 | $175 | $145 | $175 | |
| Image management | $0 | $55 | $95 | $144 | $167 | $194 | $211 | $225 | $256 | $275 | $317 | $365 | |
| Event management | $0 | $36 | $62 | $94 | $109 | $126 | $137 | $146 | $166 | $179 | $206 | $237 | |
| Subtotal Direct Cost of Sales | $0 | $91 | $157 | $237 | $276 | $470 | $423 | $421 | $587 | $629 | $668 | $777 | |
| Personnel Plan | |||||||||||||
| Month 1 | Month 2 | Month 3 | Month 4 | Month 5 | Month 6 | Month 7 | Month 8 | Month 9 | Month 10 | Month 11 | Month 12 | ||
| Arbor | 0% | $4,000 | $4,000 | $4,000 | $4,000 | $4,000 | $4,000 | $4,000 | $4,000 | $4,000 | $4,000 | $4,000 | $4,000 |
| Birk | 0% | $4,000 | $4,000 | $4,000 | $4,000 | $4,000 | $4,000 | $4,000 | $4,000 | $4,000 | $4,000 | $4,000 | $4,000 |
| Administrative assistant | 0% | $0 | $0 | $0 | $960 | $960 | $960 | $960 | $960 | $960 | $960 | $960 | $960 |
| Total People | 2 | 2 | 2 | 3 | 3 | 3 | 3 | 3 | 3 | 3 | 3 | 3 | |
| Total Payroll | $8,000 | $8,000 | $8,000 | $8,960 | $8,960 | $8,960 | $8,960 | $8,960 | $8,960 | $8,960 | $8,960 | $8,960 | |
| General Assumptions | |||||||||||||
| Month 1 | Month 2 | Month 3 | Month 4 | Month 5 | Month 6 | Month 7 | Month 8 | Month 9 | Month 10 | Month 11 | Month 12 | ||
| Plan Month | 1 | 2 | 3 | 4 | 5 | 6 | 7 | 8 | 9 | 10 | 11 | 12 | |
| Current Interest Rate | 10.00% | 10.00% | 10.00% | 10.00% | 10.00% | 10.00% | 10.00% | 10.00% | 10.00% | 10.00% | 10.00% | 10.00% | |
| Long-term Interest Rate | 10.00% | 10.00% | 10.00% | 10.00% | 10.00% | 10.00% | 10.00% | 10.00% | 10.00% | 10.00% | 10.00% | 10.00% | |
| Tax Rate | 30.00% | 30.00% | 30.00% | 30.00% | 30.00% | 30.00% | 30.00% | 30.00% | 30.00% | 30.00% | 30.00% | 30.00% | |
| Other | 0 | 0 | 0 | 0 | 0 | 0 | 0 | 0 | 0 | 0 | 0 | 0 | |
| Pro Forma Profit and Loss | |||||||||||||
| Month 1 | Month 2 | Month 3 | Month 4 | Month 5 | Month 6 | Month 7 | Month 8 | Month 9 | Month 10 | Month 11 | Month 12 | ||
| Sales | $0 | $1,815 | $3,132 | $4,749 | $5,519 | $9,399 | $8,468 | $8,427 | $11,735 | $12,575 | $13,351 | $15,545 | |
| Direct Cost of Sales | $0 | $91 | $157 | $237 | $276 | $470 | $423 | $421 | $587 | $629 | $668 | $777 | |
| Other Production Expenses | $0 | $0 | $0 | $0 | $0 | $0 | $0 | $0 | $0 | $0 | $0 | $0 | |
| Total Cost of Sales | $0 | $91 | $157 | $237 | $276 | $470 | $423 | $421 | $587 | $629 | $668 | $777 | |
| Gross Margin | $0 | $1,724 | $2,975 | $4,511 | $5,243 | $8,929 | $8,045 | $8,005 | $11,148 | $11,946 | $12,684 | $14,768 | |
| Gross Margin % | 0.00% | 95.00% | 95.00% | 95.00% | 95.00% | 95.00% | 95.00% | 95.00% | 95.00% | 95.00% | 95.00% | 95.00% | |
| Expenses | |||||||||||||
| Payroll | $8,000 | $8,000 | $8,000 | $8,960 | $8,960 | $8,960 | $8,960 | $8,960 | $8,960 | $8,960 | $8,960 | $8,960 | |
| Sales and Marketing and Other Expenses | $350 | $350 | $350 | $350 | $350 | $350 | $350 | $350 | $350 | $350 | $350 | $350 | |
| Depreciation | $61 | $61 | $61 | $61 | $61 | $61 | $61 | $61 | $61 | $61 | $61 | $61 | |
| Leased Equipment | $0 | $0 | $0 | $0 | $0 | $0 | $0 | $0 | $0 | $0 | $0 | $0 | |
| Utilities | $100 | $100 | $100 | $100 | $100 | $100 | $100 | $100 | $100 | $100 | $100 | $100 | |
| Insurance | $100 | $100 | $100 | $100 | $100 | $100 | $100 | $100 | $100 | $100 | $100 | $100 | |
| Rent | $500 | $500 | $500 | $500 | $500 | $500 | $500 | $500 | $500 | $500 | $500 | $500 | |
| Payroll Taxes | 15% | $1,200 | $1,200 | $1,200 | $1,344 | $1,344 | $1,344 | $1,344 | $1,344 | $1,344 | $1,344 | $1,344 | $1,344 |
| Other | $0 | $0 | $0 | $0 | $0 | $0 | $0 | $0 | $0 | $0 | $0 | $0 | |
| Total Operating Expenses | $10,311 | $10,311 | $10,311 | $11,415 | $11,415 | $11,415 | $11,415 | $11,415 | $11,415 | $11,415 | $11,415 | $11,415 | |
| Profit Before Interest and Taxes | ($10,311) | ($8,587) | ($7,336) | ($6,904) | ($6,172) | ($2,486) | ($3,370) | ($3,410) | ($267) | $531 | $1,269 | $3,353 | |
| EBITDA | ($10,250) | ($8,526) | ($7,275) | ($6,843) | ($6,111) | ($2,425) | ($3,309) | ($3,349) | ($206) | $592 | $1,330 | $3,414 | |
| Interest Expense | $0 | $0 | $0 | $0 | $0 | $0 | $0 | $0 | $0 | $0 | $0 | $0 | |
| Taxes Incurred | $0 | $0 | $0 | $0 | $0 | $0 | $0 | $0 | $0 | $0 | $0 | $0 | |
| Net Profit | ($10,311) | ($8,587) | ($7,336) | ($6,904) | ($6,172) | ($2,486) | ($3,370) | ($3,410) | ($267) | $531 | $1,269 | $3,353 | |
| Net Profit/Sales | 0.00% | -473.10% | -234.25% | -145.38% | -111.82% | -26.45% | -39.80% | -40.46% | -2.27% | 4.22% | 9.50% | 21.57% | |
| Pro Forma Cash Flow | |||||||||||||
| Month 1 | Month 2 | Month 3 | Month 4 | Month 5 | Month 6 | Month 7 | Month 8 | Month 9 | Month 10 | Month 11 | Month 12 | ||
| Cash Received | |||||||||||||
| Cash from Operations | |||||||||||||
| Cash Sales | $0 | $635 | $1,096 | $1,662 | $1,932 | $3,290 | $2,964 | $2,949 | $4,107 | $4,401 | $4,673 | $5,441 | |
| Cash from Receivables | $0 | $0 | $39 | $1,208 | $2,071 | $3,103 | $3,672 | $6,089 | $5,503 | $5,549 | $7,646 | $8,191 | |
| Subtotal Cash from Operations | $0 | $635 | $1,135 | $2,870 | $4,002 | $6,393 | $6,635 | $9,038 | $9,610 | $9,950 | $12,319 | $13,631 | |
| Additional Cash Received | |||||||||||||
| Sales Tax, VAT, HST/GST Received | 0.00% | $0 | $0 | $0 | $0 | $0 | $0 | $0 | $0 | $0 | $0 | $0 | $0 |
| New Current Borrowing | $0 | $0 | $0 | $0 | $0 | $0 | $0 | $0 | $0 | $0 | $0 | $0 | |
| New Other Liabilities (interest-free) | $0 | $0 | $0 | $0 | $0 | $0 | $0 | $0 | $0 | $0 | $0 | $0 | |
| New Long-term Liabilities | $0 | $0 | $0 | $0 | $0 | $0 | $0 | $0 | $0 | $0 | $0 | $0 | |
| Sales of Other Current Assets | $0 | $0 | $0 | $0 | $0 | $0 | $0 | $0 | $0 | $0 | $0 | $0 | |
| Sales of Long-term Assets | $0 | $0 | $0 | $0 | $0 | $0 | $0 | $0 | $0 | $0 | $0 | $0 | |
| New Investment Received | $0 | $0 | $0 | $0 | $0 | $0 | $0 | $0 | $0 | $0 | $0 | $0 | |
| Subtotal Cash Received | $0 | $635 | $1,135 | $2,870 | $4,002 | $6,393 | $6,635 | $9,038 | $9,610 | $9,950 | $12,319 | $13,631 | |
| Expenditures | Month 1 | Month 2 | Month 3 | Month 4 | Month 5 | Month 6 | Month 7 | Month 8 | Month 9 | Month 10 | Month 11 | Month 12 | |
| Expenditures from Operations | |||||||||||||
| Cash Spending | $8,000 | $8,000 | $8,000 | $8,960 | $8,960 | $8,960 | $8,960 | $8,960 | $8,960 | $8,960 | $8,960 | $8,960 | |
| Bill Payments | $75 | $2,253 | $2,343 | $2,414 | $2,633 | $2,676 | $2,862 | $2,817 | $2,821 | $2,982 | $3,024 | $3,065 | |
| Subtotal Spent on Operations | $8,075 | $10,253 | $10,343 | $11,374 | $11,593 | $11,636 | $11,822 | $11,777 | $11,781 | $11,942 | $11,984 | $12,025 | |
| Additional Cash Spent | |||||||||||||
| Sales Tax, VAT, HST/GST Paid Out | $0 | $0 | $0 | $0 | $0 | $0 | $0 | $0 | $0 | $0 | $0 | $0 | |
| Principal Repayment of Current Borrowing | $0 | $0 | $0 | $0 | $0 | $0 | $0 | $0 | $0 | $0 | $0 | $0 | |
| Other Liabilities Principal Repayment | $0 | $0 | $0 | $0 | $0 | $0 | $0 | $0 | $0 | $0 | $0 | $0 | |
| Long-term Liabilities Principal Repayment | $0 | $0 | $0 | $0 | $0 | $0 | $0 | $0 | $0 | $0 | $0 | $0 | |
| Purchase Other Current Assets | $0 | $0 | $0 | $0 | $0 | $0 | $0 | $0 | $0 | $0 | $0 | $0 | |
| Purchase Long-term Assets | $0 | $0 | $0 | $0 | $0 | $0 | $0 | $0 | $0 | $0 | $0 | $0 | |
| Dividends | $0 | $0 | $0 | $0 | $0 | $0 | $0 | $0 | $0 | $0 | $0 | $0 | |
| Subtotal Cash Spent | $8,075 | $10,253 | $10,343 | $11,374 | $11,593 | $11,636 | $11,822 | $11,777 | $11,781 | $11,942 | $11,984 | $12,025 | |
| Net Cash Flow | ($8,075) | ($9,618) | ($9,208) | ($8,504) | ($7,590) | ($5,244) | ($5,187) | ($2,739) | ($2,170) | ($1,992) | $335 | $1,606 | |
| Cash Balance | $51,775 | $42,157 | $32,950 | $24,446 | $16,856 | $11,612 | $6,425 | $3,686 | $1,516 | ($476) | ($142) | $1,465 | |
| Pro Forma Balance Sheet | |||||||||||||
| Month 1 | Month 2 | Month 3 | Month 4 | Month 5 | Month 6 | Month 7 | Month 8 | Month 9 | Month 10 | Month 11 | Month 12 | ||
| Assets | Starting Balances | ||||||||||||
| Current Assets | |||||||||||||
| Cash | $59,850 | $51,775 | $42,157 | $32,950 | $24,446 | $16,856 | $11,612 | $6,425 | $3,686 | $1,516 | ($476) | ($142) | $1,465 |
| Accounts Receivable | $0 | $0 | $1,180 | $3,176 | $5,054 | $6,571 | $9,577 | $11,410 | $10,798 | $12,922 | $15,547 | $16,580 | $18,493 |
| Other Current Assets | $0 | $0 | $0 | $0 | $0 | $0 | $0 | $0 | $0 | $0 | $0 | $0 | $0 |
| Total Current Assets | $59,850 | $51,775 | $43,337 | $36,126 | $29,500 | $23,427 | $21,189 | $17,835 | $14,484 | $14,438 | $15,071 | $16,438 | $19,958 |
| Long-term Assets | |||||||||||||
| Long-term Assets | $3,700 | $3,700 | $3,700 | $3,700 | $3,700 | $3,700 | $3,700 | $3,700 | $3,700 | $3,700 | $3,700 | $3,700 | $3,700 |
| Accumulated Depreciation | $0 | $61 | $122 | $183 | $244 | $305 | $366 | $427 | $488 | $549 | $610 | $671 | $732 |
| Total Long-term Assets | $3,700 | $3,639 | $3,578 | $3,517 | $3,456 | $3,395 | $3,334 | $3,273 | $3,212 | $3,151 | $3,090 | $3,029 | $2,968 |
| Total Assets | $63,550 | $55,414 | $46,915 | $39,643 | $32,956 | $26,822 | $24,523 | $21,108 | $17,696 | $17,589 | $18,161 | $19,467 | $22,926 |
| Liabilities and Capital | Month 1 | Month 2 | Month 3 | Month 4 | Month 5 | Month 6 | Month 7 | Month 8 | Month 9 | Month 10 | Month 11 | Month 12 | |
| Current Liabilities | |||||||||||||
| Accounts Payable | $0 | $2,175 | $2,263 | $2,326 | $2,544 | $2,581 | $2,768 | $2,723 | $2,721 | $2,881 | $2,922 | $2,960 | $3,066 |
| Current Borrowing | $0 | $0 | $0 | $0 | $0 | $0 | $0 | $0 | $0 | $0 | $0 | $0 | $0 |
| Other Current Liabilities | $0 | $0 | $0 | $0 | $0 | $0 | $0 | $0 | $0 | $0 | $0 | $0 | $0 |
| Subtotal Current Liabilities | $0 | $2,175 | $2,263 | $2,326 | $2,544 | $2,581 | $2,768 | $2,723 | $2,721 | $2,881 | $2,922 | $2,960 | $3,066 |
| Long-term Liabilities | $0 | $0 | $0 | $0 | $0 | $0 | $0 | $0 | $0 | $0 | $0 | $0 | $0 |
| Total Liabilities | $0 | $2,175 | $2,263 | $2,326 | $2,544 | $2,581 | $2,768 | $2,723 | $2,721 | $2,881 | $2,922 | $2,960 | $3,066 |
| Paid-in Capital | $66,000 | $66,000 | $66,000 | $66,000 | $66,000 | $66,000 | $66,000 | $66,000 | $66,000 | $66,000 | $66,000 | $66,000 | $66,000 |
| Retained Earnings | ($2,450) | ($2,450) | ($2,450) | ($2,450) | ($2,450) | ($2,450) | ($2,450) | ($2,450) | ($2,450) | ($2,450) | ($2,450) | ($2,450) | ($2,450) |
| Earnings | $0 | ($10,311) | ($18,898) | ($26,234) | ($33,137) | ($39,309) | ($41,795) | ($45,166) | ($48,575) | ($48,842) | ($48,311) | ($47,043) | ($43,690) |
| Total Capital | $63,550 | $53,239 | $44,652 | $37,316 | $30,413 | $24,241 | $21,755 | $18,384 | $14,975 | $14,708 | $15,239 | $16,507 | $19,860 |
| Total Liabilities and Capital | $63,550 | $55,414 | $46,915 | $39,643 | $32,956 | $26,822 | $24,523 | $21,108 | $17,696 | $17,589 | $18,161 | $19,467 | $22,926 |
| Net Worth | $63,550 | $53,239 | $44,652 | $37,316 | $30,413 | $24,241 | $21,755 | $18,384 | $14,975 | $14,708 | $15,239 | $16,507 | $19,860 |

