
Elsewares Promotional Products & Packaging
Executive Summary
Introduction
A market exists within the advertising specialty industry for velour and leatherette drawstring bags, eyeglass bags, jewelry bags & pen bags to hold various promotional products to increase their perceived value. Elsewares Promotional Products & Packaging (EPPP) has been established to supply these logo imprinted products to advertising specialty distributors who, in turn, market these products to the end user.
The Products
Elsewares intends to develop an inventory of unique products and drawstring packaging products that can add perceived value to those products. These products, which will be sourced from Mexico and the Far East, will be imprinted in-house with various company logos before they are shipped to the distributors.
By joining the Advertising Specialties Institute trade association, Elsewares will have print and electronic access to a network of 13,000 to 14,000 ASI-listed advertising specialty distributors, part of a $7 billion a year industry. This ranks only behind television and newsprint in terms of advertising dollars spent. Elsewares will market their products exclusively through these distributors and will not sell directly to end users. Elsewares intends to reach those distributors through advertisements in trade publications, through an in-house sales force, and a network of salaried and commission-based sales reps.
Concurrent with our campaign to market these packaging products, we will showcase our line of unique promotional products to the same distributors, thus giving ourselves three sales opportunities: the sale of the promotional product by itself; the sale of some packaging products that the distributor can use with promotional items that are purchased from other suppliers; and the sale of our promotional product coupled with our packaging.
The Market
Sales in the advertising specialties industry have been growing at a rate of almost 7% per year for the past decade and reached over $7 billion in sales last year. This is a very mature industry that is crowded with suppliers and distributors. Within that industry, the three suppliers that offer only velour and leatherette drawstring bags did a combined $2,500,000 in sales. Those three suppliers are located on the East Coast while some of largest advertising specialty distributors in the industry are Midwest and West Coast firms. We feel that by concentrating our efforts on marketing to the West Coast distributors, many of which already have had positive business relationships with our personnel, we will acquire a significant market share of the packaging niche over the next three years.
Financial Considerations
A portion of our initial startup costs will be used to purchase inventory, office equipment, and imprinting machinery. The balance will be used for catalog costs and initial advertising expenses. Additionally, we project the need for additional financial commitment to finance receivables and payroll expenses for the first 12 months of operation.
Elsewares intends to concentrate its sales force in the western United States and to reach a respectable sales level by the end of Year 2. With our per month fixed cost estimate and anticipated monthly unit sales we should hit running monthly break-even after the fourth month.
Elsewares is seeking a financial package based on a note due in five years, but amortized over 15 years. The note will be personally guaranteed by the founder’s assets. By amortizing the note over 15 years, the company will be afforded the opportunity to establish a healthy track record which will enable the company to seek alternate financing for the balance. It should be noted that the owners of Elsewares do not intend to take any profits out of the business until the long-term debt has been satisfied. Whatever profits remain after the above debt payments will be used to finance growth, mainly through the acquisition of additional inventory.

1.1 Objectives
Presently, the three leading suppliers of imprinted pouches to advertising specialty distributors are located on the East Coast and are doing a combined $2,500,000 solely in the sales of pouches. Elsewares intends to concentrate its sales force in the western United States and to reach a respectable sales level by the end of Year 2. Elsewares intends to factor our growth by diversifying into unique promotional product offerings which will be attractive as advertising specialties in their own right, or packaged in a drawstring pouch which we can also provide.
1.2 Mission
Elsewares intends to develop an inventory of unique products and drawstring packaging products that can add perceived value to those products. These products, which will be sourced from Mexico and the Far East, will be imprinted in-house with various company logos before they are shipped to the distributors.
By joining the Advertising Specialties Institute trade association, Elsewares will have print and electronic access to a network of 13,000 to 14,000 ASI-listed advertising specialty distributors, part of a $7 billion a year industry. This ranks only behind television and newsprint in terms of advertising dollars spent. Elsewares will market their products exclusively through these distributors and will not sell directly to end users. Elsewares intends to reach those distributors through advertisements in trade publications, through an in-house sales force, and a network of salaried and commission-based sales reps.
1.3 Keys to Success
Elsewares management believes that it has the right products and the right people to attract a loyal customer base. But most importantly, it is our business philosophy that will ensure success. The advertising specialty industry demands that products be delivered on time and with high quality imprinting. Pursuant to these demands:
Elsewares will satisfy this demand by maintaining acceptable inventory levels that will be delivered on time according to pre-arranged shipping schedules.
Elsewares will institute a quality control procedure for overseeing the on-site imprinting facility to ensure an acceptable imprint quality.
In addition to offering a complete line of velour packaging products, Elsewares will offer a unique line of promotional products that will encourage advertising specialty distributors to think of our company first when looking for original products.
Company Summary
Elsewares is a new company to be established based on this plan.
2.1 Start-up Summary
Our initial startup costs will include the purchase of inventory, office equipment, and imprinting machinery, as well as catalog costs and initial advertising expenses. Additionally, we project the need for a further financial commitment to finance receivables and payroll expenses for the first 12 months of operation.
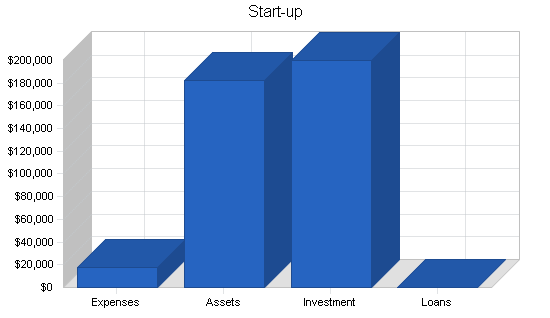
| Start-up Funding | |
| Start-up Expenses to Fund | $17,600 |
| Start-up Assets to Fund | $182,400 |
| Total Funding Required | $200,000 |
| Assets | |
| Non-cash Assets from Start-up | $65,000 |
| Cash Requirements from Start-up | $117,400 |
| Additional Cash Raised | $0 |
| Cash Balance on Starting Date | $117,400 |
| Total Assets | $182,400 |
| Liabilities and Capital | |
| Liabilities | |
| Current Borrowing | $0 |
| Long-term Liabilities | $0 |
| Accounts Payable (Outstanding Bills) | $0 |
| Other Current Liabilities (interest-free) | $0 |
| Total Liabilities | $0 |
| Capital | |
| Planned Investment | |
| Owner | $0 |
| Investor | $200,000 |
| Additional Investment Requirement | $0 |
| Total Planned Investment | $200,000 |
| Loss at Start-up (Start-up Expenses) | ($17,600) |
| Total Capital | $182,400 |
| Total Capital and Liabilities | $182,400 |
| Total Funding | $200,000 |
| Start-up | |
| Requirements | |
| Start-up Expenses | |
| Legal | $1,500 |
| Stationery etc. | $700 |
| Brochures | $4,000 |
| Consultants | $1,200 |
| Insurance | $600 |
| Rent | $9,000 |
| Accounting | $600 |
| Other | $0 |
| Total Start-up Expenses | $17,600 |
| Start-up Assets | |
| Cash Required | $117,400 |
| Start-up Inventory | $40,000 |
| Other Current Assets | $20,000 |
| Long-term Assets | $5,000 |
| Total Assets | $182,400 |
| Total Requirements | $200,000 |
2.2 Company Locations and Facilities
This is proprietary information, omitted on this sample plan, not relevant for purpose of examples.
2.3 Company Ownership
This is proprietary information, omitted on this sample plan.
Products
The product and service description in this sample plan has been omitted because it contains proprietary and strategic information. In the original plan, products and services were described in detail.
3.1 Product Description
The product and service description in this sample plan has been omitted because it contains proprietary and strategic information. In the original plan, products and services were described in detail.

3.2 Competitive Comparison
The product and service description in this sample plan has been omitted because it contains proprietary and strategic information. In the original plan, products and services were described in detail.
3.3 Sourcing
The product and service description in this sample plan has been omitted because it contains proprietary and strategic information. In the original plan, products and services were described in detail.
3.4 Technology
The product and service description in this sample plan has been omitted because it contains proprietary and strategic information. In the original plan, products and services were described in detail.
3.5 Future Products
The product and service description in this sample plan has been omitted because it contains proprietary and strategic information. In the original plan, products and services were described in detail.
3.6 Sales Literature
The product and service description in this sample plan has been omitted because it contains proprietary and strategic information. In the original plan, products and services were described in detail.
Market Analysis Summary
By definition, the advertising specialties industry deals with the sale of promotional products. These products can be practical, informative, entertaining and/or decorative products most often imprinted with the sponsoring advertiser’s name, logo, slogan, or message, and almost always retained and appreciated by the end recipients who received them free of charge.
Sales in the advertising specialties industry have been growing at a rate of almost 7% per year since 1988 and reached over $7 billion in sales last year. Within that industry, the three suppliers that offer only velour and leatherette drawstring bags did a combined $2,500,000 in sales. Those three suppliers are located on the East Coast while some of largest advertising specialty distributors in the industry are Midwest and West Coast firms. We feel that by concentrating our efforts on marketing to the West Coast distributors, many of which already have had positive business relationships with our personnel, we will acquire a significant market share of the packaging niche over the next three years.
Concurrent with our campaign to market these packaging products, we will showcase our line of unique promotional products to the same distributors, thus giving ourselves three sales opportunities: the sale of the promotional product by itself; the sale of some packaging products that the distributor can use with promotional items that are purchased from other suppliers; and the sale of our promotional product coupled with our packaging.
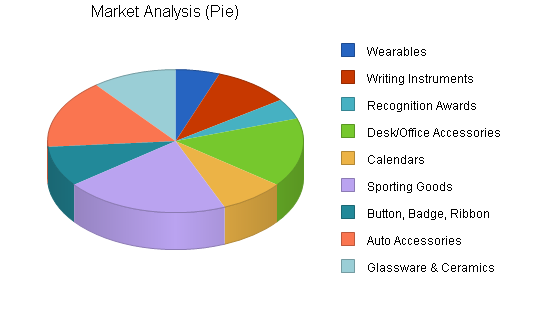
4.1 Market Segmentation
Below are the major product segments of the advertising specialties market and their corresponding percentage of the total market as measured by large distributor dollar sales:
- Wearables [i.e. T-shirts, jackets, & caps]: 22.2%
- Writing Instruments [i.e. pens & pencils]: 13.1%
- Glassware & Ceramics [i.e. mugs]: 9.9%
- Recognition Awards [i.e. trophies, plaques, emblematic jewelry]: 9.8%
- Desk & Office Accessories: 9.2%
- Calendars: 7.8%
- Sporting Goods and Leisure Products: 6.9%
- Buttons, Badges, & Ribbons: 6.8%
- Auto Accessories [i.e. key fobs, sun screens]: 4.2%
There are presently some 2,800 suppliers listed by ASI that are selling over 390,000 different promotional products to over 13,000 advertising specialty distributors. This ASI listed distributor network serves as a large sales force for the suppliers by actively selling promotional products to the public and then directing that business to ASI listed suppliers with whom they are familiar. The ASI listed distributors offer the suppliers’ products to a multi-segmented end-user market. Below are the major segments of this market listed in order of size as measured by dollars spent:
- Clubs, Associations, & Civic Groups
- Financial [i.e. banks, investor groups, financial professionals]
- Schools and Colleges
- Service Businesses
- Insurance Agencies
- Retail Stores
- Industrial Products Companies
| Market Analysis | |||||||
| Year 1 | Year 2 | Year 3 | Year 4 | Year 5 | |||
| Potential Customers | Growth | CAGR | |||||
| Wearables | 12% | 12,000 | 13,440 | 15,053 | 16,859 | 18,882 | 12.00% |
| Writing Instruments | 22% | 21,000 | 25,620 | 31,256 | 38,132 | 46,521 | 22.00% |
| Recognition Awards | 10% | 10,000 | 11,000 | 12,100 | 13,310 | 14,641 | 10.00% |
| Desk/Office Accessories | 9% | 34,000 | 37,060 | 40,395 | 44,031 | 47,994 | 9.00% |
| Calendars | 8% | 18,000 | 19,440 | 20,995 | 22,675 | 24,489 | 8.00% |
| Sporting Goods | 7% | 45,000 | 48,150 | 51,521 | 55,127 | 58,986 | 7.00% |
| Button, Badge, Ribbon | 7% | 20,000 | 21,400 | 22,898 | 24,501 | 26,216 | 7.00% |
| Auto Accessories | 4% | 34,000 | 35,360 | 36,774 | 38,245 | 39,775 | 4.00% |
| Glassware & Ceramics | 10% | 23,000 | 25,300 | 27,830 | 30,613 | 33,674 | 10.00% |
| Other | 0% | 0 | 0 | 0 | 0 | 0 | 0.00% |
| Total | 9.43% | 217,000 | 236,770 | 258,822 | 283,493 | 311,178 | 9.43% |
4.2 Industry Analysis
As you may expect, we will be entering a very mature industry that is crowded with suppliers and distributors. As with any product-oriented business, it is important to maintain a competitively priced product line. The safest way to increase overall margins will be to continuously introduce new products which will remain exclusive offerings for a period of time. When the competition has found a way to source similar products, the margins will adjust downward, driven by competitive market forces. It will be critical for Elsewares to keep one step ahead of the competition by having a new product ready for introduction when the margins slip. Thus, a new cycle of discovery will begin. We intend to be the originators and not the imitators.
Service and support may actually be more important to a majority of distributors than price points. After all, they are putting their reputations on the line when they afford our company the opportunity to fulfill their clients needs. On-time delivery of quality imprinted product will be crucial to our success.
Strategy and Implementation Summary
Our marketing strategy is to get our foot in the distributor’s door by offering them drawstring pouches as packaging products to add to the perceived value and profit on the promotional products they have already sold. Once we have established a business relationship and they have had a positive customer service experience with our company, we intend to offer them products in addition to the packaging items.
5.1 Marketing Strategy
We intend to focus on Midwest and West Coast distributors who have had to look to the East Coast as the only source of supply for their bag needs. Along with our on-time shipping commitment, we will focus on the quality and durability of our imprinting process, guaranteeing their quality so that distributors can ensure their clients that their message will be around for a while.
5.1.1 Promotion Strategy
All advertising will be disseminated through ASI publications. This will pinpoint the only market that we are attempting to reach, ASI listed distributors. We must market the product successfully to the distributor so that it is appealing enough for him to turn around and market it to the end user.
5.1.2 Distribution Strategy
Elsewares will sell its products exclusively through ASI listed distributors. Because many specialty advertising distributors are wary of doing business with suppliers whom they believe to be “dealing direct”, all direct inquiries will be directed to a distributor with whom we already have a business relationship. Distributors invest a significant portion of their selling time to finding, screening and qualifying specialty advertising buyers and convincing them that the suppliers products have a place and purpose in their activities, and are consequently predisposed to avoid doing business with suppliers who compete with them.
5.1.3 Service and Support
Offering the highest level of customer service to our distributor network will be crucial to Elsewares’ long-term success. Logo imprints will have to be of the highest quality and product shipping deadlines must be met. Because products will always be bought for a specific event or promotion, it will be important to support the distributors in resolving any legitimate conflicts between them and the end user.
5.1.4 Marketing Programs
Our main marketing program will revolve around the placement of our full line, full color catalog and price list in The Counselor which is the industry’s leading trade magazine of news, new products and market trends. This magazine is mailed to the over 13,0000 advertising specialty distributors listed with ASI. Reprints, with additional information about our company, will be mailed out approximately two weeks later to these same distributors as well as our own sales reps, offering samples of both our products and imprinting capabilities.
Secondly, the same catalog will be placed in the next annual edition of Media File which is a compilation of full page ads of participating suppliers. This catalog is sent to the ASI distributors who in turn give it to their sales people to use when offering various products to the end user. In some cases, distributors also give these catalogs to buyers who do a large volume of business with them.
Thirdly, as Elsewares brings new products into their line before the next annual catalog is printed and distributed, we will introduce these products to the advertising specialty industry through postcards featuring the product on one side and our mailing address on the other. These cards are bundled with other supplier cards for mailing and then bound into The Counselor magazine about six weeks later.
Elsewares will also only hire industry experienced sales reps of the highest caliber. In many cases, they will be the only representatives to call on distributors in person and will subsequently leave a lasting impression of our company. They will not be expected to close sales, but will be expected to represent our products in a competitive atmosphere. Their loyalty will be courted and rewarded through a compensation package combining both a salary and commission.
5.1.5 Pricing Strategy
In the fifty years of business experience that we have accumulated, one message rings true: someone can always beat you on price. Therefore, our pricing strategy is to be competitive within the various product categories, but not to rely on the selling price to overshadow the other advantages of doing business with our company. We will sell ourselves on the basis of a quality-made, unique product line which is reasonably priced and backed by an extraordinary customer service department. The products will be checked prior to shipment and all promised shipping deadlines will be met.
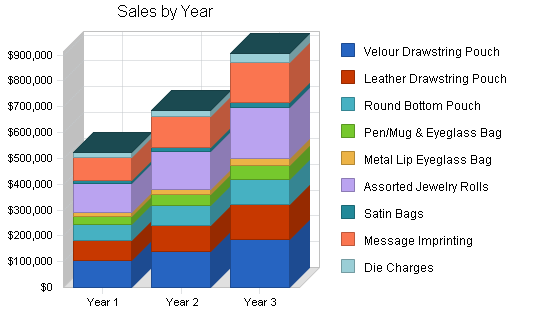
5.2 Sales Strategy
Because Elsewares is a new entity, we understand that we will have to prove our company’s worth to distributors in order to earn their respect and business. Elsewares will promptly honor all dealer requests for product and imprinting samples. We will offer a toll-free 800 number phone line and have a full-time, dedicated customer service person to meet distributors’ needs.
While the network of sales reps is bringing our product line to the attention of the ASI listed distributors, our in-house sales department will be calling on some of the larger West Coast distributors. We have hired a consultant who has had ongoing business relationships with many of these distributors over the last 24 years and we are counting on him to help us meet our sales objectives right from the start.

| Sales Forecast | |||
| Year 1 | Year 2 | Year 3 | |
| Unit Sales | |||
| Velour Drawstring Pouch | 479,000 | 574,800 | 689,760 |
| Leather Drawstring Pouch | 216,000 | 259,200 | 311,040 |
| Round Bottom Pouch | 75,000 | 90,000 | 108,000 |
| Pen/Mug & Eyeglass Bag | 60,000 | 72,000 | 86,400 |
| Metal Lip Eyeglass Bag | 25,000 | 30,000 | 36,000 |
| Assorted Jewelry Rolls | 22,500 | 27,000 | 32,400 |
| Satin Bags | 24,250 | 29,100 | 34,920 |
| Message Imprinting | 900,750 | 1,080,900 | 1,297,080 |
| Die Charges | 495 | 618 | 742 |
| Other | 0 | 0 | 0 |
| Total Unit Sales | 1,802,995 | 2,163,618 | 2,596,342 |
| Unit Prices | Year 1 | Year 2 | Year 3 |
| Velour Drawstring Pouch | $0.22 | $0.24 | $0.27 |
| Leather Drawstring Pouch | $0.36 | $0.40 | $0.44 |
| Round Bottom Pouch | $0.80 | $0.84 | $0.88 |
| Pen/Mug & Eyeglass Bag | $0.54 | $0.59 | $0.65 |
| Metal Lip Eyeglass Bag | $0.60 | $0.66 | $0.73 |
| Assorted Jewelry Rolls | $5.00 | $5.50 | $6.05 |
| Satin Bags | $0.44 | $0.48 | $0.53 |
| Message Imprinting | $0.10 | $0.11 | $0.12 |
| Die Charges | $37.50 | $41.25 | $45.38 |
| Other | $0.00 | $0.00 | $0.24 |
| Sales | |||
| Velour Drawstring Pouch | $105,380 | $137,952 | $186,235 |
| Leather Drawstring Pouch | $77,760 | $103,680 | $136,858 |
| Round Bottom Pouch | $60,000 | $75,600 | $95,040 |
| Pen/Mug & Eyeglass Bag | $32,400 | $42,480 | $56,160 |
| Metal Lip Eyeglass Bag | $15,000 | $19,800 | $26,280 |
| Assorted Jewelry Rolls | $112,500 | $148,500 | $196,020 |
| Satin Bags | $10,670 | $13,968 | $18,508 |
| Message Imprinting | $90,075 | $118,899 | $155,650 |
| Die Charges | $18,563 | $25,493 | $33,672 |
| Other | $0 | $0 | $0 |
| Total Sales | $522,348 | $686,372 | $904,422 |
| Direct Unit Costs | Year 1 | Year 2 | Year 3 |
| Velour Drawstring Pouch | $0.11 | $0.12 | $0.12 |
| Leather Drawstring Pouch | $0.18 | $0.19 | $0.20 |
| Round Bottom Pouch | $0.40 | $0.42 | $0.44 |
| Pen/Mug & Eyeglass Bag | $0.27 | $0.28 | $0.30 |
| Metal Lip Eyeglass Bag | $0.30 | $0.32 | $0.33 |
| Assorted Jewelry Rolls | $2.50 | $2.63 | $2.76 |
| Satin Bags | $0.22 | $0.23 | $0.24 |
| Message Imprinting | $0.07 | $0.07 | $0.08 |
| Die Charges | $25.00 | $26.25 | $27.56 |
| Other | $0.00 | $0.00 | $0.00 |
| Direct Cost of Sales | |||
| Velour Drawstring Pouch | $52,690 | $68,976 | $82,771 |
| Leather Drawstring Pouch | $38,880 | $49,248 | $62,208 |
| Round Bottom Pouch | $30,000 | $37,800 | $47,520 |
| Pen/Mug & Eyeglass Bag | $16,200 | $20,160 | $25,920 |
| Metal Lip Eyeglass Bag | $7,500 | $9,600 | $11,880 |
| Assorted Jewelry Rolls | $56,250 | $71,010 | $89,424 |
| Satin Bags | $5,335 | $6,693 | $8,381 |
| Message Imprinting | $63,053 | $75,663 | $103,766 |
| Die Charges | $12,375 | $16,223 | $20,450 |
| Other | $0 | $0 | $0 |
| Subtotal Direct Cost of Sales | $282,283 | $355,373 | $452,320 |
5.3 Strategic Alliances
The performance of Elsewares will be indelibly linked to the performance of the distributors that purchase our product. It is therefore paramount to the fulfillment of our business objectives that we cultivate customer loyalty with a network of distributors that are both credit worthy and active in selling the types of products we offer. The Advertising Specialty Institute offers suppliers a subscription to a market and credit service that will help us to pinpoint our marketing effort along those lines.
5.4 Milestones
Sample Milestones topic text.
The milestones table and chart show the specific detail about actual program activities that should be taking place during the year. Each one has its manager, starting date, ending date, and budget. During the year we will be keeping track of implementation against plan, with reports on the timely completion of these activities as planned.
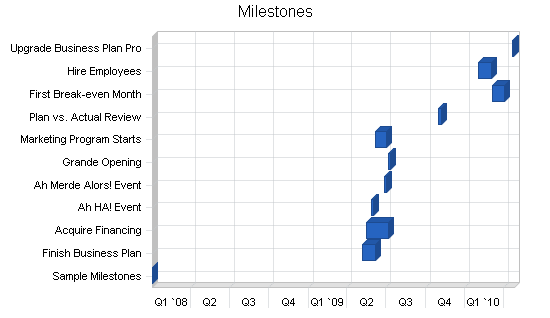
| Milestones | |||||
| Milestone | Start Date | End Date | Budget | Manager | Department |
| Sample Milestones | 1/4/2008 | 1/4/2008 | $0 | ABC | Department |
| Finish Business Plan | 5/7/2009 | 6/6/2009 | $100 | Dude | Boss |
| Acquire Financing | 5/17/2009 | 7/6/2009 | $200 | Dudette | Legumers |
| Ah HA! Event | 5/27/2009 | 6/1/2009 | $60 | Marianne | Bosses |
| Ah Merde Alors! Event | 6/26/2009 | 7/1/2009 | $250 | Marionette | Bouc émissaire |
| Grande Opening | 7/6/2009 | 7/11/2009 | $500 | Gloworm | Nobs |
| Marketing Program Starts | 6/6/2009 | 7/1/2009 | $1,000 | Glower | Marketeers |
| Plan vs. Actual Review | 11/1/2009 | 11/8/2009 | $0 | Galore | Alles |
| First Break-even Month | 3/5/2010 | 4/4/2010 | $0 | Bouys | Salers |
| Hire Employees | 2/1/2010 | 3/3/2010 | $150 | Gulls | HRM |
| Upgrade Business Plan Pro | 4/22/2010 | 4/24/2010 | $100 | Brass | Bossies |
| Totals | $2,360 | ||||
Management Summary
Elsewares is organized into three main functional areas: product sourcing, sales, and marketing; production and shipping; and finance and administration.
Edie Greenbaum: President and founder. Mrs. Greenbaum ran the financial department for a start-up retail operation whose sales rose to just under one million dollars in seven years. She has also spent the last year and a half heading up the sales department of an ASI listed advertising specialties supplier. Mrs. Greenbaum holds a B.A. from U.C.L.A., is married, and is the mother of one child.
Gary Greenbaum: Co-founder. Mr. Greenbaum ran the day-to-day operations of the previously mentioned retail operation as a partner with Mrs. Greenbaum. Mr. Greenbaum holds a B.A. from Franklin & Marshal College, is married, and is the father of one child.
Marvin Rosenbaum: Consultant. Mr. Rosenbaum has been associated with the Advertising Specialties industry for just under 25 years and holds the credentials of a C.A.S. or Certified Advertising Specialist. Over the years, Mr. Rosenbaum has been hired by both suppliers and distributors that are either starting a new company, as we are, or that are attempting to penetrate the advertising specialties market with products they are already distributing to other markets. Mr. Rosenbaum has been responsible for the successful entry of many companies into this industry and has maintained extensive business contacts with many of the industry leaders. Mr. Rosenbaum is married and is the father of two children.
6.1 Personnel Plan
The cornerstone of the personnel plan is to maximize production and minimize the labor burden on the company’s operating expenses. Pursuant to that goal, the initial payroll will consist of the following disbursements:
Until increases in sales can support additional salaries, Edie Greenbaum will oversee the operations of Elsewares in an unsalaried position. Mrs. Greenbaum will be responsible for the day-to-day operations including personnel company policies, as well as overseeing the sales and marketing departments.
The sales and marketing department will be headed by Marvin Rosenbaum who has been hired as an independent consultant. Mr. Rosenbaum will be responsible for initiating new leads with the ASI distributor network and for re-establishing existing contacts with distributors with whom he has had a previous business relationship. Mr. Rosenbaum will also oversee the network of commissions based sales reps who will call on distributors in their pre-assigned territories. The sales department will be supplemented by Edie Greenbaum, who will also be responsible for calling on distributors as directed by Mr. Rosenbaum.
Mr. Greenbaum will be responsible for running the customer service department, which will include handling phone orders and catalog requests. Additionally, Mr. Greenbaum will be responsible for running the company’s computer operations and is expected to play an important role in sourcing new products.
Until increases in sales justify the additional staffing of this department, Mr. Greenbaum will be responsible for assorted secretarial duties in addition to the previously mentioned duties. We are projecting the division of this department into two positions at approximately the fourteenth month of business. Mr. Greenbaum will then shift his duties to marketing and sourcing, and a new employee will take over the customer service department and its related duties.
Elsewares will rely on part-time help for its imprinting, warehousing, and shipping labor requirements. Naturally, as the need arises, this all-encompassing area will be split into two departments. A full-time production person will run the imprinting department, while a second person will be hired to handle both shipping and receiving. We are projecting the need for this additional labor burden at approximately the eleventh month of business.
| Personnel Plan | |||
| Year 1 | Year 2 | Year 3 | |
| Production Personnel | |||
| Imprint | $14,000 | $15,000 | $16,000 |
| Shipping | $14,000 | $15,000 | $16,000 |
| Name or Title or Group | $0 | $0 | $0 |
| Subtotal | $28,000 | $30,000 | $32,000 |
| Sales and Marketing Personnel | |||
| Marvin | $30,000 | $33,000 | $36,000 |
| Sales Reps | $24,000 | $26,000 | $28,000 |
| Name or Title or Group | $0 | $0 | $0 |
| Subtotal | $54,000 | $59,000 | $64,000 |
| General and Administrative Personnel | |||
| Customer Service | $36,000 | $40,000 | $45,000 |
| Name or Title or Group | $0 | $0 | $0 |
| Name or Title or Group | $0 | $0 | $0 |
| Subtotal | $36,000 | $40,000 | $45,000 |
| Other Personnel | |||
| Name or Title or Group | $0 | $0 | $0 |
| Name or Title or Group | $0 | $0 | $0 |
| Name or Title or Group | $0 | $0 | $0 |
| Subtotal | $0 | $0 | $0 |
| Total People | 0 | 0 | 0 |
| Total Payroll | $118,000 | $129,000 | $141,000 |
Financial Plan
Elsewares is seeking a financial package based on a note due in five years, but amortized over 15 years. The note will be personally guaranteed by the Greenbaums’ assets. By amortizing the note over 15 years, the company will be afforded the opportunity to establish a healthy track record which will enable the company to seek alternate financing for the balance. In light of that strategy, Elsewares proposes the following payback schedule:
- Months 1-12: No payback of principal or interest
- Months 13-24: 15% interest plus 10% net profit
- Months 25-48: 10% interest plus 15% net profit
- Months 49-60: 10% interest plus 20% net profit
It should be noted that the owners of Elsewares do not intend to take any profits out of the business until the long-term debt has been satisfied. Whatever profits remain after the above debt payments will be used to finance growth, mainly through the acquisition of additional inventory.
7.1 Important Assumptions
General assumptions for this plan are on the following table.
| General Assumptions | |||
| Year 1 | Year 2 | Year 3 | |
| Plan Month | 1 | 2 | 3 |
| Current Interest Rate | 10.00% | 10.00% | 10.00% |
| Long-term Interest Rate | 10.00% | 10.00% | 10.00% |
| Tax Rate | 0.00% | 0.00% | 0.00% |
| Other | 0 | 0 | 0 |
7.2 Key Financial Indicators
The most important indicator in our case is inventory turnover. We have to make sure that our inventory of drawstring bags and any other packaging products turns over a minimum of five times to avoid a negative impact on our cost of goods sold and on our cash flow.
- Collection Days: These are very important. It may be necessary to implement a variety of payment terms with different distributors, depending on their payment history. In extreme cases, prepayment of orders may be the only extendible terms. We will rely heavily on our subscription to the ASI Credit Service for this valuable pre-sale information.
- Gross Margins: We must maintain gross margins of 90% at the least, and hold marketing costs to no more than 20% of sales.

7.3 Break-even Analysis
The following table and chart illustrate our break-even analysis with our per month fixed cost estimate, and what we need to sell to break-even in a month. Given the estimates, we hit running monthly break-even after the fourth month.

| Break-even Analysis | |
| Monthly Units Break-even | 150,522 |
| Monthly Revenue Break-even | $43,608 |
| Assumptions: | |
| Average Per-Unit Revenue | $0.29 |
| Average Per-Unit Variable Cost | $0.16 |
| Estimated Monthly Fixed Cost | $20,042 |
7.4 Projected Profit and Loss
The following table shows the projected profits. Monthly projections are included in the appendix.


| Pro Forma Profit and Loss | |||
| Year 1 | Year 2 | Year 3 | |
| Sales | $522,348 | $686,372 | $904,422 |
| Direct Cost of Sales | $282,283 | $355,373 | $452,320 |
| Production Payroll | $28,000 | $30,000 | $32,000 |
| Other Costs of Sales | $0 | $0 | $0 |
| Total Cost of Sales | $310,283 | $385,373 | $484,320 |
| Gross Margin | $212,065 | $300,999 | $420,102 |
| Gross Margin % | 40.60% | 43.85% | 46.45% |
| Operating Expenses | |||
| Sales and Marketing Expenses | |||
| Sales and Marketing Payroll | $54,000 | $59,000 | $64,000 |
| Advertising/Promotion | $44,000 | $48,400 | $53,240 |
| Travel | $18,900 | $20,790 | $22,869 |
| Miscellaneous | $6,000 | $6,600 | $7,260 |
| Other Sales and Marketing Expenses | $0 | $0 | $0 |
| Total Sales and Marketing Expenses | $122,900 | $134,790 | $147,369 |
| Sales and Marketing % | 23.53% | 19.64% | 16.29% |
| General and Administrative Expenses | |||
| General and Administrative Payroll | $36,000 | $40,000 | $45,000 |
| Marketing/Promotion | $0 | $0 | $0 |
| Depreciation | $0 | $0 | $0 |
| Rent | $36,000 | $39,600 | $43,560 |
| Utilities | $42,000 | $46,200 | $50,820 |
| Insurance | $3,600 | $3,960 | $4,356 |
| Payroll Taxes | $0 | $0 | $0 |
| Other General and Administrative Expenses | $0 | $0 | $0 |
| Total General and Administrative Expenses | $117,600 | $129,760 | $143,736 |
| General and Administrative % | 22.51% | 18.91% | 15.89% |
| Other Expenses: | |||
| Other Payroll | $0 | $0 | $0 |
| Consultants | $0 | $0 | $0 |
| Other Expenses | $0 | $0 | $0 |
| Total Other Expenses | $0 | $0 | $0 |
| Other % | 0.00% | 0.00% | 0.00% |
| Total Operating Expenses | $240,500 | $264,550 | $291,105 |
| Profit Before Interest and Taxes | ($28,435) | $36,449 | $128,997 |
| EBITDA | ($28,435) | $36,449 | $128,997 |
| Interest Expense | $1,042 | $13,750 | $25,000 |
| Taxes Incurred | $0 | $0 | $0 |
| Net Profit | ($29,477) | $22,699 | $103,997 |
| Net Profit/Sales | -5.64% | 3.31% | 11.50% |
7.5 Projected Cash Flow
The following table shows cash flow for the three years, and the chart illustrates monthly cash flow in the first year. Monthly cash flow projections are included in the appendix.

| Pro Forma Cash Flow | |||
| Year 1 | Year 2 | Year 3 | |
| Cash Received | |||
| Cash from Operations | |||
| Cash Sales | $0 | $0 | $0 |
| Cash from Receivables | $329,034 | $625,669 | $823,725 |
| Subtotal Cash from Operations | $329,034 | $625,669 | $823,725 |
| Additional Cash Received | |||
| Sales Tax, VAT, HST/GST Received | $0 | $0 | $0 |
| New Current Borrowing | $75,000 | $125,000 | $100,000 |
| New Other Liabilities (interest-free) | $0 | $0 | $0 |
| New Long-term Liabilities | $0 | $0 | $0 |
| Sales of Other Current Assets | $0 | $0 | $0 |
| Sales of Long-term Assets | $0 | $0 | $0 |
| New Investment Received | $100,000 | $0 | $0 |
| Subtotal Cash Received | $504,034 | $750,669 | $923,725 |
| Expenditures | Year 1 | Year 2 | Year 3 |
| Expenditures from Operations | |||
| Cash Spending | $118,000 | $129,000 | $141,000 |
| Bill Payments | $388,415 | $568,478 | $668,840 |
| Subtotal Spent on Operations | $506,415 | $697,478 | $809,840 |
| Additional Cash Spent | |||
| Sales Tax, VAT, HST/GST Paid Out | $0 | $0 | $0 |
| Principal Repayment of Current Borrowing | $0 | $0 | $0 |
| Other Liabilities Principal Repayment | $0 | $0 | $0 |
| Long-term Liabilities Principal Repayment | $0 | $0 | $0 |
| Purchase Other Current Assets | $0 | $0 | $0 |
| Purchase Long-term Assets | $0 | $0 | $0 |
| Dividends | $0 | $0 | $0 |
| Subtotal Cash Spent | $506,415 | $697,478 | $809,840 |
| Net Cash Flow | ($2,381) | $53,191 | $113,885 |
| Cash Balance | $115,019 | $168,210 | $282,094 |
7.6 Projected Balance Sheet
The projected balance sheet is shown in the following table, with monthly projections in the appendix.
| Pro Forma Balance Sheet | |||
| Year 1 | Year 2 | Year 3 | |
| Assets | |||
| Current Assets | |||
| Cash | $115,019 | $168,210 | $282,094 |
| Accounts Receivable | $193,314 | $254,016 | $334,714 |
| Inventory | $58,451 | $73,586 | $93,660 |
| Other Current Assets | $20,000 | $20,000 | $20,000 |
| Total Current Assets | $386,784 | $515,812 | $730,469 |
| Long-term Assets | |||
| Long-term Assets | $5,000 | $5,000 | $5,000 |
| Accumulated Depreciation | $0 | $0 | $0 |
| Total Long-term Assets | $5,000 | $5,000 | $5,000 |
| Total Assets | $391,784 | $520,812 | $735,469 |
| Liabilities and Capital | Year 1 | Year 2 | Year 3 |
| Current Liabilities | |||
| Accounts Payable | $63,860 | $45,190 | $55,849 |
| Current Borrowing | $75,000 | $200,000 | $300,000 |
| Other Current Liabilities | $0 | $0 | $0 |
| Subtotal Current Liabilities | $138,860 | $245,190 | $355,849 |
| Long-term Liabilities | $0 | $0 | $0 |
| Total Liabilities | $138,860 | $245,190 | $355,849 |
| Paid-in Capital | $300,000 | $300,000 | $300,000 |
| Retained Earnings | ($17,600) | ($47,077) | ($24,378) |
| Earnings | ($29,477) | $22,699 | $103,997 |
| Total Capital | $252,923 | $275,622 | $379,619 |
| Total Liabilities and Capital | $391,784 | $520,812 | $735,469 |
| Net Worth | $252,923 | $275,622 | $379,619 |
7.7 Business Ratios
The table shows projected business ratios. The Industry Profile columns show statistics for Standard Industry Code (SIC) #5199, Nondurable Goods.
| Ratio Analysis | ||||
| Year 1 | Year 2 | Year 3 | Industry Profile | |
| Sales Growth | 0.00% | 31.40% | 31.77% | 6.22% |
| Percent of Total Assets | ||||
| Accounts Receivable | 49.34% | 48.77% | 45.51% | 25.36% |
| Inventory | 14.92% | 14.13% | 12.73% | 29.49% |
| Other Current Assets | 5.10% | 3.84% | 2.72% | 32.72% |
| Total Current Assets | 98.72% | 99.04% | 99.32% | 87.57% |
| Long-term Assets | 1.28% | 0.96% | 0.68% | 12.43% |
| Total Assets | 100.00% | 100.00% | 100.00% | 100.00% |
| Current Liabilities | 35.44% | 47.08% | 48.38% | 40.17% |
| Long-term Liabilities | 0.00% | 0.00% | 0.00% | 13.54% |
| Total Liabilities | 35.44% | 47.08% | 48.38% | 53.71% |
| Net Worth | 64.56% | 52.92% | 51.62% | 46.29% |
| Percent of Sales | ||||
| Sales | 100.00% | 100.00% | 100.00% | 100.00% |
| Gross Margin | 40.60% | 43.85% | 46.45% | 20.49% |
| Selling, General & Administrative Expenses | 50.66% | 46.18% | 40.34% | 7.02% |
| Advertising Expenses | 8.41% | 7.40% | 6.17% | 0.70% |
| Profit Before Interest and Taxes | -5.44% | 5.31% | 14.26% | 1.79% |
| Main Ratios | ||||
| Current | 2.79 | 2.10 | 2.05 | 1.87 |
| Quick | 2.36 | 1.80 | 1.79 | 1.00 |
| Total Debt to Total Assets | 35.44% | 47.08% | 48.38% | 57.19% |
| Pre-tax Return on Net Worth | -11.65% | 8.24% | 27.40% | 4.61% |
| Pre-tax Return on Assets | -7.52% | 4.36% | 14.14% | 10.77% |
| Additional Ratios | Year 1 | Year 2 | Year 3 | |
| Net Profit Margin | -5.64% | 3.31% | 11.50% | n.a |
| Return on Equity | -11.65% | 8.24% | 27.40% | n.a |
| Activity Ratios | ||||
| Accounts Receivable Turnover | 2.70 | 2.70 | 2.70 | n.a |
| Collection Days | 54 | 119 | 119 | n.a |
| Inventory Turnover | 9.21 | 5.38 | 5.41 | n.a |
| Accounts Payable Turnover | 7.08 | 12.17 | 12.17 | n.a |
| Payment Days | 27 | 36 | 27 | n.a |
| Total Asset Turnover | 1.33 | 1.32 | 1.23 | n.a |
| Debt Ratios | ||||
| Debt to Net Worth | 0.55 | 0.89 | 0.94 | n.a |
| Current Liab. to Liab. | 1.00 | 1.00 | 1.00 | n.a |
| Liquidity Ratios | ||||
| Net Working Capital | $247,923 | $270,622 | $374,619 | n.a |
| Interest Coverage | -27.30 | 2.65 | 5.16 | n.a |
| Additional Ratios | ||||
| Assets to Sales | 0.75 | 0.76 | 0.81 | n.a |
| Current Debt/Total Assets | 35% | 47% | 48% | n.a |
| Acid Test | 0.97 | 0.77 | 0.85 | n.a |
| Sales/Net Worth | 2.07 | 2.49 | 2.38 | n.a |
| Dividend Payout | 0.00 | 0.00 | 0.00 | n.a |
Appendix
| Sales Forecast | |||||||||||||
| Month 1 | Month 2 | Month 3 | Month 4 | Month 5 | Month 6 | Month 7 | Month 8 | Month 9 | Month 10 | Month 11 | Month 12 | ||
| Unit Sales | |||||||||||||
| Velour Drawstring Pouch | 0% | 7,000 | 7,000 | 15,000 | 25,000 | 25,000 | 50,000 | 50,000 | 50,000 | 50,000 | 50,000 | 75,000 | 75,000 |
| Leather Drawstring Pouch | 0% | 1,500 | 1,500 | 3,000 | 5,000 | 5,000 | 10,000 | 10,000 | 10,000 | 10,000 | 10,000 | 75,000 | 75,000 |
| Round Bottom Pouch | 0% | 2,250 | 2,250 | 3,000 | 3,750 | 3,750 | 7,500 | 7,500 | 7,500 | 7,500 | 7,500 | 11,250 | 11,250 |
| Pen/Mug & Eyeglass Bag | 0% | 1,800 | 1,800 | 2,400 | 3,000 | 3,000 | 6,000 | 6,000 | 6,000 | 6,000 | 6,000 | 9,000 | 9,000 |
| Metal Lip Eyeglass Bag | 0% | 750 | 750 | 1,000 | 1,250 | 1,250 | 2,500 | 2,500 | 2,500 | 2,500 | 2,500 | 3,750 | 3,750 |
| Assorted Jewelry Rolls | 0% | 675 | 675 | 900 | 1,125 | 1,125 | 2,250 | 2,250 | 2,250 | 2,250 | 2,250 | 3,375 | 3,375 |
| Satin Bags | 0% | 750 | 750 | 1,000 | 1,250 | 1,250 | 2,500 | 2,500 | 2,500 | 2,500 | 2,500 | 3,375 | 3,375 |
| Message Imprinting | 0% | 14,725 | 14,725 | 25,300 | 40,375 | 40,375 | 80,750 | 80,750 | 80,750 | 80,750 | 80,750 | 180,750 | 180,750 |
| Die Charges | 0% | 20 | 20 | 25 | 30 | 30 | 50 | 50 | 50 | 50 | 50 | 60 | 60 |
| Other | 0% | 0 | 0 | 0 | 0 | 0 | 0 | 0 | 0 | 0 | 0 | 0 | 0 |
| Total Unit Sales | 29,470 | 29,470 | 51,625 | 80,780 | 80,780 | 161,550 | 161,550 | 161,550 | 161,550 | 161,550 | 361,560 | 361,560 | |
| Unit Prices | Month 1 | Month 2 | Month 3 | Month 4 | Month 5 | Month 6 | Month 7 | Month 8 | Month 9 | Month 10 | Month 11 | Month 12 | |
| Velour Drawstring Pouch | $0.22 | $0.22 | $0.22 | $0.22 | $0.22 | $0.22 | $0.22 | $0.22 | $0.22 | $0.22 | $0.22 | $0.22 | |
| Leather Drawstring Pouch | $0.36 | $0.36 | $0.36 | $0.36 | $0.36 | $0.36 | $0.36 | $0.36 | $0.36 | $0.36 | $0.36 | $0.36 | |
| Round Bottom Pouch | $0.80 | $0.80 | $0.80 | $0.80 | $0.80 | $0.80 | $0.80 | $0.80 | $0.80 | $0.80 | $0.80 | $0.80 | |
| Pen/Mug & Eyeglass Bag | $0.54 | $0.54 | $0.54 | $0.54 | $0.54 | $0.54 | $0.54 | $0.54 | $0.54 | $0.54 | $0.54 | $0.54 | |
| Metal Lip Eyeglass Bag | $0.60 | $0.60 | $0.60 | $0.60 | $0.60 | $0.60 | $0.60 | $0.60 | $0.60 | $0.60 | $0.60 | $0.60 | |
| Assorted Jewelry Rolls | $5.00 | $5.00 | $5.00 | $5.00 | $5.00 | $5.00 | $5.00 | $5.00 | $5.00 | $5.00 | $5.00 | $5.00 | |
| Satin Bags | $0.44 | $0.44 | $0.44 | $0.44 | $0.44 | $0.44 | $0.44 | $0.44 | $0.44 | $0.44 | $0.44 | $0.44 | |
| Message Imprinting | $0.10 | $0.10 | $0.10 | $0.10 | $0.10 | $0.10 | $0.10 | $0.10 | $0.10 | $0.10 | $0.10 | $0.10 | |
| Die Charges | $37.50 | $37.50 | $37.50 | $37.50 | $37.50 | $37.50 | $37.50 | $37.50 | $37.50 | $37.50 | $37.50 | $37.50 | |
| Other | $0.00 | $0.00 | $0.00 | $0.00 | $0.00 | $0.00 | $0.00 | $0.00 | $0.00 | $0.00 | $0.00 | $0.00 | |
| Sales | |||||||||||||
| Velour Drawstring Pouch | $1,540 | $1,540 | $3,300 | $5,500 | $5,500 | $11,000 | $11,000 | $11,000 | $11,000 | $11,000 | $16,500 | $16,500 | |
| Leather Drawstring Pouch | $540 | $540 | $1,080 | $1,800 | $1,800 | $3,600 | $3,600 | $3,600 | $3,600 | $3,600 | $27,000 | $27,000 | |
| Round Bottom Pouch | $1,800 | $1,800 | $2,400 | $3,000 | $3,000 | $6,000 | $6,000 | $6,000 | $6,000 | $6,000 | $9,000 | $9,000 | |
| Pen/Mug & Eyeglass Bag | $972 | $972 | $1,296 | $1,620 | $1,620 | $3,240 | $3,240 | $3,240 | $3,240 | $3,240 | $4,860 | $4,860 | |
| Metal Lip Eyeglass Bag | $450 | $450 | $600 | $750 | $750 | $1,500 | $1,500 | $1,500 | $1,500 | $1,500 | $2,250 | $2,250 | |
| Assorted Jewelry Rolls | $3,375 | $3,375 | $4,500 | $5,625 | $5,625 | $11,250 | $11,250 | $11,250 | $11,250 | $11,250 | $16,875 | $16,875 | |
| Satin Bags | $330 | $330 | $440 | $550 | $550 | $1,100 | $1,100 | $1,100 | $1,100 | $1,100 | $1,485 | $1,485 | |
| Message Imprinting | $1,473 | $1,473 | $2,530 | $4,038 | $4,038 | $8,075 | $8,075 | $8,075 | $8,075 | $8,075 | $18,075 | $18,075 | |
| Die Charges | $750 | $750 | $938 | $1,125 | $1,125 | $1,875 | $1,875 | $1,875 | $1,875 | $1,875 | $2,250 | $2,250 | |
| Other | $0 | $0 | $0 | $0 | $0 | $0 | $0 | $0 | $0 | $0 | $0 | $0 | |
| Total Sales | $11,230 | $11,230 | $17,084 | $24,008 | $24,008 | $47,640 | $47,640 | $47,640 | $47,640 | $47,640 | $98,295 | $98,295 | |
| Direct Unit Costs | Month 1 | Month 2 | Month 3 | Month 4 | Month 5 | Month 6 | Month 7 | Month 8 | Month 9 | Month 10 | Month 11 | Month 12 | |
| Velour Drawstring Pouch | 0.00% | $0.11 | $0.11 | $0.11 | $0.11 | $0.11 | $0.11 | $0.11 | $0.11 | $0.11 | $0.11 | $0.11 | $0.11 |
| Leather Drawstring Pouch | 0.00% | $0.18 | $0.18 | $0.18 | $0.18 | $0.18 | $0.18 | $0.18 | $0.18 | $0.18 | $0.18 | $0.18 | $0.18 |
| Round Bottom Pouch | 0.00% | $0.40 | $0.40 | $0.40 | $0.40 | $0.40 | $0.40 | $0.40 | $0.40 | $0.40 | $0.40 | $0.40 | $0.40 |
| Pen/Mug & Eyeglass Bag | 0.00% | $0.27 | $0.27 | $0.27 | $0.27 | $0.27 | $0.27 | $0.27 | $0.27 | $0.27 | $0.27 | $0.27 | $0.27 |
| Metal Lip Eyeglass Bag | 0.00% | $0.30 | $0.30 | $0.30 | $0.30 | $0.30 | $0.30 | $0.30 | $0.30 | $0.30 | $0.30 | $0.30 | $0.30 |
| Assorted Jewelry Rolls | 0.00% | $2.50 | $2.50 | $2.50 | $2.50 | $2.50 | $2.50 | $2.50 | $2.50 | $2.50 | $2.50 | $2.50 | $2.50 |
| Satin Bags | 0.00% | $0.22 | $0.22 | $0.22 | $0.22 | $0.22 | $0.22 | $0.22 | $0.22 | $0.22 | $0.22 | $0.22 | $0.22 |
| Message Imprinting | 0.00% | $0.07 | $0.07 | $0.07 | $0.07 | $0.07 | $0.07 | $0.07 | $0.07 | $0.07 | $0.07 | $0.07 | $0.07 |
| Die Charges | 0.00% | $25.00 | $25.00 | $25.00 | $25.00 | $25.00 | $25.00 | $25.00 | $25.00 | $25.00 | $25.00 | $25.00 | $25.00 |
| Other | 0.00% | $0.00 | $0.00 | $0.00 | $0.00 | $0.00 | $0.00 | $0.00 | $0.00 | $0.00 | $0.00 | $0.00 | $0.00 |
| Direct Cost of Sales | |||||||||||||
| Velour Drawstring Pouch | $770 | $770 | $1,650 | $2,750 | $2,750 | $5,500 | $5,500 | $5,500 | $5,500 | $5,500 | $8,250 | $8,250 | |
| Leather Drawstring Pouch | $270 | $270 | $540 | $900 | $900 | $1,800 | $1,800 | $1,800 | $1,800 | $1,800 | $13,500 | $13,500 | |
| Round Bottom Pouch | $900 | $900 | $1,200 | $1,500 | $1,500 | $3,000 | $3,000 | $3,000 | $3,000 | $3,000 | $4,500 | $4,500 | |
| Pen/Mug & Eyeglass Bag | $486 | $486 | $648 | $810 | $810 | $1,620 | $1,620 | $1,620 | $1,620 | $1,620 | $2,430 | $2,430 | |
| Metal Lip Eyeglass Bag | $225 | $225 | $300 | $375 | $375 | $750 | $750 | $750 | $750 | $750 | $1,125 | $1,125 | |
| Assorted Jewelry Rolls | $1,688 | $1,688 | $2,250 | $2,813 | $2,813 | $5,625 | $5,625 | $5,625 | $5,625 | $5,625 | $8,438 | $8,438 | |
| Satin Bags | $165 | $165 | $220 | $275 | $275 | $550 | $550 | $550 | $550 | $550 | $743 | $743 | |
| Message Imprinting | $1,031 | $1,031 | $1,771 | $2,826 | $2,826 | $5,653 | $5,653 | $5,653 | $5,653 | $5,653 | $12,653 | $12,653 | |
| Die Charges | $500 | $500 | $625 | $750 | $750 | $1,250 | $1,250 | $1,250 | $1,250 | $1,250 | $1,500 | $1,500 | |
| Other | $0 | $0 | $0 | $0 | $0 | $0 | $0 | $0 | $0 | $0 | $0 | $0 | |
| Subtotal Direct Cost of Sales | $6,034 | $6,034 | $9,204 | $12,999 | $12,999 | $25,748 | $25,748 | $25,748 | $25,748 | $25,748 | $53,138 | $53,138 | |
| Personnel Plan | |||||||||||||
| Month 1 | Month 2 | Month 3 | Month 4 | Month 5 | Month 6 | Month 7 | Month 8 | Month 9 | Month 10 | Month 11 | Month 12 | ||
| Production Personnel | |||||||||||||
| Imprint | $1,000 | $1,000 | $1,000 | $1,000 | $1,000 | $1,000 | $1,000 | $1,000 | $1,000 | $1,000 | $2,000 | $2,000 | |
| Shipping | $1,000 | $1,000 | $1,000 | $1,000 | $1,000 | $1,000 | $1,000 | $1,000 | $1,000 | $1,000 | $2,000 | $2,000 | |
| Name or Title or Group | $0 | $0 | $0 | $0 | $0 | $0 | $0 | $0 | $0 | $0 | $0 | $0 | |
| Subtotal | $2,000 | $2,000 | $2,000 | $2,000 | $2,000 | $2,000 | $2,000 | $2,000 | $2,000 | $2,000 | $4,000 | $4,000 | |
| Sales and Marketing Personnel | |||||||||||||
| Marvin | $2,500 | $2,500 | $2,500 | $2,500 | $2,500 | $2,500 | $2,500 | $2,500 | $2,500 | $2,500 | $2,500 | $2,500 | |
| Sales Reps | $2,000 | $2,000 | $2,000 | $2,000 | $2,000 | $2,000 | $2,000 | $2,000 | $2,000 | $2,000 | $2,000 | $2,000 | |
| Name or Title or Group | $0 | $0 | $0 | $0 | $0 | $0 | $0 | $0 | $0 | $0 | $0 | $0 | |
| Subtotal | $4,500 | $4,500 | $4,500 | $4,500 | $4,500 | $4,500 | $4,500 | $4,500 | $4,500 | $4,500 | $4,500 | $4,500 | |
| General and Administrative Personnel | |||||||||||||
| Customer Service | $3,000 | $3,000 | $3,000 | $3,000 | $3,000 | $3,000 | $3,000 | $3,000 | $3,000 | $3,000 | $3,000 | $3,000 | |
| Name or Title or Group | $0 | $0 | $0 | $0 | $0 | $0 | $0 | $0 | $0 | $0 | $0 | $0 | |
| Name or Title or Group | $0 | $0 | $0 | $0 | $0 | $0 | $0 | $0 | $0 | $0 | $0 | $0 | |
| Subtotal | $3,000 | $3,000 | $3,000 | $3,000 | $3,000 | $3,000 | $3,000 | $3,000 | $3,000 | $3,000 | $3,000 | $3,000 | |
| Other Personnel | |||||||||||||
| Name or Title or Group | $0 | $0 | $0 | $0 | $0 | $0 | $0 | $0 | $0 | $0 | $0 | $0 | |
| Name or Title or Group | $0 | $0 | $0 | $0 | $0 | $0 | $0 | $0 | $0 | $0 | $0 | $0 | |
| Name or Title or Group | $0 | $0 | $0 | $0 | $0 | $0 | $0 | $0 | $0 | $0 | $0 | $0 | |
| Subtotal | $0 | $0 | $0 | $0 | $0 | $0 | $0 | $0 | $0 | $0 | $0 | $0 | |
| Total People | 0 | 0 | 0 | 0 | 0 | 0 | 0 | 0 | 0 | 0 | 0 | 0 | |
| Total Payroll | $9,500 | $9,500 | $9,500 | $9,500 | $9,500 | $9,500 | $9,500 | $9,500 | $9,500 | $9,500 | $11,500 | $11,500 | |
| Pro Forma Profit and Loss | |||||||||||||
| Month 1 | Month 2 | Month 3 | Month 4 | Month 5 | Month 6 | Month 7 | Month 8 | Month 9 | Month 10 | Month 11 | Month 12 | ||
| Sales | $11,230 | $11,230 | $17,084 | $24,008 | $24,008 | $47,640 | $47,640 | $47,640 | $47,640 | $47,640 | $98,295 | $98,295 | |
| Direct Cost of Sales | $6,034 | $6,034 | $9,204 | $12,999 | $12,999 | $25,748 | $25,748 | $25,748 | $25,748 | $25,748 | $53,138 | $53,138 | |
| Production Payroll | $2,000 | $2,000 | $2,000 | $2,000 | $2,000 | $2,000 | $2,000 | $2,000 | $2,000 | $2,000 | $4,000 | $4,000 | |
| Other Costs of Sales | $0 | $0 | $0 | $0 | $0 | $0 | $0 | $0 | $0 | $0 | $0 | $0 | |
| Total Cost of Sales | $8,034 | $8,034 | $11,204 | $14,999 | $14,999 | $27,748 | $27,748 | $27,748 | $27,748 | $27,748 | $57,138 | $57,138 | |
| Gross Margin | $3,195 | $3,195 | $5,880 | $9,009 | $9,009 | $19,893 | $19,893 | $19,893 | $19,893 | $19,893 | $41,158 | $41,158 | |
| Gross Margin % | 28.45% | 28.45% | 34.42% | 37.52% | 37.52% | 41.76% | 41.76% | 41.76% | 41.76% | 41.76% | 41.87% | 41.87% | |
| Operating Expenses | |||||||||||||
| Sales and Marketing Expenses | |||||||||||||
| Sales and Marketing Payroll | $4,500 | $4,500 | $4,500 | $4,500 | $4,500 | $4,500 | $4,500 | $4,500 | $4,500 | $4,500 | $4,500 | $4,500 | |
| Advertising/Promotion | $0 | $4,000 | $4,000 | $4,000 | $4,000 | $4,000 | $4,000 | $4,000 | $4,000 | $4,000 | $4,000 | $4,000 | |
| Travel | $300 | $300 | $2,000 | $500 | $4,000 | $5,000 | $500 | $300 | $500 | $4,000 | $500 | $1,000 | |
| Miscellaneous | $500 | $500 | $500 | $500 | $500 | $500 | $500 | $500 | $500 | $500 | $500 | $500 | |
| Other Sales and Marketing Expenses | $0 | $0 | $0 | $0 | $0 | $0 | $0 | $0 | $0 | $0 | $0 | $0 | |
| Total Sales and Marketing Expenses | $5,300 | $9,300 | $11,000 | $9,500 | $13,000 | $14,000 | $9,500 | $9,300 | $9,500 | $13,000 | $9,500 | $10,000 | |
| Sales and Marketing % | 47.20% | 82.82% | 64.39% | 39.57% | 54.15% | 29.39% | 19.94% | 19.52% | 19.94% | 27.29% | 9.66% | 10.17% | |
| General and Administrative Expenses | |||||||||||||
| General and Administrative Payroll | $3,000 | $3,000 | $3,000 | $3,000 | $3,000 | $3,000 | $3,000 | $3,000 | $3,000 | $3,000 | $3,000 | $3,000 | |
| Marketing/Promotion | $0 | $0 | $0 | $0 | $0 | $0 | $0 | $0 | $0 | $0 | $0 | $0 | |
| Depreciation | $0 | $0 | $0 | $0 | $0 | $0 | $0 | $0 | $0 | $0 | $0 | $0 | |
| Rent | $3,000 | $3,000 | $3,000 | $3,000 | $3,000 | $3,000 | $3,000 | $3,000 | $3,000 | $3,000 | $3,000 | $3,000 | |
| Utilities | $3,500 | $3,500 | $3,500 | $3,500 | $3,500 | $3,500 | $3,500 | $3,500 | $3,500 | $3,500 | $3,500 | $3,500 | |
| Insurance | $300 | $300 | $300 | $300 | $300 | $300 | $300 | $300 | $300 | $300 | $300 | $300 | |
| Payroll Taxes | 20% | $0 | $0 | $0 | $0 | $0 | $0 | $0 | $0 | $0 | $0 | $0 | $0 |
| Other General and Administrative Expenses | $0 | $0 | $0 | $0 | $0 | $0 | $0 | $0 | $0 | $0 | $0 | $0 | |
| Total General and Administrative Expenses | $9,800 | $9,800 | $9,800 | $9,800 | $9,800 | $9,800 | $9,800 | $9,800 | $9,800 | $9,800 | $9,800 | $9,800 | |
| General and Administrative % | 87.27% | 87.27% | 57.37% | 40.82% | 40.82% | 20.57% | 20.57% | 20.57% | 20.57% | 20.57% | 9.97% | 9.97% | |
| Other Expenses: | |||||||||||||
| Other Payroll | $0 | $0 | $0 | $0 | $0 | $0 | $0 | $0 | $0 | $0 | $0 | $0 | |
| Consultants | $0 | $0 | $0 | $0 | $0 | $0 | $0 | $0 | $0 | $0 | $0 | $0 | |
| Other Expenses | $0 | $0 | $0 | $0 | $0 | $0 | $0 | $0 | $0 | $0 | $0 | $0 | |
| Total Other Expenses | $0 | $0 | $0 | $0 | $0 | $0 | $0 | $0 | $0 | $0 | $0 | $0 | |
| Other % | 0.00% | 0.00% | 0.00% | 0.00% | 0.00% | 0.00% | 0.00% | 0.00% | 0.00% | 0.00% | 0.00% | 0.00% | |
| Total Operating Expenses | $15,100 | $19,100 | $20,800 | $19,300 | $22,800 | $23,800 | $19,300 | $19,100 | $19,300 | $22,800 | $19,300 | $19,800 | |
| Profit Before Interest and Taxes | ($11,905) | ($15,905) | ($14,921) | ($10,291) | ($13,791) | ($3,908) | $593 | $793 | $593 | ($2,908) | $21,858 | $21,358 | |
| EBITDA | ($11,905) | ($15,905) | ($14,921) | ($10,291) | ($13,791) | ($3,908) | $593 | $793 | $593 | ($2,908) | $21,858 | $21,358 | |
| Interest Expense | $0 | $0 | $0 | $0 | $0 | $0 | $0 | $0 | $0 | $0 | $417 | $625 | |
| Taxes Incurred | $0 | $0 | $0 | $0 | $0 | $0 | $0 | $0 | $0 | $0 | $0 | $0 | |
| Net Profit | ($11,905) | ($15,905) | ($14,921) | ($10,291) | ($13,791) | ($3,908) | $593 | $793 | $593 | ($2,908) | $21,441 | $20,733 | |
| Net Profit/Sales | -106.01% | -141.63% | -87.34% | -42.87% | -57.45% | -8.20% | 1.24% | 1.66% | 1.24% | -6.10% | 21.81% | 21.09% | |
| Pro Forma Cash Flow | |||||||||||||
| Month 1 | Month 2 | Month 3 | Month 4 | Month 5 | Month 6 | Month 7 | Month 8 | Month 9 | Month 10 | Month 11 | Month 12 | ||
| Cash Received | |||||||||||||
| Cash from Operations | |||||||||||||
| Cash Sales | $0 | $0 | $0 | $0 | $0 | $0 | $0 | $0 | $0 | $0 | $0 | $0 | |
| Cash from Receivables | $0 | $374 | $11,230 | $11,425 | $17,314 | $24,008 | $24,795 | $47,640 | $47,640 | $47,640 | $47,640 | $49,329 | |
| Subtotal Cash from Operations | $0 | $374 | $11,230 | $11,425 | $17,314 | $24,008 | $24,795 | $47,640 | $47,640 | $47,640 | $47,640 | $49,329 | |
| Additional Cash Received | |||||||||||||
| Sales Tax, VAT, HST/GST Received | 0.00% | $0 | $0 | $0 | $0 | $0 | $0 | $0 | $0 | $0 | $0 | $0 | $0 |
| New Current Borrowing | $0 | $0 | $0 | $0 | $0 | $0 | $0 | $0 | $0 | $0 | $50,000 | $25,000 | |
| New Other Liabilities (interest-free) | $0 | $0 | $0 | $0 | $0 | $0 | $0 | $0 | $0 | $0 | $0 | $0 | |
| New Long-term Liabilities | $0 | $0 | $0 | $0 | $0 | $0 | $0 | $0 | $0 | $0 | $0 | $0 | |
| Sales of Other Current Assets | $0 | $0 | $0 | $0 | $0 | $0 | $0 | $0 | $0 | $0 | $0 | $0 | |
| Sales of Long-term Assets | $0 | $0 | $0 | $0 | $0 | $0 | $0 | $0 | $0 | $0 | $0 | $0 | |
| New Investment Received | $0 | $0 | $0 | $50,000 | $0 | $50,000 | $0 | $0 | $0 | $0 | $0 | $0 | |
| Subtotal Cash Received | $0 | $374 | $11,230 | $61,425 | $17,314 | $74,008 | $24,795 | $47,640 | $47,640 | $47,640 | $97,640 | $74,329 | |
| Expenditures | Month 1 | Month 2 | Month 3 | Month 4 | Month 5 | Month 6 | Month 7 | Month 8 | Month 9 | Month 10 | Month 11 | Month 12 | |
| Expenditures from Operations | |||||||||||||
| Cash Spending | $9,500 | $9,500 | $9,500 | $9,500 | $9,500 | $9,500 | $9,500 | $9,500 | $9,500 | $9,500 | $11,500 | $11,500 | |
| Bill Payments | $253 | $7,733 | $11,657 | $13,536 | $20,634 | $29,224 | $55,454 | $37,541 | $37,354 | $37,664 | $42,862 | $94,502 | |
| Subtotal Spent on Operations | $9,753 | $17,233 | $21,157 | $23,036 | $30,134 | $38,724 | $64,954 | $47,041 | $46,854 | $47,164 | $54,362 | $106,002 | |
| Additional Cash Spent | |||||||||||||
| Sales Tax, VAT, HST/GST Paid Out | $0 | $0 | $0 | $0 | $0 | $0 | $0 | $0 | $0 | $0 | $0 | $0 | |
| Principal Repayment of Current Borrowing | $0 | $0 | $0 | $0 | $0 | $0 | $0 | $0 | $0 | $0 | $0 | $0 | |
| Other Liabilities Principal Repayment | $0 | $0 | $0 | $0 | $0 | $0 | $0 | $0 | $0 | $0 | $0 | $0 | |
| Long-term Liabilities Principal Repayment | $0 | $0 | $0 | $0 | $0 | $0 | $0 | $0 | $0 | $0 | $0 | $0 | |
| Purchase Other Current Assets | $0 | $0 | $0 | $0 | $0 | $0 | $0 | $0 | $0 | $0 | $0 | $0 | |
| Purchase Long-term Assets | $0 | $0 | $0 | $0 | $0 | $0 | $0 | $0 | $0 | $0 | $0 | $0 | |
| Dividends | $0 | $0 | $0 | $0 | $0 | $0 | $0 | $0 | $0 | $0 | $0 | $0 | |
| Subtotal Cash Spent | $9,753 | $17,233 | $21,157 | $23,036 | $30,134 | $38,724 | $64,954 | $47,041 | $46,854 | $47,164 | $54,362 | $106,002 | |
| Net Cash Flow | ($9,753) | ($16,859) | ($9,927) | $38,389 | ($12,820) | $35,283 | ($40,158) | $599 | $786 | $476 | $43,278 | ($31,674) | |
| Cash Balance | $107,647 | $90,788 | $80,860 | $119,249 | $106,430 | $141,713 | $101,554 | $102,153 | $102,939 | $103,415 | $146,693 | $115,019 | |
| Pro Forma Balance Sheet | |||||||||||||
| Month 1 | Month 2 | Month 3 | Month 4 | Month 5 | Month 6 | Month 7 | Month 8 | Month 9 | Month 10 | Month 11 | Month 12 | ||
| Assets | Starting Balances | ||||||||||||
| Current Assets | |||||||||||||
| Cash | $117,400 | $107,647 | $90,788 | $80,860 | $119,249 | $106,430 | $141,713 | $101,554 | $102,153 | $102,939 | $103,415 | $146,693 | $115,019 |
| Accounts Receivable | $0 | $11,230 | $22,085 | $27,939 | $40,522 | $47,215 | $70,847 | $93,692 | $93,692 | $93,692 | $93,692 | $144,347 | $193,314 |
| Inventory | $40,000 | $33,966 | $27,932 | $18,728 | $14,299 | $14,299 | $28,322 | $28,322 | $28,322 | $28,322 | $28,322 | $58,451 | $58,451 |
| Other Current Assets | $20,000 | $20,000 | $20,000 | $20,000 | $20,000 | $20,000 | $20,000 | $20,000 | $20,000 | $20,000 | $20,000 | $20,000 | $20,000 |
| Total Current Assets | $177,400 | $172,842 | $160,804 | $147,527 | $194,070 | $187,943 | $260,882 | $243,568 | $244,168 | $244,953 | $245,429 | $369,491 | $386,784 |
| Long-term Assets | |||||||||||||
| Long-term Assets | $5,000 | $5,000 | $5,000 | $5,000 | $5,000 | $5,000 | $5,000 | $5,000 | $5,000 | $5,000 | $5,000 | $5,000 | $5,000 |
| Accumulated Depreciation | $0 | $0 | $0 | $0 | $0 | $0 | $0 | $0 | $0 | $0 | $0 | $0 | $0 |
| Total Long-term Assets | $5,000 | $5,000 | $5,000 | $5,000 | $5,000 | $5,000 | $5,000 | $5,000 | $5,000 | $5,000 | $5,000 | $5,000 | $5,000 |
| Total Assets | $182,400 | $177,842 | $165,804 | $152,527 | $199,070 | $192,943 | $265,882 | $248,568 | $249,168 | $249,953 | $250,429 | $374,491 | $391,784 |
| Liabilities and Capital | Month 1 | Month 2 | Month 3 | Month 4 | Month 5 | Month 6 | Month 7 | Month 8 | Month 9 | Month 10 | Month 11 | Month 12 | |
| Current Liabilities | |||||||||||||
| Accounts Payable | $0 | $7,347 | $11,213 | $12,857 | $19,691 | $27,355 | $54,202 | $36,296 | $36,103 | $36,296 | $39,679 | $92,300 | $63,860 |
| Current Borrowing | $0 | $0 | $0 | $0 | $0 | $0 | $0 | $0 | $0 | $0 | $0 | $50,000 | $75,000 |
| Other Current Liabilities | $0 | $0 | $0 | $0 | $0 | $0 | $0 | $0 | $0 | $0 | $0 | $0 | $0 |
| Subtotal Current Liabilities | $0 | $7,347 | $11,213 | $12,857 | $19,691 | $27,355 | $54,202 | $36,296 | $36,103 | $36,296 | $39,679 | $142,300 | $138,860 |
| Long-term Liabilities | $0 | $0 | $0 | $0 | $0 | $0 | $0 | $0 | $0 | $0 | $0 | $0 | $0 |
| Total Liabilities | $0 | $7,347 | $11,213 | $12,857 | $19,691 | $27,355 | $54,202 | $36,296 | $36,103 | $36,296 | $39,679 | $142,300 | $138,860 |
| Paid-in Capital | $200,000 | $200,000 | $200,000 | $200,000 | $250,000 | $250,000 | $300,000 | $300,000 | $300,000 | $300,000 | $300,000 | $300,000 | $300,000 |
| Retained Earnings | ($17,600) | ($17,600) | ($17,600) | ($17,600) | ($17,600) | ($17,600) | ($17,600) | ($17,600) | ($17,600) | ($17,600) | ($17,600) | ($17,600) | ($17,600) |
| Earnings | $0 | ($11,905) | ($27,810) | ($42,730) | ($53,021) | ($66,813) | ($70,720) | ($70,128) | ($69,335) | ($68,743) | ($71,650) | ($50,209) | ($29,477) |
| Total Capital | $182,400 | $170,495 | $154,591 | $139,670 | $179,379 | $165,588 | $211,680 | $212,273 | $213,065 | $213,658 | $210,750 | $232,191 | $252,923 |
| Total Liabilities and Capital | $182,400 | $177,842 | $165,804 | $152,527 | $199,070 | $192,943 | $265,882 | $248,568 | $249,168 | $249,953 | $250,429 | $374,491 | $391,784 |
| Net Worth | $182,400 | $170,495 | $154,590 | $139,670 | $179,379 | $165,587 | $211,680 | $212,272 | $213,065 | $213,657 | $210,750 | $232,191 | $252,923 |

