
PrintingSolutions.com
Executive Summary
PrintingSolutions.com is being designed as a global Internet printing services/print shop who is focused on reducing the overall printing price structure, in addition to enabling business-to-business transactions for printing presses and the graphic art design industry. PrintingSolutions.com will also attain a competitive edge by offering services such as website development and e-commerce, which have become essential for any business presence.
PrintingSolutions.com intends to establish and operate an Internet print shop with services costing significantly less than the prices of its competitors, while supplying superior quality. Incorporating its website and graphic art services, Printing Solutions will enable both start-up and existing companies to reduce their printing and e-commerce costs.
Highlights of PrintingSolutions.com
- Breakthrough services. PrintingSolutions.com will develop a unique website that provides customers various ways to create business stationery, including business cards, envelopes, notepads, and door hangers. A graphic art design center will also be provided, enabling customers to create company logos and other designs essential to their company’s identity.
- Trademarks. The company plans to register a corporation under the name of PrintingSolutions.com and operate under the same name.
- Large markets. Recent studies by Forrester Research Inc. reveal that business-to-business (B2B) commerce will total $2.7 trillion in revenue by Year 5. The data emphasize that e-marketplaces will be responsible for 53% of all online business trade.
- Seasoned management. The company’s management is highly experienced and qualified.
- Customers. The company will primarily target small and start-up businesses throughout the country. The company will also develop plans to negotiate deals with big businesses.
The biggest competitive threat for PrintingSolutions.com will come from iPrint.com. However, we will have a competitive advantage over iPrint.com by offering lower prices on all products and services. Customers in this industry are sensitive to both quality and price, and at PrintingSolutions.com they will benefit from both offerings.
PrintingSolutions.com has a world-class management team with direct knowledge of the industry, extensive research experience, and unique administration skills. The team will be led by Mr. Dalton Grant.
The company projects that during the second half of Year 1 it will generate revenues of $250,000. Projected revenues for Year 2 and Year 3 are $2.91 million and $5.82 million, respectively. PrintingSolutions.com is seeking $830,000 in venture capital to be used for:
- Establishing an organization and office presence in both the United States and overseas.
- Completing development of the Internet print shop.
- Marketing the website and its services and products.

1.1 Mission
The mission of PrintingSolutions.com is to become a global company, utilizing the power of the Internet to become the market leader in providing online printing, website designs, graphic art designs, and a B2B portal for the untapped printing press and graphic art design industries. To accomplish this, the company will combine high-quality workmanship with the lowest costs in the industry.
Company Summary
PrintingSolutions.com will be incorporated as a C-corporation, with principal offices located in Bluegene, Oregon. All operations, from administration to website development, will take place at this leased office location of approximately 1,000 square feet. The company also plans to establish an office offshore to facilitate, control prices, and monitor the quality of work.
2.1 Start-up Summary
The company’s product selection will not need a high initial investment. The staff that develops websites is capable of many other projects, too. In addition, the materials required for printing do not expire and can be utilized for other printing purposes as well.

| Start-up | |
| Requirements | |
| Start-up Expenses | |
| Office setup | $325,000 |
| Marketing | $500,000 |
| Other Administrative expenses | $25,000 |
| Salaries | $10,000 |
| Research and development | $20,000 |
| Other | $0 |
| Total Start-up Expenses | $880,000 |
| Start-up Assets | |
| Cash Required | $950,000 |
| Start-up Inventory | $0 |
| Other Current Assets | $200,000 |
| Long-term Assets | $0 |
| Total Assets | $1,150,000 |
| Total Requirements | $2,030,000 |
Services
PrintingSolutions.com will be an online provider of printing and B2B print services, focusing on the business market. This will be fortified with the company’s graphic art and website design services.
The online print shop will offer customers a one-stop shop for addressing their printing needs. Customers will be able to easily design and order customization on thousands of products, primarily small-quantity printed products. By automating and enhancing the print order process and electronically connecting our online printing services to carefully-selected commercial print vendors, it is believed, based on experience in the printing industry, that the company will significantly reduce the costs and inefficiencies associated with the traditional printing process. Our online print services are designed to be more convenient and cost-effective than printing alternatives provided through traditional print channels.
PrintingSolutions.com will simplify the design and ordering process in several ways, including the elimination of manual steps and handwritten forms used by traditional print shops. The company believes this will significantly reduce reprint-due-to-error costs and the associated print wastage incurred by commercial print vendors. Exact re-prints of previous orders will be available at a reduced cost. At the same time, the company will lower costs and improve capacity utilization for its commercial print vendors since it will electronically route orders to commercial print vendors that have idle capacity. PrintingSolutions.com also believes that these efficiencies, incorporated with lower overhead costs due to the online nature and automation, will allow the company to be more cost effective than traditional printing alternatives. Furthermore, the cost of printing will be greatly reduced by using the offshore printing press affiliate, Creative Designs and Printers.
In addition to providing customers with online print services directly through the PrintingSolutions.com website, the company will be conducting B2B through PrintingSolutionsB2B.com.
Graphic Art Design: PrintingSolutions.com will provide a graphic art design center where customers will describe their company to enable a graphic art designer to create a logo for them.
Website Design: Customers will also be able to have website designers create effective websites for their company. Customers will choose from either a template or a customized website, whichever suits their business needs.
Business Stationery: This will initially include:
- Brochures
- Business cards
- Envelopes
- Writing tablets
- Door hangers
- Greeting cards
- Memo pads
- Letterhead
- Logo designs
3.1 Fulfillment
All services provided by PrintingSolutions.com (business stationery products, website designers, and graphic art designs) originate overseas; when necessary, a United States-based team will provide assistance.
Customers will be able to work with the designers online for any changes or enhancements once the initial designs have been completed. Delivery of graphic art designs and websites will be done electronically, with the option of receiving a compact disk.
In the event that an error is made in printing an order, customers will have the option of returning it to have it reprinted. Otherwise, all sales will be final, since the printing will be customized and cannot be resold. Customers will not be able to cancel the order once the materials are printed.
Customers will be able to contact the company via the Internet through email, and interactive tools such as AOL instant messenger and Microsoft net-meeting. Additionally, the company will provide traditional telephone customer service.
3.2 Technology
An online print shop faces challenges that other electronic commerce vendors do not face. PrintingSolutions.com will design its online print shop to address the challenges of selling custom printed products and to handle potentially large volume orders. The computer software architecture of PrintingSolutions.com, the related websites, and the design/order processing technologies integrate high-performance and proprietary software modules with technology that is licensed from third parties.

3.2.1 Challenges
The challenges for an online print shop which are not typically faced by other electronic commerce vendors include:
- Customer-driven product creation. Customers do not order from a static, pre-set product catalog. Rather, customers can create sophisticated desktop publishing design projects, requiring the ability to freely mix text, graphic images, fonts, styles, and colors on printed items.
- Intensive customer interaction. Our websites are not presenting static content pages; customers are engaged in intensive design activities which require constant system monitoring and optimization as visitor traffic grows.
- Integrating the process of typesetting with commercial printing. Typesetting is a precision science. PrintingSolutions.com will automatically convert an onscreen design into a resolution-independent electronic file that can be successfully reproduced by a variety of commercial print vendors, each with different printing processes and order management requirements.
- Point-of-order pricing. Since each product created is a custom design consisting of various inks, papers, designs, and quantity attributes, PrintingSolutions.com must be able to provide accurate, real-time pricing information to its customers that can be calculated instantaneously from tens of thousands of price point combinations.
- Re-orders. PrintingSolutions.com will retain each customer’s order specifications, including all designs, negatives, and print plates, for a limited time. This will enable us to charge a lower fee for an exact reprint of a previous order.
- Intelligent order routing. Each of the commercial print vendors the company will work with has different capabilities and a unique set of requirements that are taken into account when determining how to fulfill an order. By considering account product type, pricing, geography, and shipping options, PrintingSolutions.com will strive to route each order individually to the vendor with the best combination of quality, delivery time, and price.
PrintingSolutions.com believes that, with our technology expertise, we will be able to address these challenges while also handling large numbers of customer design sessions and orders. We feel this represents a competitive advantage.
3.3 Future Services
Customized printing will be offered in the future on products including:
- Mass print materials (such as books and magazines)
- Mugs
- Mouse pads
- Pens
- Rubber stamps
- Labels
PrintingSolutions.com will eventually provide franchising opportunities. As the need for doing business in the information age evolves, so will we. The company will provide resources for customers to remain on the cutting edge of technology.
Market Analysis Summary
PrintingSolutions.com will focus on small and start-up business customers in the United States. We plan to aggressively pursue and acquire customers through direct business promotions and convert them into repeat paying customers. We will continually strive to provide consumers with more cost-effective avenues, offering substantial savings rather than just a few cents.
PrintingSolutions.com will also be configured to stay ahead of, and capitalize on, emerging market trends such as integration of information/markets and increasing sophistication of online offerings. This will provide a continuously improving, superior customer experience and grow value.
There is a serious benefit deficiency in existing “brick and mortar” printing establishments that create inefficiencies in the ordering and production process. Utilizing the benefits of Internet selling will eliminate many of these problems and create a lower-cost environment.
At the present, PrintingSolutions.com faces major online competition from iPrint.com, which is an established online printer. However, iPrint.com does not offer the lowest cost products on the market, nor does it provide all of the printing services a business needs. Therefore, there is significant opportunity to gain market share.
4.1 Customers and Markets
The company will be primarily targeting small and start-up businesses in the United States; however the company plans to negotiate deals with big businesses. Vendors will include printers and graphic art designers around the world that will be able to help define these markets using the PrintingSolutions.com B2B portal. While the primary focus will be on business customers, PrintingSolutions.com’s ability to print in small quantities will allow the company to service the printing needs of individuals as well.
To ensure success, the company will continuously attract new customers, many of whom may have personal and long-standing relationships with traditional print and design shops, catalog vendors, office supply chains and stationery stores. Traditional print and design shops have many advantages which PrintingSolutions.com cannot offer its customers, including physical proximity and interpersonal business relationships. In addition, catalog vendors may be better able to combine orders to achieve economies of scale and may be more convenient for customers who also want to purchase non-printed products, such as office furniture.
PrintingSolutions.com plans to aggressively pursue and acquire customers through promotions and convert them into repeat paying customers. Direct business promotions are the most important vehicle that the company will use to acquire customers. These promotions may include providing the customer a product, such as a mailing label at no charge, or charging the customer only for shipping and handling, in order to introduce that customer to our products and services.
PrintingSolutions.com plans to expand its business and customer base by offering business promotions on a continuous basis. PrintingSolutions.com will continually strive to provide consumers with more cost-effective avenues, offering substantial savings rather than just a few cents. Using offshore print companies as partners and having partners bid on jobs will be one avenue used to ensure the best prices for our customers.
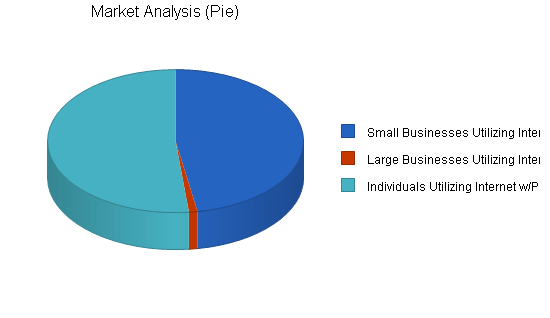
The following chart and table express the projected number of potential customers in the United States by market segment. Although it is planned to make PrintingSolutions.com a global company, the initial phase of market penetration will focus on the domestic market.
Note: Although the large business segment consists of the smallest number of businesses, this group generates the largest sales and revenues of all three segments. Additionally, it is believed that the company’s ability to gain market share in the third category, “Individual customers,” will be relatively small in comparison with the other two. This is due to the primary concentration of marketing efforts on the business segments.
| Market Analysis | |||||||
| Year 1 | Year 2 | Year 3 | Year 4 | Year 5 | |||
| Potential Customers | Growth | CAGR | |||||
| Small Businesses Utilizing Internet | 8% | 4,970,000 | 5,342,750 | 5,743,456 | 6,174,215 | 6,637,281 | 7.50% |
| Large Businesses Utilizing Internet | 6% | 113,600 | 119,848 | 126,440 | 133,394 | 140,731 | 5.50% |
| Individuals Utilizing Internet w/Printing Needs | 27% | 5,430,000 | 6,896,100 | 8,758,047 | 11,122,720 | 14,125,854 | 27.00% |
| Total | 18.75% | 10,513,600 | 12,358,698 | 14,627,943 | 17,430,329 | 20,903,866 | 18.75% |
4.2 Target Market Segment Strategy
Printing Solutions has chosen to focus on the small business market segment as its primary customer base because these customers usually have the lowest switching costs, do not have long-term relationships with other printing companies, and are the most aggressive in searching for low-cost printing services. Furthermore, Printing Solution’s ability to route jobs of various sizes to printers with temporary excess capacity matches well with these companies, who usually desire smaller print jobs than the larger companies.
As stated previously, PrintingSolutions.com will also focus on large businesses. The advantage with this market segment is that each job usually offers a higher margin than compared with the small business segment.
Finally, the company will also address individual needs. This is potentially the largest market; however, there is a relatively high churn rate in this segment that will require more extensive marketing efforts to attract new customers. This, in turn, lowers the margin and makes this segment the least attractive.
4.2.1 Market Trends
The evolution of vertical e-marketplaces
Today’s vertical e-marketplaces are mere infants on the business maturity scale, with most websites possessing less than eight months of transaction experience. Forrester Research believes that the changing business rules will push these young e-marketplaces into a highly-competitive race in which surviving websites must mature:
From isolated niche offerings . . . e-marketplaces begin their lives by providing a narrow range of targeted products for a buyer base. FairMarket, for example, was launched as a website where electronics manufacturers and distributors could auction surplus electronic components to resellers and system integrators. This highly-focused effort enables online markets to gain initial traction.
. . . to highly interconnected one-stop shops. Vertical e-marketplaces will grow to provide a single access point for commerce and information within an industry–combining multiple services like logistics, payments, and credit with product offerings in real time. As an example, e-marketplace participants purchasing containers of extruded plastic will be able to access specific cargo insurance quotes in the midst of arranging logistics tailored to that order.
2000 To 2001: Racing To Establish Credibility
Over the next 12 to 18 months, e-marketplaces will continue their attack on narrowly-scoped industry inefficiencies by focusing on simple themes:
- Enhance basic commerce platforms. Firms will solidify their infrastructures to support one or two types of dynamic transaction mechanisms–auction, bid, exchange, or aggregator–targeting specific industry inefficiencies.
- Sprint to critical mass. Since no more than a few significant e-marketplaces will succeed in most industries, e-marketplaces will do whatever it takes to establish themselves as one of the long-term winners. Websites will relentlessly woo key suppliers and sign ad hoc deals with corporate buyers to quickly ramp sales volumes. In addition to the transaction push, market makers will kick off intense marketing campaigns, requiring a large part of their funds, to create images of success in publications like The Wall Street Journal.
- Invent unique offerings. E-marketplaces will actively create Net-based service offerings that participants can’t access offline. An example is being able to design and order your printed stationery 24 hours a day.
2001+: Building Value through Networks.
Beginning in 2001, e-marketplaces will move beyond basic issues of critical mass and begin reaching out, beyond their websites, to integrate more intensely with other product and service providers. Market makers that make it to this more evolved stage will look to provide a broader set of capabilities to participants by:
- Configuring comprehensive product/service bundles. E-marketplaces will fulfill customers’ visions of one-stop shops by connecting the process of product research information all the way through to trade settlement and clearing–as part of one connected transaction process. These websites will integrate services like risk management, financing, and logistics into a single flow.
- Weaving together marketplaces. To deliver sophisticated configuration of products and services, Internet vertical markets will seamlessly interconnect with other marketplaces. In this environment, participants may enter one marketplace to perform one simple transaction process–like putting their brochure needs up for bid–but will be led down an orchestrated path through other interrelated websites.
- Establishing real-time measurements. In a push for new revenue sources, e-marketplaces will cash in on the mass of data streaming through their websites–charging participants for analytic tools to access data and then levying additional fees to massage the data to glean meaningful trends. Look for dynamic pricing engines in commodities, like electronic components, which will help buyers by analyzing current data trends to recommend whether a corporation should put its request for microchips out for bid, buy at an auction, or simply buy stock on a simple volume-discount plan.
4.3 Service Business Analysis
Market Description
Printing can be a major area of expenditure for small businesses. Based on data from CAP Ventures, Inc., an independent print research firm, sales in the United States printing industry totaled $292 billion in 1998, of which $58 billion was derived from commercial printing operations. Short-run, customized items, which include a wide range of business, promotional and general office products, as well as consumer items, comprise a significant portion of these commercial printing operations. This market is highly fragmented, with an estimated 50,000 local and regional commercial printers in the United States.
The traditional process of purchasing short-run print items can be time consuming and error prone. Small businesses and consumers often lack the financial resources to create economies of scale when purchasing printed products. According to the International Data Corporation (IDC), the number of small businesses engaged in e-commerce will grow from 400,000 at the end of 1998 to nearly 2.8 million by the end of 2003.
The explosive growth of the Internet as a tool for global communications has enabled millions of people to interact electronically. The IDC estimates that there were 142 million Web users worldwide at the end of 1998, and expect this number will grow to approximately 502 million by the end of 2003. Rapid acceptance of the Internet as a communications platform, by both businesses and consumers, has created the foundation for significant growth in business-to-business and business-to-consumer e-commerce. IDC estimates that worldwide commerce over the Internet will increase from approximately $50 billion in 1998 to $1.3 trillion in 2003.
The Small Business Administration (SBA) estimates that more than 98% of all businesses in the United States have fewer than 100 employees. These businesses often lack the size and financial resources to create economies of scale. In particular, these organizations typically do not maintain dedicated procurement departments and often do not achieve significant purchasing leverage. That is why the Internet is so important for these businesses; it can provide small businesses and consumers with a number of advantages when making purchases, including:
- Convenience.
- Wider selection of products and services.
- Competitive pricing.
Small businesses are taking advantage of the opportunities the Internet affords. The IDC estimates that the number of small businesses engaged in e-commerce will increase 47.1% annually, from 400,000 at the end of 1998 to almost 2.8 million at the end of 2003, signaling the broad adoption of the Internet by these small enterprises.
The widespread adoption of the Internet as a purchasing vehicle has created a wealth of opportunities for businesses that offer products and services to small businesses and consumers. Simultaneously, it has given both small businesses and consumers a wider variety of products from which to choose at competitive prices.
4.3.1 Market Highlights
Highlights of Market
- Identifiable market sectors. Forrester Research estimates that there are approximately 70 identifiable vertical market sectors (i.e., manufacturing, insurance, stock brokerage, engineering, etc.) in the commercial business world today.
- High growth in e-commerce. Forrester Research also reports that B2B e-commerce will be a $1.3 trillion market by 2003 (Red Herring, December 1999). This will surpass the business-to-consumer market by five to seven times.
- E-commerce market value. IDC, another market intelligence firm, predicts the market to be $633 billion by 2001. IDC also believes that the largest portion of new technology investments for businesses will be devoted to the study and implementation of e-commerce B2B initiatives. Compounded growth between 2001 and 2003 is expected to be 35%. IDC claims that those entrepreneurs that set their banner into e-commerce sectors will be the ones that reap the greatest profits and growth from 2001 and beyond.
- Internet services market. Gartner, an independent research firm, calls B2B e-commerce “the new millennium’s killer application.” The Internet services’ market will grow at a cumulative annual growth rate of 60% through 2003. IDC also claims that revenue in the worldwide Internet services market grew 71% in 1998 and is expected to grow at a cumulative annual growth rate of 60% through 2003, with revenues for Internet services approaching $80 billion.
IDC predicts that, of the estimated seven million small businesses in the United States, the percentage connected to the Internet will grow from approximately 40 percent in 1996 to almost 70 percent in 2000. IDC estimates the number of users in the US accessing the World Wide Web will increase from approximately 63 million at the end of 1998 to 177 million by the end of 2003.
4.3.2 E-marketplaces
E-marketplace Reports
The research shows that e-marketplaces will be responsible for 53% of all online business trade. Research also indicates that more companies are moving to make purchases and sales on the Internet and are looking to build deeper relationships with business partners. This research has also shown:
The B2B arena reshaping e-marketplaces. The initial wave of B2B e-commerce has been dominated by extranets that automate off-line processes between partners. However, the Net is now moving to a new business venue, e-marketplaces, where the dynamic many-to-many interactions will supplant stagnant one-to-one relationships. These new trading arenas will flourish because:
- Industry inefficiencies run rampant. In today’s business environment, comparing offerings across suppliers requires multiple phone calls to various suppliers or enlisting the costly support of a broker. Time-consuming practices like these are easy targets for the Net, where purchasing agents can gain instant access to comparisons of many different products.
- E-marketplace vendors will lower technology barriers. Today, B2B entrepreneurs can acquire sophisticated marketplace software from firms like Tradex, Ariba, and Commerce One, or entirely offload the building of their websites to a lengthening list of experienced e-commerce integrators like Vision Systems or Software Solutions Pakistan.
- Venture funding is shifting to business trade. High-profile B2B players like VerticalNet–whose market cap currently exceeds $4 billion–have caught the investor community’s attention. The result? Many venture capitalists are placing bigger bets on their business trade portfolio.
E-marketplaces will face a changing business environment. As more and more companies compete in the B2B market, there are going to be companies that will either have to sell or go out of business due to:
- Virgin markets disappearing. While most existing e-marketplaces are launched in a world devoid of serious competition, such as the printing business, these uncharted opportunities will quickly fade away; name recognition must be established.
- Feature-function races escalate. Functionality is currently not a big issue. But these websites will soon face stiff competition, and basic service offerings won’t be good enough.
PrintingSolutions.com will ensure our success by combining the most functionally-rich e-marketplace with the best prices for our customers. PrintingSolutions.com will aggressively pursue partnerships and develop a large customer base to get a strong foothold in the markets it ventures into. New vertical e-marketplace rules will emerge. As the competition increases in these vertical e-marketplaces, the operators will have to update their strategies and change their business paradigm to:
- Diversify beyond transaction fees. As vertical marketplace venues grow, websites will be pushed into competitive market share battles. To keep customers online, e-marketplaces will be forced to take a smaller percentage of the deal and expand their businesses by searching for new revenue streams.
- Expand through interconnections. Customers will begin to look for marketplaces to play dual roles: acting as both a one-stop shop for a variety of products as well as offering highly specialized industry-specific services. To accomplish this, alliances will need to be formed with other marketplaces who specialize in other vertical segments.
- Configure for specific buyer segments. Marketplaces serving industries like print or office supplies will no longer be able to treat all buyers alike. Marketplaces will need to begin offering service bundles to unique buyers–differentiating between decentralized, multinational corporations shipping overseas and local “Mom-and-Pop” shops.
4.3.3 Competition and Buying Patterns
The traditional process of purchasing printing can be time consuming and error prone. Businesses, particularly self-employed individuals and small businesses, often lack the financial resources to create economies of scale when purchasing printed products.
PrintingSolutions.com believes that consumers will choose products and services based on the following criteria:
- Significant cost savings. The print shop will operate online and will be highly automated, enabling PrintingSolutions.com to eliminate the costs of both building/managing a physical print shop and printing/distributing catalogs. We will be able to pass these savings on to our customers, offering printed goods for up to 50% less than traditional print and design shops. Furthermore, it is believed that our prices will be competitive and could possibly undercut mail-order catalog prices, but have a superior offering of customized printed products.
Traditionally, the primary cost of printing customized products has been working with customers to decide what needs to be printed. This required a design phase that normally employed the services of a graphics team. By providing predefined templates that enable our customers to customize a product online, the company will eliminate the need for a graphics team for the most significant portion of the work. For products such as brochures and logo designs, PrintingSolutions.com will utilize its offshore resources to complete the job. By enabling customers to do the majority of their own design work, and utilizing the offshore resources, we will significantly reduce our overhead and pass substantial savings on to our customers.
- Convenience. PrintingSolutions.com will develop its online print shop and specialized print services to be user friendly, using a self-service approach to designing and ordering products. Products will be shipped to the location the customer selects, enabling the entire process to be managed from the comfort of the customer’s office or home.
- Simplified Design and Ordering Process. For products created on the PrintingSolutions.com website, the technology will empower the customer to design and view printed items prior to purchasing these products. Also, exact re-prints of a previous order may be purchased at reduced rates. At PrintingSolutions.com, we believe that our “what-you-see-is-what-you-get approach” will be superior to the non-visual, forms-based process traditionally used by print shops and office supply catalogs. It will increase reliability and customer satisfaction and reduce the time it takes to complete an order. The company’s interactive design tools will alert the customer of common mistakes and missing information, further reducing the possibility of an incomplete or inaccurate order. Regardless of where a product is created, we will route orders to the optimal printing plant, given the quantity, equipment, raw material, and geographic considerations.
- Streamlined fulfillment process. After an order is placed, PrintingSolutions.com will electronically send a ready-to-print graphic file. Where appropriate, a job ticket file, which is a data file containing all of the attributes of an order, will be sent to one of the company’s certified commercial print vendors located throughout the United States and Pakistan. Our specialized print services, including the online self-service print shop, will virtually eliminate the pre-press process for commercial print vendors. We believe this will significantly improve the accuracy of the order and substantially reduce the amount of time and effort required for the commercial printer to complete it.
- Broad range of services and professionally printed products. PrintingSolutions.com will provide a one-stop shop for a wide range of printed products and services, with a print product selection that the company believes is superior to most traditional print shops and office supply catalogs. In the self-service print shop, PrintingSolutions.com will offer print items in several product categories, including brochures, business cards, stationery, business forms, folders, labels, and invitations. Customers will be able to design, view, and modify a product and either immediately place their order or save their work-in-progress to order at a later date. Customers will also be able to send free custom electronic greeting cards and electronic stationery directly from the PrintingSolutions.com website. For print items or quantities not offered in the self-service website, the company will respond to customer requests for specialized projects with individualized price quotes.
- Comprehensive customer service. PrintingSolutions.com will offer a broad range of customer services during all phases of the ordering and fulfillment process. After each order is placed, an email message will be automatically generated to the customer that itemizes the order, the total cost, and reiterates the estimated delivery time. The company will electronically receive order confirmation, printing, and delivery information from its commercial print vendors and make this information accessible to customers through a password-protected mechanism, enabling the customer to easily check an order’s status online or even cancel the order if it has not yet been printed. An additional email will also be sent once the customer’s order is shipped.
For specialized printing services, PrintingSolutions.com will provide customer service through a combination of electronic and personal assistance. In addition to the above mentioned benefits, we will provide our customers with significant advantages over commercial print vendors. Based on knowledge within the commercial printing industry, we believe that, by integrating our technologies into those of our commercial print vendors and utilizing the “what-you-see-is-what-you-get” approach, we will significantly reduce reprint-due-to-error rates and print wastage.
4.3.4 Main Competitors
The prime competitive threat comes from iPrint.com, a company that currently dominates the market. Its weakness, however, is charging too much. iPrint.com, is an Internet print shop that allows customers to create custom printed products. iPrint.com has developed cutting-edge technology and harnessed the power of the Internet to bring dramatic change to the centuries old printing industry. iPrint.com allows customers to design and order customized printed products such as business cards, office stationery, business checks and forms, personalized company post-it notes, logo coffee cups, promotional t-shirts and photo mouse pads. The company focuses on the business market.
Competitive threats also come from any company that is able to provide the services offered by PrintingSolutions.com at lower prices. The only way to accomplish that is for other companies to have what PrintingSolutions.com will have in terms of knowledge and overseas resources, both in the Internet technology field and printing resources.
The focus of competitors is on printing services, which are grossly overpriced. PrintingSolutions.com will focus on providing more than just printing: the company plans to provide an environment where companies can get their business running as quickly as possible for the best price. Additionally, once the B2B portion of the website is established, the company will be able to further promote competition and gain a larger customer base while limiting operational costs.
PrintingSolutions.com will differentiate itself from competitors by obtaining a global demand for its services. The company will constantly re-evaluate its rates and services to achieve a leading position in the industry, thus allowing customers to attain the services that PrintingSolutions.com provides with substantial savings over competitors’ prices.
The advantage of PrintingSolutions.com will be its team of highly-qualified professionals that have been working in the technology industry for years. Additionally, the company will benefit from having resources outside the United States, and will leverage them extremely well, while keeping the cost of operation down.
Strategy and Implementation Summary
The objective of PrintingSolutions.com is to become the leading online provider of printing and private-brand print services. As part of the ongoing strategy, the company plans to:
- Create New Services. Capitalize on being one of the first online print shops to target the business market by aggressively introducing new printing services and promotions.
- Build brand recognition. Build brand recognition by promoting the PrintingSolutions.com brand through diverse marketing channels, such as online advertising, public relations, and trade-show participation.
- Expand relationships. Expand the company’s marketing relationships by aggressively developing new relationships with leading destination websites and media companies. This will accelerate customer acquisition and increase usage of our online print shop.
- Build customer base. Build a customer base and stimulate repeat usage by exposing customers to products and services that most closely meet their needs.
- Expand services. Expand Printing Solution’s specialized print services by creating a range of new online printing services and aggressively marketing these services to current and future customer bases.
- Expand private-brand initiatives. Expand Printing Solution’s private-brand initiatives by entering into new relationships with a variety of companies to increase distribution and sales channels, and increase the usage of print services.
- Leverage and extend technology. Leverage and extend the company’s technology platform by enhancing the functionality of the PrintingSolutions.com and PrintingSolutionsB2B.com websites and the technology that supports them. This will be done to improve order flow and reporting, expand service offerings, facilitate more complete integration with print vendors, expedite payment processing, and improve the efficiency of the system.
5.1 Competitive Edge
Through the online print shop, PrintingSolutions.com will offer consumers a single location to satisfy the majority of their printing needs. The company will develop a user-friendly website for obtaining professional quality, mass-market printed products. This will provide customers a compelling alternative to traditional print channels. PrintingSolutions.com will also offer specialized websites and printing services for print items or quantities that are not generally offered in the self-service print shop. By automating the print order process and connecting online print services to carefully selected commercial print vendors, it is believed that the costs of printing will be significantly reduced.
5.2 Marketing Strategy
PrintingSolutions.com will strive to develop the most recognized and trusted brand for printing services on the Internet. To expand our customer base and to extend the image of the company, we plan to aggressively promote the PrintingSolutions.com brand through a combination of online and traditional media advertising, public relations and participation in trade shows. The company also plans to expand our affiliate and co-branded online website strategies through agreements with a range of destination websites.
The company will be promoting PrintingSolutions.com and PrintingSolutionsB2B.com over the Internet through:
- Banner adds
- Providing a small percentage of the sales made through websites that list PrintingSolutions.com from which a customer makes a purchase.
Internet ads are an obvious choice because that is the nature of our business. Marketing will also be done through printed media such as national newspapers and magazines. Newspaper and magazine ads will be used since our customers include business people who read various publications. Television ads will be used in certain markets, as PrintingSolutions.com will be targeting large cities with a great number of businesses.
5.2.1 Positioning Statement
PrintingSolutions.com’ products and services will address the need for assisting customers in obtaining their business stationery, graphic art designs and websites at more affordable prices than are currently being offered.
5.2.2 Pricing Strategy
The company sets its pricing based on what competitors are offering, and cuts that number in half. Website development will be provided at a flat rate, with additional changes being billed at an hourly rate. PrintingSolutions.com will provide technical support as needed to ensure that a customer’s website gets up and running. We will provide free technical support for websites for their first six months. Beyond that, an hourly rate will be applied. Logo designs will also be charged at a flat rate and, as with the development of the websites, with additional changes being charged by the hour.
5.3 Sales Strategy
The company’s sales strategy will be relatively minimal since PrintingSolutions.com is offering distant, self-customizing services. It is expected that the company’s marketing efforts will bring customers to the website, and the benefits of convenience, customization and low price as advertised on the website will be the incentives to close a sale. Promotions and add-on products coupled with continuing low prices will create repeat business.
Most importantly, PrintingSolutions.com will provide our customers exactly what they want or there will be no charge.
5.3.1 Sales Forecast
The following table and charts show our projected sales and direct costs for the next three years.


| Sales Forecast | |||
| Year 1 | Year 2 | Year 3 | |
| Sales | |||
| Internet Printing Products | $250,000 | $2,910,000 | $5,820,000 |
| Other | $0 | $0 | $0 |
| Total Sales | $250,000 | $2,910,000 | $5,820,000 |
| Direct Cost of Sales | Year 1 | Year 2 | Year 3 |
| Internet Printing Products | $80,000 | $125,000 | $200,000 |
| Other | $0 | $0 | $0 |
| Subtotal Direct Cost of Sales | $80,000 | $125,000 | $200,000 |
5.4 Strategic Alliances
The company has strategic alliances with Network Systems, Software Developers, and Custom Designs and Printers. These alliances are valuable to us because they will allow the company to utilize the knowledge and resources of these firms with no additional cost to the business. PrintingSolutions.com plans to also form strategic alliances with search engines such as Yahoo! and Lycos to promote the website, as well as exploring the possibility of forming strategic partnerships with content providers such as America Online.
The e-marketplaces will become an enduring reality in the business landscape. While the growth of these venues will spur continuous change, the company will be participating in these e-marketplaces as buyers. PrintingSolutions.com will begin to experiment with these online marketplaces with a minimum of 1% of its procurement dollars. This level of effort will enable the company to optimize purchasing in a dynamic pricing world. There will be the added bonus of also understanding the different vertical markets so that, when the time comes, we will know where to look to form strategic alliances
The company also plans to pursue strategic relationships with leading destination websites and media companies in order to increase traffic to its website. By aggressively pursuing new relationships, we believe we can accelerate the acquisition of new customers and increase usage of our online print store.
5.5 Milestones
Sample Milestones topic text.
The milestones table and chart show the specific detail about actual program activities that should be taking place during the year. Each one has its manager, starting date, ending date, and budget. During the year we will be keeping track of implementation against plan, with reports on the timely completion of these activities as planned.
| Milestones | |||||
| Milestone | Start Date | End Date | Budget | Manager | Department |
| Sample Milestones | 1/4/2008 | 1/4/2008 | $0 | ABC | Department |
| Finish Business Plan | 4/29/2009 | 5/29/2009 | $100 | Dude | Boss |
| Acquire Financing | 5/9/2009 | 6/28/2009 | $200 | Dudette | Legumers |
| Ah HA! Event | 5/19/2009 | 5/24/2009 | $60 | Marianne | Bosses |
| Oh NO! Event | 6/28/2009 | 7/3/2009 | $0 | Gloworm | Nobs |
| Grande Opening | 6/28/2009 | 7/3/2009 | $500 | Gloworm | Nobs |
| Marketing Program Starts | 5/29/2009 | 6/23/2009 | $1,000 | Glower | Marketeers |
| Plan vs. Actual Review | 10/24/2009 | 10/31/2009 | $0 | Galore | Alles |
| First Break-even Month | 2/25/2010 | 3/27/2010 | $0 | Bouys | Salers |
| Hire Employees | 1/24/2010 | 2/23/2010 | $150 | Gulls | HRM |
| Upgrade Business Plan Pro | 4/14/2010 | 4/16/2010 | $100 | Brass | Bossies |
| Totals | $2,110 | ||||
Web Plan Summary
PrintingSolutions.com will offer printing, website and graphic art design at affordable prices. The company’s proprietary product will be a website that will provide customers an avenue to create business stationery. PrintingSolutions.com will allow customers to track their purchases from start to finish. They will be able to view their selections online and make modifications at any time; customers will have access to service 24 hours a day, seven days a week.
6.1 Development Requirements
The software that supports the online print shop is a collection of integrated software modules that will enable PrintingSolutions.com to quickly create, maintain, modify, or replace individual components. PrintingSolutions.com will create its proprietary software modules using development and technical standards and practices, and without significant dependencies on specific operating systems, databases, or Web server technologies. As a result, the company will be able to move portions of its software between different databases, operating systems, and Web server products to upgrade capacity or take advantage of price or performance improvements, as they become available.
The following is a description of the key software modules that will be found on the PrintingSolutions.com website:
- Design Workshop. This will incorporate features found in desktop publishing software that enables customers to easily create a wide variety of custom-printed products. The workshop will be designed such that what customers build on the screen is what they will receive in their hands. This is achieved by considering all aspects needed to produce on-screen images and transferring them directly to the final printed product. Since customers will be able to view and proof their orders before they are printed, we believe the percentage of orders that shall require reprinting due to design error will be significantly reduced.
- Product and Pricing Engines. Our various engines will contain a wide range of product designs, features, and pricing information. To support the broad array of product variations and customization options offered, we will design these databases to be highly flexible. This will allow us to modify our records as the market dictates.
- Secure Shopping Cart. We will provide a customized order basket designed to store and securely process orders. The Secure Shopping Cart will be integrated with the systems of members, thus reducing the need for human intervention in order to produce and complete an order. The company believes that by designing the system in this manner, the order and completion process will be vastly more efficient and are less error prone than current processes.
- System Reporting and Diagnostics. This program is designed to track customer action on participating websites. PrintingSolutions.com will utilize this program in order to remain aware of industry and retail trends.
- Custom Website Resources. By allowing participants in the private-brand program to customize and control their own print shops, we will eliminate the need for costly, time-consuming programming efforts. We will allow these participants to directly manage product prices, configurations, and sales tax assignments, which decreases customization and maintenance expenses for PrintingSolutions.com.
6.2 System Standards and Integration
Design Standards
PrintingSolutions.com will offer the following design standards:
- High-speed operation.
- Optimized screens incorporating data from several modules on a single display.
- Great depth to handle the most sophisticated requirements.
- Tightly integrated standards to minimize errors, data entry, and time, and maximize the speed and information content on displays and printouts.
- Consistent look and feel, uniform prompts and similar data flow for every module.
- User-friendly. Rich in useful features such as help displays, pick boxes, numerous user-changeable flags and user-modified options.
Depth and Integration
PrintingSolutions.com will have depth, which means that the software will allow the customer to go beyond the basics. Depth will apply to each module individually: estimating, cost collection, and accounting. Software without depth is limited and can be frustrating to a consumer.
The company will have the ability to confirm customer information when processing an estimate. We will also be able to convert an estimate to a job and automatically allocate inventory, verify credit limits, allow for coverage, and put all outside buys on a ‘must buy’ list for purchasing and updating work-in-process. When a job is billed, all information will be fully automatic. Then, after billing, the work-in-process, job history, job archives, accounts receivable, sales tax, sales commission liability, sales revenue, production scheduling, active job file, and inventory files will all be automatically updated.
We will have depth in accounting. This implies the following:
- A job scan will be pre-billed or partially billed.
- The sales tax will be computed for all states taxes, including any county or local tax.
- More than one accounting period can be open at the same time.
- Allowing several bank accounts and classes of Accounts Receivable to automatically compute and track sales commissions and multiple plants with individual and consolidated financial statements.
Management Summary
Management will initially consist of Mr. Dalton Grant, president and CEO. Additionally, the company’s webmaster will act as assistant manager and oversee many of the day-to-day functions of the company.
Additional management personnel, such as a marketing manager and product managers, will be hired as growth dictates.
7.1 Organizational Structure
The company’s management philosophy will be based on responsibility and mutual respect. PrintingSolutions.com will maintain an environment and structure that will encourage productivity and respect for customers and fellow employees. Additionally, the environment will encourage employees to have fun by allowing creative independence and providing challenges that are realistic and rewarding. Printing Solution’s organizational structure is illustrated in the Personnel table below.
| Personnel Plan | |||
| Year 1 | Year 2 | Year 3 | |
| Dalton Grant | $34,785 | $35,000 | $47,825 |
| Webmaster | $52,175 | $52,174 | $52,174 |
| Website developers | $0 | $50,000 | $75,000 |
| Marketing Coordinator | $34,785 | $34,783 | $39,131 |
| Outsourcing Coordinator | $34,785 | $34,783 | $39,131 |
| Office Assistant | $17,390 | $17,391 | $17,391 |
| Total People | 5 | 5 | 5 |
| Total Payroll | $173,921 | $224,131 | $270,652 |
7.2 Management Team
Mr. Dalton Grant, President and CEO. Mr. Grant will be responsible for the direction and overall performance of PrintingSolutions.com. Mr. Grant was the CEO of Delta Printing Services. His previous positions included, Director of Network Systems Development in Nortel, in which he lead a team of over 350 people. His responsibilities at Nortel directly affected revenue of over $10 million.
Financial Plan
Funding Requirements and Uses
The company will be raising $2 million for the purposes of:
- Establishing an organization and office presence within the USA and overseas.
- Completing the development of the Internet print shop.
- Marketing the website and its services.
- Providing a world-class customer service website.
| Start-up Funding | |
| Start-up Expenses to Fund | $880,000 |
| Start-up Assets to Fund | $1,150,000 |
| Total Funding Required | $2,030,000 |
| Assets | |
| Non-cash Assets from Start-up | $200,000 |
| Cash Requirements from Start-up | $950,000 |
| Additional Cash Raised | $0 |
| Cash Balance on Starting Date | $950,000 |
| Total Assets | $1,150,000 |
| Liabilities and Capital | |
| Liabilities | |
| Current Borrowing | $500,000 |
| Long-term Liabilities | $450,000 |
| Accounts Payable (Outstanding Bills) | $0 |
| Other Current Liabilities (interest-free) | $0 |
| Total Liabilities | $950,000 |
| Capital | |
| Planned Investment | |
| Investor 1 | $400,000 |
| Investor 2 | $430,000 |
| Dalton Grant | $250,000 |
| Additional Investment Requirement | $0 |
| Total Planned Investment | $1,080,000 |
| Loss at Start-up (Start-up Expenses) | ($880,000) |
| Total Capital | $200,000 |
| Total Capital and Liabilities | $1,150,000 |
| Total Funding | $2,030,000 |
8.1 Financial Risks and Contingencies
PrintingSolutions.com currently has no operating history, which makes it difficult to forecast future operating results. The company will encounter risks and difficulties that start-ups frequently encounter in rapidly evolving and competitive markets. These risks include expanding the number of certified commercial print vendors and improving technological and logistical connections to these vendors. If these risks are not addressed successfully, the business will be seriously harmed.
Due to the nature of Internet business, the performance and fluctuations in quarterly sales and operating expenses will depend on the current marketplace and competition. The performance of PrintingSolutions.com will depend on market and industry risk factors that the company recognizes it will be subject to. The company’s view of its risks is as follows:
- Employee turnover. One of the biggest risks that all dot-com companies face today is the loss of key personnel. PrintingSolutions.com will minimize this risk by ensuring that our employees have a world-class working environment, which includes being paid competitive wages, excellent benefits, and stock options.
- Competitors. To mitigate this risk, we will closely monitor our competitors’ pricing structures, business strategies, and overall customer satisfaction to make sure we are one step ahead at all times.
- Economic Factors. To minimize this risk, we will diversify our position in the products and services that we offer, as well as planning to ensure there is always available cash flow and resources if the economy begins to show negative trends.
- Customer retention. The company will aggressively advertise its products and services and establish strategic alliances with industry leaders in order to generate a solid customer base and retain customers.
- Volume of transactions. The volume of transactions generated through the website and products for which we receive transaction fees.
- Downtime. Technical difficulties, system failures, or Internet downtime.
- Timing. The timing of large customer orders, or the failure to enter into strategic alliances.
- Costs. The amount and timing of operating costs and capital expenditures relating to expansion of the business, operations, and infrastructure.
- Pricing. Changes in our pricing policies or competitors’ pricing policies.
The success of PrintingSolutions.com will depend on a significant number of print-buying customers knowing about, and regularly using, our services. The market for Internet-enabled printing services is at an early stage of development. Many customers will be addressing issues such as quality, reliability, billing, delivery, and customer service for the first time in a self-service, Internet-based, print creation and ordering environment. Educating potential customers is a complex, time consuming and expensive process. In many cases, organizations must change established business practices and conduct business in new ways to use the services.
8.2 Important Assumptions
Nature and Limitation of Projections. This financial projection is based on sales volume at the levels described in the revenue section and presents, to the best of management’s knowledge and belief, the company’s expected assets, liabilities, capital, revenues, and expenses. The projections reflect management’s judgement of the expected conditions and its expected course of action given the hypothetical assumptions.
Nature of Operations. The company operates as an Oregon C-corporation.
Revenues. PrintingSolutions.com will generate revenues from the sale of a variety of printed products to end user customers. The company’s products and services will be available to customers through the PrintingSolutions.com and PrintingSolutionsB2B.com websites, managed PrintingSolutionsB2B.com affiliates and co-branded websites, and privately-branded websites.
The company will not recognize revenues until the product is shipped, collection of the receivable will be probable, and commercial print vendors have fulfilled all contractual obligations to the customer. PrintingSolutions.com will take title to all products that the company instructs its commercial print vendors to produce. PrintingSolutions.com believes that purchases by businesses will account for a majority of its revenues and will record sales net of discounts. The company will record the cost of promotional products that it will give away at no charge as a sales and marketing expense.
A significant portion of revenue will be generated through barter transactions with participants in the co-branded program in which PrintingSolutions.com will sell printed products in exchange for online advertising. Barter transaction revenues and related advertising costs will be recorded at the fair value of the goods or services provided or received, whichever will be more easily determined in the circumstances. The majority of revenues will be generated from sources within the United States; therefore, all sales will be in the United States dollar currency.
Expenses. The company’s expenses will be primarily those of salaries, sales commissions, and administrative costs. The company will categorize its operating expenses into research and development, sales and marketing, and general and administrative.
Research and development expenses will primarily consist of personnel costs, including costs related to consultants and outside contractors.
Sales and marketing expenses will consist of the cost of free promotional products, the cost of marketing programs including advertisements, costs to acquire email lists, personnel and related costs for our marketing staff and customer support groups, and participation in trade shows.
General and administrative expenses will primarily consist of personnel and related costs for corporate functions, including finance, accounting, legal, human resources, facilities, and management of commercial print vendor relationships.
Cost of sales. Cost of sales will primarily consist of direct expenses relating to printing products, rework and reprinting charges, shipping and handling fees, royalties on software licenses, and credit card processing fees.
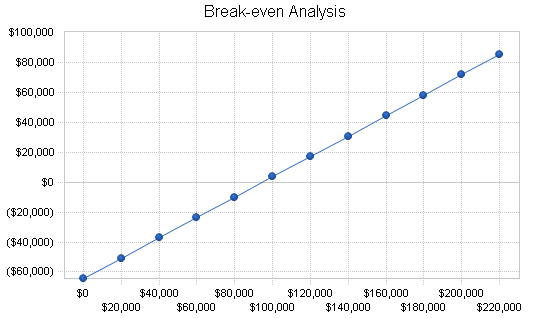
8.3 Break-even Analysis
The following chart and table outline the break-even analysis for PrintingSolutions.com.
| Break-even Analysis | |
| Monthly Revenue Break-even | $94,646 |
| Assumptions: | |
| Average Percent Variable Cost | 32% |
| Estimated Monthly Fixed Cost | $64,359 |
8.4 Projected Profit and Loss
PrintingSolutions.com is in the early stage of development; thus, initial projections have only been made on accounts that are believed to most drive the income statement. The following table provides Printing Solution’s projected income statements for 2000-2002. PrintingSolutions.com operates on a fiscal year ending in December. In order to reflect fiscal year projections of revenue and profit, only the last six months of year 2000 shows income. This reflects the projected launch date of the company.


| Pro Forma Profit and Loss | |||
| Year 1 | Year 2 | Year 3 | |
| Sales | $250,000 | $2,910,000 | $5,820,000 |
| Direct Cost of Sales | $80,000 | $125,000 | $200,000 |
| Other | $10,000 | $30,000 | $55,000 |
| Total Cost of Sales | $90,000 | $155,000 | $255,000 |
| Gross Margin | $160,000 | $2,755,000 | $5,565,000 |
| Gross Margin % | 64.00% | 94.67% | 95.62% |
| Expenses | |||
| Payroll | $173,921 | $224,131 | $270,652 |
| Marketing/Promotion | $429,998 | $360,000 | $565,000 |
| Depreciation | $0 | $0 | $0 |
| Software/IS expense | $90,000 | $60,000 | $85,000 |
| Contract Labor | $26,091 | $35,000 | $35,000 |
| Legal and Professiona expense | $20,002 | $10,000 | $10,000 |
| Bank charges | $2,300 | $2,000 | $2,000 |
| Rent | $30,000 | $15,000 | $15,000 |
| Payroll Taxes | $0 | $0 | $0 |
| Other | $0 | $0 | $0 |
| Total Operating Expenses | $772,312 | $706,131 | $982,652 |
| Profit Before Interest and Taxes | ($612,312) | $2,048,869 | $4,582,348 |
| EBITDA | ($612,312) | $2,048,869 | $4,582,348 |
| Interest Expense | $83,535 | $63,252 | $42,084 |
| Taxes Incurred | $0 | $496,404 | $1,153,984 |
| Net Profit | ($695,847) | $1,489,213 | $3,386,280 |
| Net Profit/Sales | -278.34% | 51.18% | 58.18% |
8.5 Projected Cash Flow
The following table has calculated that the company will have a negative cash outflow during the first year based on the start-up costs outlined in topic 2.0. However, the company will not begin financing or operations until July, 2000. In order to offset this supposed outflow, increases in the initial cash requirements in the Start-up table have been provided. The differences between calculated cash and actual needs will be used for other start-up costs. It is assumed that there will be no dividend payments for the first three years of business.

| Pro Forma Cash Flow | |||
| Year 1 | Year 2 | Year 3 | |
| Cash Received | |||
| Cash from Operations | |||
| Cash Sales | $62,500 | $727,500 | $1,455,000 |
| Cash from Receivables | $128,267 | $1,552,257 | $3,675,524 |
| Subtotal Cash from Operations | $190,767 | $2,279,757 | $5,130,524 |
| Additional Cash Received | |||
| Sales Tax, VAT, HST/GST Received | $0 | $0 | $0 |
| New Current Borrowing | $0 | $0 | $0 |
| New Other Liabilities (interest-free) | $0 | $0 | $0 |
| New Long-term Liabilities | $0 | $0 | $0 |
| Sales of Other Current Assets | $0 | $0 | $0 |
| Sales of Long-term Assets | $0 | $0 | $0 |
| New Investment Received | $0 | $0 | $0 |
| Subtotal Cash Received | $190,767 | $2,279,757 | $5,130,524 |
| Expenditures | Year 1 | Year 2 | Year 3 |
| Expenditures from Operations | |||
| Cash Spending | $173,921 | $224,131 | $270,652 |
| Bill Payments | $717,104 | $1,175,362 | $2,096,935 |
| Subtotal Spent on Operations | $891,024 | $1,399,493 | $2,367,587 |
| Additional Cash Spent | |||
| Sales Tax, VAT, HST/GST Paid Out | $0 | $0 | $0 |
| Principal Repayment of Current Borrowing | $166,656 | $166,656 | $166,688 |
| Other Liabilities Principal Repayment | $0 | $0 | $0 |
| Long-term Liabilities Principal Repayment | $45,000 | $45,000 | $45,000 |
| Purchase Other Current Assets | $0 | $0 | $0 |
| Purchase Long-term Assets | $0 | $0 | $0 |
| Dividends | $0 | $0 | $0 |
| Subtotal Cash Spent | $1,102,680 | $1,611,149 | $2,579,275 |
| Net Cash Flow | ($911,914) | $668,609 | $2,551,249 |
| Cash Balance | $38,086 | $706,695 | $3,257,944 |
8.6 Balance Sheet
The following table outlines some key financial information for PrintingSolutions.com.
| Pro Forma Balance Sheet | |||
| Year 1 | Year 2 | Year 3 | |
| Assets | |||
| Current Assets | |||
| Cash | $38,086 | $706,695 | $3,257,944 |
| Accounts Receivable | $59,233 | $689,476 | $1,378,952 |
| Inventory | $14,667 | $22,917 | $36,667 |
| Other Current Assets | $200,000 | $200,000 | $200,000 |
| Total Current Assets | $311,986 | $1,619,088 | $4,873,563 |
| Long-term Assets | |||
| Long-term Assets | $0 | $0 | $0 |
| Accumulated Depreciation | $0 | $0 | $0 |
| Total Long-term Assets | $0 | $0 | $0 |
| Total Assets | $311,986 | $1,619,088 | $4,873,563 |
| Liabilities and Capital | Year 1 | Year 2 | Year 3 |
| Current Liabilities | |||
| Accounts Payable | $69,489 | $99,033 | $178,917 |
| Current Borrowing | $333,344 | $166,688 | $0 |
| Other Current Liabilities | $0 | $0 | $0 |
| Subtotal Current Liabilities | $402,833 | $265,721 | $178,917 |
| Long-term Liabilities | $405,000 | $360,000 | $315,000 |
| Total Liabilities | $807,833 | $625,721 | $493,917 |
| Paid-in Capital | $1,080,000 | $1,080,000 | $1,080,000 |
| Retained Earnings | ($880,000) | ($1,575,847) | ($86,634) |
| Earnings | ($695,847) | $1,489,213 | $3,386,280 |
| Total Capital | ($495,847) | $993,366 | $4,379,646 |
| Total Liabilities and Capital | $311,986 | $1,619,088 | $4,873,563 |
| Net Worth | ($495,847) | $993,366 | $4,379,646 |
8.7 Business Ratios
The table below provides key ratios in the Industry Profile column for the commercial printing industry, as found in the Standard Industry Classifications (SIC) index, code 2759. We have projected healthy ratios for the first three years of operation, and foresee a continuing upwards trend throughout the company’s life.
| Ratio Analysis | ||||
| Year 1 | Year 2 | Year 3 | Industry Profile | |
| Sales Growth | 0.00% | 1064.00% | 100.00% | 2.00% |
| Percent of Total Assets | ||||
| Accounts Receivable | 18.99% | 42.58% | 28.29% | 27.00% |
| Inventory | 4.70% | 1.42% | 0.75% | 11.70% |
| Other Current Assets | 64.11% | 12.35% | 4.10% | 23.60% |
| Total Current Assets | 100.00% | 100.00% | 100.00% | 62.30% |
| Long-term Assets | 0.00% | 0.00% | 0.00% | 37.70% |
| Total Assets | 100.00% | 100.00% | 100.00% | 100.00% |
| Current Liabilities | 129.12% | 16.41% | 3.67% | 30.60% |
| Long-term Liabilities | 129.81% | 22.23% | 6.46% | 25.50% |
| Total Liabilities | 258.93% | 38.65% | 10.13% | 56.10% |
| Net Worth | -158.93% | 61.35% | 89.87% | 43.90% |
| Percent of Sales | ||||
| Sales | 100.00% | 100.00% | 100.00% | 100.00% |
| Gross Margin | 64.00% | 94.67% | 95.62% | 36.90% |
| Selling, General & Administrative Expenses | 280.80% | 47.95% | 39.59% | 19.10% |
| Advertising Expenses | 40.00% | 6.01% | 4.30% | 0.60% |
| Profit Before Interest and Taxes | -244.92% | 70.41% | 78.73% | 2.40% |
| Main Ratios | ||||
| Current | 0.77 | 6.09 | 27.24 | 2.06 |
| Quick | 0.74 | 6.01 | 27.03 | 1.44 |
| Total Debt to Total Assets | 258.93% | 38.65% | 10.13% | 56.10% |
| Pre-tax Return on Net Worth | 140.34% | 199.89% | 103.67% | 4.90% |
| Pre-tax Return on Assets | -223.04% | 122.64% | 93.16% | 11.20% |
| Additional Ratios | Year 1 | Year 2 | Year 3 | |
| Net Profit Margin | -278.34% | 51.18% | 58.18% | n.a |
| Return on Equity | 0.00% | 149.92% | 77.32% | n.a |
| Activity Ratios | ||||
| Accounts Receivable Turnover | 3.17 | 3.17 | 3.17 | n.a |
| Collection Days | 55 | 63 | 86 | n.a |
| Inventory Turnover | 10.91 | 6.65 | 6.71 | n.a |
| Accounts Payable Turnover | 11.32 | 12.17 | 12.17 | n.a |
| Payment Days | 27 | 26 | 23 | n.a |
| Total Asset Turnover | 0.80 | 1.80 | 1.19 | n.a |
| Debt Ratios | ||||
| Debt to Net Worth | 0.00 | 0.63 | 0.11 | n.a |
| Current Liab. to Liab. | 0.50 | 0.42 | 0.36 | n.a |
| Liquidity Ratios | ||||
| Net Working Capital | ($90,847) | $1,353,366 | $4,694,646 | n.a |
| Interest Coverage | -7.33 | 32.39 | 108.88 | n.a |
| Additional Ratios | ||||
| Assets to Sales | 1.25 | 0.56 | 0.84 | n.a |
| Current Debt/Total Assets | 129% | 16% | 4% | n.a |
| Acid Test | 0.59 | 3.41 | 19.33 | n.a |
| Sales/Net Worth | 0.00 | 2.93 | 1.33 | n.a |
| Dividend Payout | 0.00 | 0.00 | 0.00 | n.a |
Appendix
| Sales Forecast | |||||||||||||
| Month 1 | Month 2 | Month 3 | Month 4 | Month 5 | Month 6 | Month 7 | Month 8 | Month 9 | Month 10 | Month 11 | Month 12 | ||
| Sales | |||||||||||||
| Internet Printing Products | 0% | $0 | $0 | $0 | $0 | $0 | $0 | $41,667 | $43,667 | $42,667 | $41,667 | $40,667 | $39,667 |
| Other | 0% | $0 | $0 | $0 | $0 | $0 | $0 | $0 | $0 | $0 | $0 | $0 | $0 |
| Total Sales | $0 | $0 | $0 | $0 | $0 | $0 | $41,667 | $43,667 | $42,667 | $41,667 | $40,667 | $39,667 | |
| Direct Cost of Sales | Month 1 | Month 2 | Month 3 | Month 4 | Month 5 | Month 6 | Month 7 | Month 8 | Month 9 | Month 10 | Month 11 | Month 12 | |
| Internet Printing Products | $0 | $0 | $0 | $0 | $0 | $0 | $13,333 | $13,333 | $13,333 | $13,333 | $13,333 | $13,333 | |
| Other | $0 | $0 | $0 | $0 | $0 | $0 | $0 | $0 | $0 | $0 | $0 | $0 | |
| Subtotal Direct Cost of Sales | $0 | $0 | $0 | $0 | $0 | $0 | $13,333 | $13,333 | $13,333 | $13,333 | $13,333 | $13,333 | |
| Personnel Plan | |||||||||||||
| Month 1 | Month 2 | Month 3 | Month 4 | Month 5 | Month 6 | Month 7 | Month 8 | Month 9 | Month 10 | Month 11 | Month 12 | ||
| Dalton Grant | 0% | $2,899 | $2,899 | $2,899 | $2,899 | $2,899 | $2,899 | $2,899 | $2,899 | $2,899 | $2,899 | $2,899 | $2,899 |
| Webmaster | 0% | $4,348 | $4,348 | $4,348 | $4,348 | $4,348 | $4,348 | $4,348 | $4,348 | $4,348 | $4,348 | $4,348 | $4,348 |
| Website developers | 0% | $0 | $0 | $0 | $0 | $0 | $0 | $0 | $0 | $0 | $0 | $0 | $0 |
| Marketing Coordinator | 0% | $2,899 | $2,899 | $2,899 | $2,899 | $2,899 | $2,899 | $2,899 | $2,899 | $2,899 | $2,899 | $2,899 | $2,899 |
| Outsourcing Coordinator | 0% | $2,899 | $2,899 | $2,899 | $2,899 | $2,899 | $2,899 | $2,899 | $2,899 | $2,899 | $2,899 | $2,899 | $2,899 |
| Office Assistant | 0% | $1,449 | $1,449 | $1,449 | $1,449 | $1,449 | $1,449 | $1,449 | $1,449 | $1,449 | $1,449 | $1,449 | $1,449 |
| Total People | 5 | 5 | 5 | 5 | 5 | 5 | 5 | 5 | 5 | 5 | 5 | 5 | |
| Total Payroll | $14,494 | $14,494 | $14,494 | $14,494 | $14,494 | $14,494 | $14,493 | $14,493 | $14,493 | $14,493 | $14,493 | $14,493 | |
| Pro Forma Profit and Loss | |||||||||||||
| Month 1 | Month 2 | Month 3 | Month 4 | Month 5 | Month 6 | Month 7 | Month 8 | Month 9 | Month 10 | Month 11 | Month 12 | ||
| Sales | $0 | $0 | $0 | $0 | $0 | $0 | $41,667 | $43,667 | $42,667 | $41,667 | $40,667 | $39,667 | |
| Direct Cost of Sales | $0 | $0 | $0 | $0 | $0 | $0 | $13,333 | $13,333 | $13,333 | $13,333 | $13,333 | $13,333 | |
| Other | $0 | $0 | $0 | $0 | $0 | $0 | $1,667 | $1,667 | $1,667 | $1,667 | $1,667 | $1,667 | |
| Total Cost of Sales | $0 | $0 | $0 | $0 | $0 | $0 | $15,000 | $15,000 | $15,000 | $15,000 | $15,000 | $15,000 | |
| Gross Margin | $0 | $0 | $0 | $0 | $0 | $0 | $26,667 | $28,667 | $27,667 | $26,667 | $25,667 | $24,667 | |
| Gross Margin % | 0.00% | 0.00% | 0.00% | 0.00% | 0.00% | 0.00% | 64.00% | 65.65% | 64.84% | 64.00% | 63.11% | 62.18% | |
| Expenses | |||||||||||||
| Payroll | $14,494 | $14,494 | $14,494 | $14,494 | $14,494 | $14,494 | $14,493 | $14,493 | $14,493 | $14,493 | $14,493 | $14,493 | |
| Marketing/Promotion | $35,833 | $35,833 | $35,833 | $35,833 | $35,833 | $35,833 | $35,833 | $35,833 | $35,833 | $35,833 | $35,833 | $35,833 | |
| Depreciation | $0 | $0 | $0 | $0 | $0 | $0 | $0 | $0 | $0 | $0 | $0 | $0 | |
| Software/IS expense | $7,500 | $7,500 | $7,500 | $7,500 | $7,500 | $7,500 | $7,500 | $7,500 | $7,500 | $7,500 | $7,500 | $7,500 | |
| Contract Labor | $0 | $0 | $0 | $2,899 | $2,899 | $2,899 | $2,899 | $2,899 | $2,899 | $2,899 | $2,899 | $2,899 | |
| Legal and Professiona expense | $1,667 | $1,667 | $1,667 | $1,667 | $1,667 | $1,667 | $1,667 | $1,667 | $1,667 | $1,667 | $1,667 | $1,667 | |
| Bank charges | $50 | $50 | $50 | $50 | $50 | $50 | $333 | $333 | $333 | $333 | $333 | $333 | |
| Rent | $2,500 | $2,500 | $2,500 | $2,500 | $2,500 | $2,500 | $2,500 | $2,500 | $2,500 | $2,500 | $2,500 | $2,500 | |
| Payroll Taxes | 15% | $0 | $0 | $0 | $0 | $0 | $0 | $0 | $0 | $0 | $0 | $0 | $0 |
| Other | $0 | $0 | $0 | $0 | $0 | $0 | $0 | $0 | $0 | $0 | $0 | $0 | |
| Total Operating Expenses | $62,044 | $62,044 | $62,044 | $64,943 | $64,943 | $64,943 | $65,225 | $65,225 | $65,225 | $65,225 | $65,225 | $65,225 | |
| Profit Before Interest and Taxes | ($62,044) | ($62,044) | ($62,044) | ($64,943) | ($64,943) | ($64,943) | ($38,558) | ($36,558) | ($37,558) | ($38,558) | ($39,558) | ($40,558) | |
| EBITDA | ($62,044) | ($62,044) | ($62,044) | ($64,943) | ($64,943) | ($64,943) | ($38,558) | ($36,558) | ($37,558) | ($38,558) | ($39,558) | ($40,558) | |
| Interest Expense | $7,770 | $7,623 | $7,476 | $7,329 | $7,182 | $7,035 | $6,888 | $6,741 | $6,594 | $6,447 | $6,300 | $6,153 | |
| Taxes Incurred | $0 | $0 | $0 | $0 | $0 | $0 | $0 | $0 | $0 | $0 | $0 | $0 | |
| Net Profit | ($69,814) | ($69,667) | ($69,520) | ($72,272) | ($72,125) | ($71,978) | ($45,446) | ($43,299) | ($44,152) | ($45,005) | ($45,858) | ($46,711) | |
| Net Profit/Sales | 0.00% | 0.00% | 0.00% | 0.00% | 0.00% | 0.00% | -109.07% | -99.16% | -103.48% | -108.01% | -112.77% | -117.76% | |
| Pro Forma Cash Flow | |||||||||||||
| Month 1 | Month 2 | Month 3 | Month 4 | Month 5 | Month 6 | Month 7 | Month 8 | Month 9 | Month 10 | Month 11 | Month 12 | ||
| Cash Received | |||||||||||||
| Cash from Operations | |||||||||||||
| Cash Sales | $0 | $0 | $0 | $0 | $0 | $0 | $10,417 | $10,917 | $10,667 | $10,417 | $10,167 | $9,917 | |
| Cash from Receivables | $0 | $0 | $0 | $0 | $0 | $0 | $0 | $1,042 | $31,300 | $32,725 | $31,975 | $31,225 | |
| Subtotal Cash from Operations | $0 | $0 | $0 | $0 | $0 | $0 | $10,417 | $11,958 | $41,967 | $43,142 | $42,142 | $41,142 | |
| Additional Cash Received | |||||||||||||
| Sales Tax, VAT, HST/GST Received | 0.00% | $0 | $0 | $0 | $0 | $0 | $0 | $0 | $0 | $0 | $0 | $0 | $0 |
| New Current Borrowing | $0 | $0 | $0 | $0 | $0 | $0 | $0 | $0 | $0 | $0 | $0 | $0 | |
| New Other Liabilities (interest-free) | $0 | $0 | $0 | $0 | $0 | $0 | $0 | $0 | $0 | $0 | $0 | $0 | |
| New Long-term Liabilities | $0 | $0 | $0 | $0 | $0 | $0 | $0 | $0 | $0 | $0 | $0 | $0 | |
| Sales of Other Current Assets | $0 | $0 | $0 | $0 | $0 | $0 | $0 | $0 | $0 | $0 | $0 | $0 | |
| Sales of Long-term Assets | $0 | $0 | $0 | $0 | $0 | $0 | $0 | $0 | $0 | $0 | $0 | $0 | |
| New Investment Received | $0 | $0 | $0 | $0 | $0 | $0 | $0 | $0 | $0 | $0 | $0 | $0 | |
| Subtotal Cash Received | $0 | $0 | $0 | $0 | $0 | $0 | $10,417 | $11,958 | $41,967 | $43,142 | $42,142 | $41,142 | |
| Expenditures | Month 1 | Month 2 | Month 3 | Month 4 | Month 5 | Month 6 | Month 7 | Month 8 | Month 9 | Month 10 | Month 11 | Month 12 | |
| Expenditures from Operations | |||||||||||||
| Cash Spending | $14,494 | $14,494 | $14,494 | $14,494 | $14,494 | $14,494 | $14,493 | $14,493 | $14,493 | $14,493 | $14,493 | $14,493 | |
| Bill Payments | $1,844 | $55,315 | $55,168 | $55,117 | $57,773 | $57,626 | $58,477 | $86,793 | $72,468 | $72,321 | $72,174 | $72,027 | |
| Subtotal Spent on Operations | $16,338 | $69,809 | $69,662 | $69,611 | $72,267 | $72,120 | $72,970 | $101,286 | $86,961 | $86,814 | $86,667 | $86,520 | |
| Additional Cash Spent | |||||||||||||
| Sales Tax, VAT, HST/GST Paid Out | $0 | $0 | $0 | $0 | $0 | $0 | $0 | $0 | $0 | $0 | $0 | $0 | |
| Principal Repayment of Current Borrowing | $13,888 | $13,888 | $13,888 | $13,888 | $13,888 | $13,888 | $13,888 | $13,888 | $13,888 | $13,888 | $13,888 | $13,888 | |
| Other Liabilities Principal Repayment | $0 | $0 | $0 | $0 | $0 | $0 | $0 | $0 | $0 | $0 | $0 | $0 | |
| Long-term Liabilities Principal Repayment | $3,750 | $3,750 | $3,750 | $3,750 | $3,750 | $3,750 | $3,750 | $3,750 | $3,750 | $3,750 | $3,750 | $3,750 | |
| Purchase Other Current Assets | $0 | $0 | $0 | $0 | $0 | $0 | $0 | $0 | $0 | $0 | $0 | $0 | |
| Purchase Long-term Assets | $0 | $0 | $0 | $0 | $0 | $0 | $0 | $0 | $0 | $0 | $0 | $0 | |
| Dividends | $0 | $0 | $0 | $0 | $0 | $0 | $0 | $0 | $0 | $0 | $0 | $0 | |
| Subtotal Cash Spent | $33,976 | $87,447 | $87,300 | $87,249 | $89,905 | $89,758 | $90,608 | $118,924 | $104,599 | $104,452 | $104,305 | $104,158 | |
| Net Cash Flow | ($33,976) | ($87,447) | ($87,300) | ($87,249) | ($89,905) | ($89,758) | ($80,191) | ($106,965) | ($62,632) | ($61,310) | ($62,163) | ($63,016) | |
| Cash Balance | $916,024 | $828,577 | $741,277 | $654,028 | $564,123 | $474,365 | $394,174 | $287,209 | $224,576 | $163,266 | $101,103 | $38,086 | |
| Pro Forma Balance Sheet | |||||||||||||
| Month 1 | Month 2 | Month 3 | Month 4 | Month 5 | Month 6 | Month 7 | Month 8 | Month 9 | Month 10 | Month 11 | Month 12 | ||
| Assets | Starting Balances | ||||||||||||
| Current Assets | |||||||||||||
| Cash | $950,000 | $916,024 | $828,577 | $741,277 | $654,028 | $564,123 | $474,365 | $394,174 | $287,209 | $224,576 | $163,266 | $101,103 | $38,086 |
| Accounts Receivable | $0 | $0 | $0 | $0 | $0 | $0 | $0 | $31,250 | $62,958 | $63,658 | $62,183 | $60,708 | $59,233 |
| Inventory | $0 | $0 | $0 | $0 | $0 | $0 | $0 | $14,667 | $14,667 | $14,667 | $14,667 | $14,667 | $14,667 |
| Other Current Assets | $200,000 | $200,000 | $200,000 | $200,000 | $200,000 | $200,000 | $200,000 | $200,000 | $200,000 | $200,000 | $200,000 | $200,000 | $200,000 |
| Total Current Assets | $1,150,000 | $1,116,024 | $1,028,577 | $941,277 | $854,028 | $764,123 | $674,365 | $640,091 | $564,834 | $502,901 | $440,116 | $376,478 | $311,986 |
| Long-term Assets | |||||||||||||
| Long-term Assets | $0 | $0 | $0 | $0 | $0 | $0 | $0 | $0 | $0 | $0 | $0 | $0 | $0 |
| Accumulated Depreciation | $0 | $0 | $0 | $0 | $0 | $0 | $0 | $0 | $0 | $0 | $0 | $0 | $0 |
| Total Long-term Assets | $0 | $0 | $0 | $0 | $0 | $0 | $0 | $0 | $0 | $0 | $0 | $0 | $0 |
| Total Assets | $1,150,000 | $1,116,024 | $1,028,577 | $941,277 | $854,028 | $764,123 | $674,365 | $640,091 | $564,834 | $502,901 | $440,116 | $376,478 | $311,986 |
| Liabilities and Capital | Month 1 | Month 2 | Month 3 | Month 4 | Month 5 | Month 6 | Month 7 | Month 8 | Month 9 | Month 10 | Month 11 | Month 12 | |
| Current Liabilities | |||||||||||||
| Accounts Payable | $0 | $53,476 | $53,334 | $53,192 | $55,852 | $55,710 | $55,568 | $84,377 | $70,057 | $69,915 | $69,773 | $69,631 | $69,489 |
| Current Borrowing | $500,000 | $486,112 | $472,224 | $458,336 | $444,448 | $430,560 | $416,672 | $402,784 | $388,896 | $375,008 | $361,120 | $347,232 | $333,344 |
| Other Current Liabilities | $0 | $0 | $0 | $0 | $0 | $0 | $0 | $0 | $0 | $0 | $0 | $0 | $0 |
| Subtotal Current Liabilities | $500,000 | $539,588 | $525,558 | $511,528 | $500,300 | $486,270 | $472,240 | $487,161 | $458,953 | $444,923 | $430,893 | $416,863 | $402,833 |
| Long-term Liabilities | $450,000 | $446,250 | $442,500 | $438,750 | $435,000 | $431,250 | $427,500 | $423,750 | $420,000 | $416,250 | $412,500 | $408,750 | $405,000 |
| Total Liabilities | $950,000 | $985,838 | $968,058 | $950,278 | $935,300 | $917,520 | $899,740 | $910,911 | $878,953 | $861,173 | $843,393 | $825,613 | $807,833 |
| Paid-in Capital | $1,080,000 | $1,080,000 | $1,080,000 | $1,080,000 | $1,080,000 | $1,080,000 | $1,080,000 | $1,080,000 | $1,080,000 | $1,080,000 | $1,080,000 | $1,080,000 | $1,080,000 |
| Retained Earnings | ($880,000) | ($880,000) | ($880,000) | ($880,000) | ($880,000) | ($880,000) | ($880,000) | ($880,000) | ($880,000) | ($880,000) | ($880,000) | ($880,000) | ($880,000) |
| Earnings | $0 | ($69,814) | ($139,480) | ($209,000) | ($281,272) | ($353,397) | ($425,374) | ($470,821) | ($514,120) | ($558,272) | ($603,277) | ($649,136) | ($695,847) |
| Total Capital | $200,000 | $130,186 | $60,520 | ($9,000) | ($81,272) | ($153,397) | ($225,374) | ($270,821) | ($314,120) | ($358,272) | ($403,277) | ($449,136) | ($495,847) |
| Total Liabilities and Capital | $1,150,000 | $1,116,024 | $1,028,577 | $941,277 | $854,028 | $764,123 | $674,365 | $640,091 | $564,834 | $502,901 | $440,116 | $376,478 | $311,986 |
| Net Worth | $200,000 | $130,186 | $60,520 | ($9,000) | ($81,272) | ($153,397) | ($225,374) | ($270,821) | ($314,120) | ($358,272) | ($403,277) | ($449,136) | ($495,847) |

