
Water Tubes Plumbing
Executive Summary
Water Tubes Plumbing is a Eugene-based plumbing company that has chosen residential new homes as their niche. Water Tubes will be able to handle any service request for plumbing of volume home builds or custom new homes. By concentrating on a specific segment of the market, Water Tubes will be able to rapidly gain market share demonstrating their proficiency and professionalism in serving a specific market niche.
Water Tubes will leverage their competitive edges of professionalism and trim quality by properly training all of their employees and impress customers who are used to the lackadaisical attitude of most plumbers. Water Tubes will have a total of four employees and will reach profitability by month eight.
1.1 Objectives
The objectives for the first three years of operation include:
- To develop a company whose primary goal is to exceed customer’s expectations.
- To increase sales so in four to five years Don can hire another master plumber.
- To create a sustainable business, surviving off its own cash flow.
1.2 Mission
Water Tubes Plumbing’s mission is to provide the finest new house plumbing installation. We exist to attract and maintain customers. When we adhere to this maxim, everything else will fall into place. Our services will exceed the expectations of our customers.
1.3 Keys to Success
The keys to success are to provide the customer with a fair price and outstanding service.
Company Summary
Water Tubes Plumbing, soon to be located in Eugene, OR, will offer plumbing services for residential new houses as well as custom new houses. The business will be based out of Don Roto’s house. Water Tubes will have four employees by the end of the year.
2.1 Start-up Summary
Water Tubes will require the following equipment and materials:
- Two trucks (used) fitted with a pipe rack on top.
- Assorted pipes (different diameters and materials).
- Assorted fittings.
- A 30 gallon bucket to store fittings.
- Pipe wrenches.
- Reciprocating saw.
- Circular saw.
- Whole hog (high torque right angle drill).
- Cordless screw gun.
- Propane torch.
- Cast iron pipe cutter.
- Extension cords.
- Pipe dope (Teflon tape in paste form).
- Computer with CD-RW, printer, Microsoft Office, QuickBooks Pro.
- Desk, chair, and filling cabinet, and assorted stationary.
- Mobile phone.
Please note that the items which are considered assets to be used for more than a year will be labeled long-term assets and will be depreciated using G.A.A.P. approved straight-line depreciation method.
| Start-up | |
| Requirements | |
| Start-up Expenses | |
| Legal | $200 |
| Stationery etc. | $150 |
| Brochures | $0 |
| Consultants | $0 |
| Insurance | $0 |
| Rent | $0 |
| Research and Development | $0 |
| Expensed Equipment | $0 |
| Other | $0 |
| Total Start-up Expenses | $350 |
| Start-up Assets | |
| Cash Required | $19,650 |
| Other Current Assets | $0 |
| Long-term Assets | $24,000 |
| Total Assets | $43,650 |
| Total Requirements | $44,000 |
| Start-up Funding | |
| Start-up Expenses to Fund | $350 |
| Start-up Assets to Fund | $43,650 |
| Total Funding Required | $44,000 |
| Assets | |
| Non-cash Assets from Start-up | $24,000 |
| Cash Requirements from Start-up | $19,650 |
| Additional Cash Raised | $0 |
| Cash Balance on Starting Date | $19,650 |
| Total Assets | $43,650 |
| Liabilities and Capital | |
| Liabilities | |
| Current Borrowing | $0 |
| Long-term Liabilities | $0 |
| Accounts Payable (Outstanding Bills) | $0 |
| Other Current Liabilities (interest-free) | $0 |
| Total Liabilities | $0 |
| Capital | |
| Planned Investment | |
| Don | $24,000 |
| Friends and family | $20,000 |
| Other | $0 |
| Additional Investment Requirement | $0 |
| Total Planned Investment | $44,000 |
| Loss at Start-up (Start-up Expenses) | ($350) |
| Total Capital | $43,650 |
| Total Capital and Liabilities | $43,650 |
| Total Funding | $44,000 |
2.2 Company Ownership
Water Tubes Plumbing is a sole proprietorship owned by Don Roto.
Services
Water Tubes offers the finest in residential home plumbing construction as well as custom new home construction. Residential construction is chosen because it is straight forward and clean. Estimates are far more accurate and the company is dealing with a few contractors instead of many home owners. Additionally, there is no need to be on call 24 hours a day, a major downside of being a traditional plumber.
New construction will be typically bid at $1 per foot plus a multiple of $400 per fixture. Fixtures include sinks, toilets, tubs, etc.
The two other elements of Water Tubes services are professionalism and trim quality. Professionalism of Water Tubes is clearly a service offering that will be highlighted as well as trim quality which is the part of plumbing that is visible to the customer.
Market Analysis Summary
Water Tubes will be focusing on a specific niche in the plumbing market, new homes. The company will target both volume builders of new homes as well as customer builders.
Through a combination of networking activities and advertisements, Water Tubes will increase their visibility among home builders allowing them to gain market share.
4.1 Market Segmentation
Water Tubes will target two distinct segments in the plumbing market:
- Volume residential home builders. These builders are creating many different homes, often at the same time, often on the same plot of land. These builders are in need of a professional, well priced, reliable plumber for all of their residential new builds. This is an attractive market niche because the plumbing jobs are clean, numerous, and reasonably easy to do. Once a builder has found a plumbing company that they are happy with, a long-term relationship is often established, ensuring a constant flow of future jobs.
- Custom home builders. These builders are in need of a plumbing company for their custom projects. This segment is attractive because the margins are better than typical build jobs and the projects can be fun to do because it requires creativity and thoughtfulness to accomplish the task within the established designed constraints. This target market makes up a smaller percentage of Water Tubes forecasted sales.

| Market Analysis | |||||||
| Year 1 | Year 2 | Year 3 | Year 4 | Year 5 | |||
| Potential Customers | Growth | CAGR | |||||
| Volume home builder | 7% | 120 | 128 | 137 | 147 | 157 | 6.95% |
| Custom home builder | 7% | 45 | 48 | 51 | 55 | 59 | 7.01% |
| Total | 6.97% | 165 | 176 | 188 | 202 | 216 | 6.97% |
4.2 Target Market Segment Strategy
The plumbing market (excluding direct to the consumer jobs) is a highly networked industry where everyone knows everyone and jobs are won or loss by who you know. With this in mind, Don will work hard to establish himself as an experienced, professional plumber who is concentrating on the residential new builds market. This will be done in part through networking with all home builders. The networking will be an important method to increase visibility of Water Tubes because most home builders are always looking for professional, high-quality plumbers. It is advantageous for Water Tubes to position themselves as solely working with the residental new build market because it is attractive to builders to form a relationship with a plumber that is specializing on the new build market and not trying to do a little of everything. Water Tubes will be marketing themselves with an advertising campaign in the local home builders journal.
4.3 Service Business Analysis
The plumbing industry is state regulated. The state regulates the industry through a licensing process based upon the Universal Building Code. The code is state specific and is a comprehensive code for all building issues. There are three skill levels of plumbers. The first is the apprentice who is basically a skilled laborer. In Eugene, apprentices earn from $8-$12 an hour depending on experience level. The next level is a journeymen. To achieve the journeymen license you must past the state journeymen test. Journeymen in Eugene typically earn from approximately $18 an hour. The last step in the plumbing hierarchy is a master plumber. A master plumber is a journeymen with more than 10 years experience and their earning potential is from $35-$50 per hour.

In order to do work in the state, it is required that a deposit is made into the workers compensation fund of $4,000 during the first year. This is only for new companies that have no record of revenue, and no record of worker compensation history. After one year of no claims, $1,000 is refunded per year and after five years the entire amount is refunded. In essence, this is acting as a bond for newly formed companies.
The timetable for work in this niche is as follows:
- Two people, one full day, rough-in (plumbing in the floors and concrete).
- Two people, one full day, top-out (plumbing in the walls).
- One person, one full day trim (sections visible to the end-user).
Please note that within the industry ratios’ the gross margin for the industry is significantly lower than what is forecasted for Water Tubes. The variance can be explained by the fact that the industry ratios are for repair plumbing as well as new construction. The repair work is more parts intensive and has skewed the gross margin ratio.
4.3.1 Competition and Buying Patterns
The plumbing market is quite competitive, and consequently in order to reap decent profits, large quantity of work must be done. Competitors can be broken down into three groups:
- Chains: these plumbing companies are a franchise or a division of a larger chain. The chains typically do repair work instead of new building construction, but sometimes they do work with new builds.
- Private companies: these companies are typically local. In order to generate sufficient revenue, they will offer a wide range of services.
- Large commercial & residential companies: these are the local Starbucks of the plumbing world and will bid on any type of plumbing project, whether commercial or residential, repair or new builds. The majority of jobs that this competitor will work on is the larger commercial projects, but a getting a contract with a volume home builder would be attractive.
The buying habits of the target segments is based primarily on networking. Once a relationship is established, the builder will typically give the plumber one to two jobs to display their work before any type of long-term contract/relationship is developed.
Strategy and Implementation Summary
Water Tubes will first increase visibility through networking activities. Don will leverage his years as a local plumber working for a larger company. Once Water Tubes has developed visibility, they will highlight their competitive advantages of professionalism and trim quality with a test project for the builder. Generally, Water Tubes will be able to win over contracts after their initial display of workmanship.
5.1 Competitive Edge
Water Tubes has two competitive advantages that they will leverage to gain market share:
- Professionalism. Fortunately for Water Tubes, professionalism seems to be absent among many plumbers skill sets. Water Tubes will exhibit their professionalism in all aspects of customer interaction as well as job performance. It is very common for plumbers to bid out for more items that they can handle at once. This is done because the assumption is that they will not get all the jobs they bid for so it is likely that their job load will be balanced out in the long run. Some times this works, other times it fails. This is a common source of unprofessionalism that will not happen at Water Tubes. Additionally, all employees will be indoctrinated into this customer-centric culture, ensuring that all interactions with anyone from Water Tubes will be a positive experience.
- Trim Quality. This is the part of the job that is visible to the customer as opposed to the bulk of the work that is hidden behind cabinets and walls. There are not a lot of plumbing companies that have consistently good trim quality. This is one way that Water Tubes can easily stand out relative to the competitors. Having high trim quality is also an easy way to impress home builders since they will have to fix any issues that are unsatisfying to home-buyers, so sloppy trim work will usually have to be remedied at some point, usually when it is inconvenient.
5.2 Marketing Strategy
As mentioned earlier in the Target Market Segment Strategy, Water Tubes marketing campaign will be based on both networking as well as advertising.
- Networking. This will consist of meeting with builders that Don had worked with in the past, as well as others in the industry. Don will chat with them and let them know about his current venture and request a trial build to prove himself. Because the industry is so closely networked, whenever he runs into someone he will mention his new company. This will spread the word rather fast as contractors tend to bump into each other all over town, both socially as well as professionally.
- Advertising. Don will be running advertisements in the local home builders journal. This publication is a printed resource that home builders will typically consult when they are in need of a contractor for a specific service in the construction of their house. Because the readership is targeted and so closely interconnected, advertisements will be quite effective. Don will also put an advertisement in the Yellow Pages, however Don believes that the advertisements in the trade journal will be more effective due to the closer demographics and behavior factors of the readership group.
5.3 Sales Strategy
Water Tubes sales strategy will be to get at least one job with the new builder to provide them with an example of Water Tubes work. Based on the current competition, a display of Water Tubes competitive edges of professionalism and trim quality will likely be more than sufficient to turn a prospective customer into a long-term relationship.
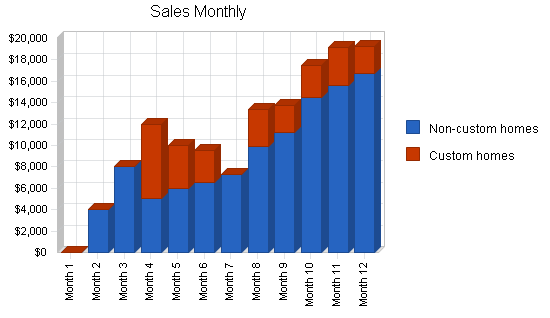
5.3.1 Sales Forecast
The first month will be used to set up the business. The second month will be used to train an employee as well as to undertake several jobs. The third month will be used to train two more employees as well as do a few other jobs. By the fourth month it is forecasted that Water Tubes will have a volume relationship with one builder. Month four will also see a custom home built. Month six will mark the development of another volume builder. From month six on there should be a steady increase in sales activity.

| Sales Forecast | |||
| Year 1 | Year 2 | Year 3 | |
| Sales | |||
| Non-custom homes | $104,858 | $151,987 | $165,454 |
| Custom homes | $29,000 | $38,765 | $49,876 |
| Total Sales | $133,858 | $190,752 | $215,330 |
| Direct Cost of Sales | Year 1 | Year 2 | Year 3 |
| Non-custom homes | $10,486 | $15,199 | $16,545 |
| Custom homes | $2,900 | $3,877 | $4,988 |
| Subtotal Direct Cost of Sales | $13,386 | $19,075 | $21,533 |
5.4 Milestones
Water Tubes will have several milestones:
- Business plan completion.
- Office set-up.
- Training of all employees.
- The establishment of the second volume home builder.
- Profitability.
| Milestones | |||||
| Milestone | Start Date | End Date | Budget | Manager | Department |
| Business plan completion | 1/1/2001 | 2/1/2001 | $0 | ABC | Marketing |
| Office set-up | 1/1/2001 | 2/1/2001 | $0 | ABC | Department |
| Training of all employees | 1/1/2001 | 4/1/2001 | $0 | ABC | Department |
| The establishment of the second volume home builder | 1/1/2001 | 7/1/2001 | $0 | ABC | Department |
| Profitability | 1/1/2001 | 9/1/2001 | $0 | ABC | Department |
| Totals | $0 | ||||
Management Summary
Don Roto received his Bachelor of Arts from the University of Portland. After college, Dan decided to learn more about plumbing, one of the odd jobs that he did in college. After six months of inconsistent work Don landed a job with a larger plumbing company that did both residential and commercial work. Don started as an apprentice, but within four months had passed his journeymen exam. Don continued to work for this company for ten years, receiving his master plumbing designation right at the ten year mark. At this point Don decided that he wanted to try operating his own company, leveraging skills learned in college as well as providing him the flexibility of being his own boss. It was at this point that he started writing the business plan for Water Tubes and eventually quit his job.
6.1 Personnel Plan
Don will be the only employee for the first month. Don will bring on board a second employee during month two, and two more employees on the third month. It is forecasted that Water Tubes will stay at four employees for the foreseeable future.
| Personnel Plan | |||
| Year 1 | Year 2 | Year 3 | |
| Don | $36,000 | $40,000 | $50,000 |
| Journeymen employee | $28,800 | $34,560 | $34,560 |
| Apprentice employee | $17,600 | $19,200 | $19,200 |
| Apprentice employee | $16,000 | $19,200 | $19,200 |
| Total People | 4 | 4 | 4 |
| Total Payroll | $98,400 | $112,960 | $122,960 |
Financial Plan
The following sections will outline important financial information.
7.1 Important Assumptions
The following table details important financial assumptions.
| General Assumptions | |||
| Year 1 | Year 2 | Year 3 | |
| Plan Month | 1 | 2 | 3 |
| Current Interest Rate | 10.00% | 10.00% | 10.00% |
| Long-term Interest Rate | 10.00% | 10.00% | 10.00% |
| Tax Rate | 30.00% | 30.00% | 30.00% |
| Other | 0 | 0 | 0 |
7.2 Break-even Analysis
The Break-even Analysis indicates what will be needed in monthly revenue to reach the break-even point.

| Break-even Analysis | |
| Monthly Revenue Break-even | $11,520 |
| Assumptions: | |
| Average Percent Variable Cost | 10% |
| Estimated Monthly Fixed Cost | $10,368 |
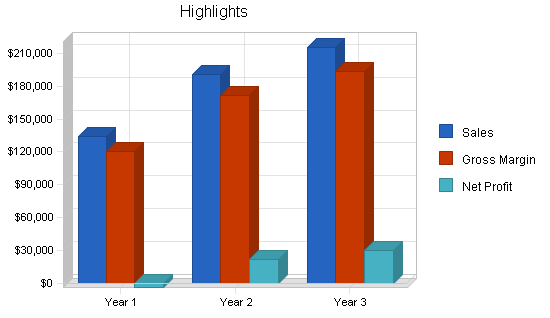
7.3 Projected Profit and Loss
The following table and charts present the projected profit and loss.


| Pro Forma Profit and Loss | |||
| Year 1 | Year 2 | Year 3 | |
| Sales | $133,858 | $190,752 | $215,330 |
| Direct Cost of Sales | $13,386 | $19,075 | $21,533 |
| Other Production Expenses | $0 | $0 | $0 |
| Total Cost of Sales | $13,386 | $19,075 | $21,533 |
| Gross Margin | $120,472 | $171,677 | $193,797 |
| Gross Margin % | 90.00% | 90.00% | 90.00% |
| Expenses | |||
| Payroll | $98,400 | $112,960 | $122,960 |
| Sales and Marketing and Other Expenses | $1,800 | $1,800 | $1,800 |
| Depreciation | $3,456 | $3,456 | $3,456 |
| Insurance/ License/ Bonds | $6,000 | $5,000 | $4,000 |
| Rent | $0 | $0 | $0 |
| Payroll Taxes | $14,760 | $16,944 | $18,444 |
| Other | $0 | $0 | $0 |
| Total Operating Expenses | $124,416 | $140,160 | $150,660 |
| Profit Before Interest and Taxes | ($3,944) | $31,517 | $43,137 |
| EBITDA | ($488) | $34,973 | $46,593 |
| Interest Expense | $0 | $0 | $0 |
| Taxes Incurred | $0 | $9,455 | $12,941 |
| Net Profit | ($3,944) | $22,062 | $30,196 |
| Net Profit/Sales | -2.95% | 11.57% | 14.02% |
7.4 Projected Cash Flow
The following chart and table display the projected cash flow.

| Pro Forma Cash Flow | |||
| Year 1 | Year 2 | Year 3 | |
| Cash Received | |||
| Cash from Operations | |||
| Cash Sales | $133,858 | $190,752 | $215,330 |
| Subtotal Cash from Operations | $133,858 | $190,752 | $215,330 |
| Additional Cash Received | |||
| Sales Tax, VAT, HST/GST Received | $0 | $0 | $0 |
| New Current Borrowing | $0 | $0 | $0 |
| New Other Liabilities (interest-free) | $0 | $0 | $0 |
| New Long-term Liabilities | $0 | $0 | $0 |
| Sales of Other Current Assets | $0 | $0 | $0 |
| Sales of Long-term Assets | $0 | $0 | $0 |
| New Investment Received | $0 | $0 | $0 |
| Subtotal Cash Received | $133,858 | $190,752 | $215,330 |
| Expenditures | Year 1 | Year 2 | Year 3 |
| Expenditures from Operations | |||
| Cash Spending | $98,400 | $112,960 | $122,960 |
| Bill Payments | $32,139 | $51,785 | $58,188 |
| Subtotal Spent on Operations | $130,539 | $164,745 | $181,148 |
| Additional Cash Spent | |||
| Sales Tax, VAT, HST/GST Paid Out | $0 | $0 | $0 |
| Principal Repayment of Current Borrowing | $0 | $0 | $0 |
| Other Liabilities Principal Repayment | $0 | $0 | $0 |
| Long-term Liabilities Principal Repayment | $0 | $0 | $0 |
| Purchase Other Current Assets | $0 | $0 | $0 |
| Purchase Long-term Assets | $0 | $0 | $0 |
| Dividends | $0 | $0 | $0 |
| Subtotal Cash Spent | $130,539 | $164,745 | $181,148 |
| Net Cash Flow | $3,319 | $26,007 | $34,182 |
| Cash Balance | $22,969 | $48,976 | $83,158 |
7.5 Projected Balance Sheet
The following table shows the projected balance sheet.
| Pro Forma Balance Sheet | |||
| Year 1 | Year 2 | Year 3 | |
| Assets | |||
| Current Assets | |||
| Cash | $22,969 | $48,976 | $83,158 |
| Other Current Assets | $0 | $0 | $0 |
| Total Current Assets | $22,969 | $48,976 | $83,158 |
| Long-term Assets | |||
| Long-term Assets | $24,000 | $24,000 | $24,000 |
| Accumulated Depreciation | $3,456 | $6,912 | $10,368 |
| Total Long-term Assets | $20,544 | $17,088 | $13,632 |
| Total Assets | $43,513 | $66,064 | $96,790 |
| Liabilities and Capital | Year 1 | Year 2 | Year 3 |
| Current Liabilities | |||
| Accounts Payable | $3,807 | $4,297 | $4,826 |
| Current Borrowing | $0 | $0 | $0 |
| Other Current Liabilities | $0 | $0 | $0 |
| Subtotal Current Liabilities | $3,807 | $4,297 | $4,826 |
| Long-term Liabilities | $0 | $0 | $0 |
| Total Liabilities | $3,807 | $4,297 | $4,826 |
| Paid-in Capital | $44,000 | $44,000 | $44,000 |
| Retained Earnings | ($350) | ($4,294) | $17,768 |
| Earnings | ($3,944) | $22,062 | $30,196 |
| Total Capital | $39,706 | $61,768 | $91,964 |
| Total Liabilities and Capital | $43,513 | $66,064 | $96,790 |
| Net Worth | $39,706 | $61,768 | $91,964 |
7.6 Business Ratios
The company’s projected business ratios are provided in the table below. The final column, Industry Profile, shows significant ratios for the Plumbing, Heating, Air-conditioning industry, as determined by the Standard Industry Classification (SIC) Index code 1711.
| Ratio Analysis | ||||
| Year 1 | Year 2 | Year 3 | Industry Profile | |
| Sales Growth | 0.00% | 42.50% | 12.88% | 6.60% |
| Percent of Total Assets | ||||
| Other Current Assets | 0.00% | 0.00% | 0.00% | 29.30% |
| Total Current Assets | 52.79% | 74.13% | 85.92% | 84.40% |
| Long-term Assets | 47.21% | 25.87% | 14.08% | 15.60% |
| Total Assets | 100.00% | 100.00% | 100.00% | 100.00% |
| Current Liabilities | 8.75% | 6.50% | 4.99% | 47.20% |
| Long-term Liabilities | 0.00% | 0.00% | 0.00% | 9.10% |
| Total Liabilities | 8.75% | 6.50% | 4.99% | 56.30% |
| Net Worth | 91.25% | 93.50% | 95.01% | 43.70% |
| Percent of Sales | ||||
| Sales | 100.00% | 100.00% | 100.00% | 100.00% |
| Gross Margin | 90.00% | 90.00% | 90.00% | 26.50% |
| Selling, General & Administrative Expenses | 92.95% | 78.43% | 75.98% | 14.60% |
| Advertising Expenses | 0.45% | 0.31% | 0.28% | 0.40% |
| Profit Before Interest and Taxes | -2.95% | 16.52% | 20.03% | 2.20% |
| Main Ratios | ||||
| Current | 6.03 | 11.40 | 17.23 | 1.87 |
| Quick | 6.03 | 11.40 | 17.23 | 1.47 |
| Total Debt to Total Assets | 8.75% | 6.50% | 4.99% | 56.30% |
| Pre-tax Return on Net Worth | -9.93% | 51.02% | 46.91% | 6.80% |
| Pre-tax Return on Assets | -9.06% | 47.71% | 44.57% | 15.50% |
| Additional Ratios | Year 1 | Year 2 | Year 3 | |
| Net Profit Margin | -2.95% | 11.57% | 14.02% | n.a |
| Return on Equity | -9.93% | 35.72% | 32.83% | n.a |
| Activity Ratios | ||||
| Accounts Payable Turnover | 9.44 | 12.17 | 12.17 | n.a |
| Payment Days | 27 | 28 | 28 | n.a |
| Total Asset Turnover | 3.08 | 2.89 | 2.22 | n.a |
| Debt Ratios | ||||
| Debt to Net Worth | 0.10 | 0.07 | 0.05 | n.a |
| Current Liab. to Liab. | 1.00 | 1.00 | 1.00 | n.a |
| Liquidity Ratios | ||||
| Net Working Capital | $19,162 | $44,680 | $78,332 | n.a |
| Interest Coverage | 0.00 | 0.00 | 0.00 | n.a |
| Additional Ratios | ||||
| Assets to Sales | 0.33 | 0.35 | 0.45 | n.a |
| Current Debt/Total Assets | 9% | 7% | 5% | n.a |
| Acid Test | 6.03 | 11.40 | 17.23 | n.a |
| Sales/Net Worth | 3.37 | 3.09 | 2.34 | n.a |
| Dividend Payout | 0.00 | 0.00 | 0.00 | n.a |
Appendix
| Sales Forecast | |||||||||||||
| Month 1 | Month 2 | Month 3 | Month 4 | Month 5 | Month 6 | Month 7 | Month 8 | Month 9 | Month 10 | Month 11 | Month 12 | ||
| Sales | |||||||||||||
| Non-custom homes | 0% | $0 | $4,000 | $8,000 | $5,000 | $6,000 | $6,545 | $7,332 | $9,876 | $11,232 | $14,454 | $15,654 | $16,765 |
| Custom homes | 0% | $0 | $0 | $0 | $7,000 | $4,000 | $3,000 | $0 | $3,500 | $2,500 | $3,000 | $3,500 | $2,500 |
| Total Sales | $0 | $4,000 | $8,000 | $12,000 | $10,000 | $9,545 | $7,332 | $13,376 | $13,732 | $17,454 | $19,154 | $19,265 | |
| Direct Cost of Sales | Month 1 | Month 2 | Month 3 | Month 4 | Month 5 | Month 6 | Month 7 | Month 8 | Month 9 | Month 10 | Month 11 | Month 12 | |
| Non-custom homes | $0 | $400 | $800 | $500 | $600 | $655 | $733 | $988 | $1,123 | $1,445 | $1,565 | $1,677 | |
| Custom homes | $0 | $0 | $0 | $700 | $400 | $300 | $0 | $350 | $250 | $300 | $350 | $250 | |
| Subtotal Direct Cost of Sales | $0 | $400 | $800 | $1,200 | $1,000 | $955 | $733 | $1,338 | $1,373 | $1,745 | $1,915 | $1,927 | |
| Personnel Plan | |||||||||||||
| Month 1 | Month 2 | Month 3 | Month 4 | Month 5 | Month 6 | Month 7 | Month 8 | Month 9 | Month 10 | Month 11 | Month 12 | ||
| Don | 0% | $3,000 | $3,000 | $3,000 | $3,000 | $3,000 | $3,000 | $3,000 | $3,000 | $3,000 | $3,000 | $3,000 | $3,000 |
| Journeymen employee | 0% | $0 | $0 | $2,880 | $2,880 | $2,880 | $2,880 | $2,880 | $2,880 | $2,880 | $2,880 | $2,880 | $2,880 |
| Apprentice employee | 0% | $0 | $1,600 | $1,600 | $1,600 | $1,600 | $1,600 | $1,600 | $1,600 | $1,600 | $1,600 | $1,600 | $1,600 |
| Apprentice employee | 0% | $0 | $0 | $1,600 | $1,600 | $1,600 | $1,600 | $1,600 | $1,600 | $1,600 | $1,600 | $1,600 | $1,600 |
| Total People | 1 | 2 | 4 | 4 | 4 | 4 | 4 | 4 | 4 | 4 | 4 | 4 | |
| Total Payroll | $3,000 | $4,600 | $9,080 | $9,080 | $9,080 | $9,080 | $9,080 | $9,080 | $9,080 | $9,080 | $9,080 | $9,080 | |
| General Assumptions | |||||||||||||
| Month 1 | Month 2 | Month 3 | Month 4 | Month 5 | Month 6 | Month 7 | Month 8 | Month 9 | Month 10 | Month 11 | Month 12 | ||
| Plan Month | 1 | 2 | 3 | 4 | 5 | 6 | 7 | 8 | 9 | 10 | 11 | 12 | |
| Current Interest Rate | 10.00% | 10.00% | 10.00% | 10.00% | 10.00% | 10.00% | 10.00% | 10.00% | 10.00% | 10.00% | 10.00% | 10.00% | |
| Long-term Interest Rate | 10.00% | 10.00% | 10.00% | 10.00% | 10.00% | 10.00% | 10.00% | 10.00% | 10.00% | 10.00% | 10.00% | 10.00% | |
| Tax Rate | 30.00% | 30.00% | 30.00% | 30.00% | 30.00% | 30.00% | 30.00% | 30.00% | 30.00% | 30.00% | 30.00% | 30.00% | |
| Other | 0 | 0 | 0 | 0 | 0 | 0 | 0 | 0 | 0 | 0 | 0 | 0 | |
| Pro Forma Profit and Loss | |||||||||||||
| Month 1 | Month 2 | Month 3 | Month 4 | Month 5 | Month 6 | Month 7 | Month 8 | Month 9 | Month 10 | Month 11 | Month 12 | ||
| Sales | $0 | $4,000 | $8,000 | $12,000 | $10,000 | $9,545 | $7,332 | $13,376 | $13,732 | $17,454 | $19,154 | $19,265 | |
| Direct Cost of Sales | $0 | $400 | $800 | $1,200 | $1,000 | $955 | $733 | $1,338 | $1,373 | $1,745 | $1,915 | $1,927 | |
| Other Production Expenses | $0 | $0 | $0 | $0 | $0 | $0 | $0 | $0 | $0 | $0 | $0 | $0 | |
| Total Cost of Sales | $0 | $400 | $800 | $1,200 | $1,000 | $955 | $733 | $1,338 | $1,373 | $1,745 | $1,915 | $1,927 | |
| Gross Margin | $0 | $3,600 | $7,200 | $10,800 | $9,000 | $8,591 | $6,599 | $12,038 | $12,359 | $15,709 | $17,239 | $17,339 | |
| Gross Margin % | 0.00% | 90.00% | 90.00% | 90.00% | 90.00% | 90.00% | 90.00% | 90.00% | 90.00% | 90.00% | 90.00% | 90.00% | |
| Expenses | |||||||||||||
| Payroll | $3,000 | $4,600 | $9,080 | $9,080 | $9,080 | $9,080 | $9,080 | $9,080 | $9,080 | $9,080 | $9,080 | $9,080 | |
| Sales and Marketing and Other Expenses | $150 | $150 | $150 | $150 | $150 | $150 | $150 | $150 | $150 | $150 | $150 | $150 | |
| Depreciation | $288 | $288 | $288 | $288 | $288 | $288 | $288 | $288 | $288 | $288 | $288 | $288 | |
| Insurance/ License/ Bonds | $500 | $500 | $500 | $500 | $500 | $500 | $500 | $500 | $500 | $500 | $500 | $500 | |
| Rent | $0 | $0 | $0 | $0 | $0 | $0 | $0 | $0 | $0 | $0 | $0 | $0 | |
| Payroll Taxes | 15% | $450 | $690 | $1,362 | $1,362 | $1,362 | $1,362 | $1,362 | $1,362 | $1,362 | $1,362 | $1,362 | $1,362 |
| Other | $0 | $0 | $0 | $0 | $0 | $0 | $0 | $0 | $0 | $0 | $0 | $0 | |
| Total Operating Expenses | $4,388 | $6,228 | $11,380 | $11,380 | $11,380 | $11,380 | $11,380 | $11,380 | $11,380 | $11,380 | $11,380 | $11,380 | |
| Profit Before Interest and Taxes | ($4,388) | ($2,628) | ($4,180) | ($580) | ($2,380) | ($2,790) | ($4,781) | $658 | $979 | $4,329 | $5,859 | $5,959 | |
| EBITDA | ($4,100) | ($2,340) | ($3,892) | ($292) | ($2,092) | ($2,502) | ($4,493) | $946 | $1,267 | $4,617 | $6,147 | $6,247 | |
| Interest Expense | $0 | $0 | $0 | $0 | $0 | $0 | $0 | $0 | $0 | $0 | $0 | $0 | |
| Taxes Incurred | $0 | $0 | $0 | $0 | $0 | $0 | $0 | $0 | $0 | $0 | $0 | $0 | |
| Net Profit | ($4,388) | ($2,628) | ($4,180) | ($580) | ($2,380) | ($2,790) | ($4,781) | $658 | $979 | $4,329 | $5,859 | $5,959 | |
| Net Profit/Sales | 0.00% | -65.70% | -52.25% | -4.83% | -23.80% | -29.22% | -65.21% | 4.92% | 7.13% | 24.80% | 30.59% | 30.93% | |
| Pro Forma Cash Flow | |||||||||||||
| Month 1 | Month 2 | Month 3 | Month 4 | Month 5 | Month 6 | Month 7 | Month 8 | Month 9 | Month 10 | Month 11 | Month 12 | ||
| Cash Received | |||||||||||||
| Cash from Operations | |||||||||||||
| Cash Sales | $0 | $4,000 | $8,000 | $12,000 | $10,000 | $9,545 | $7,332 | $13,376 | $13,732 | $17,454 | $19,154 | $19,265 | |
| Subtotal Cash from Operations | $0 | $4,000 | $8,000 | $12,000 | $10,000 | $9,545 | $7,332 | $13,376 | $13,732 | $17,454 | $19,154 | $19,265 | |
| Additional Cash Received | |||||||||||||
| Sales Tax, VAT, HST/GST Received | 0.00% | $0 | $0 | $0 | $0 | $0 | $0 | $0 | $0 | $0 | $0 | $0 | $0 |
| New Current Borrowing | $0 | $0 | $0 | $0 | $0 | $0 | $0 | $0 | $0 | $0 | $0 | $0 | |
| New Other Liabilities (interest-free) | $0 | $0 | $0 | $0 | $0 | $0 | $0 | $0 | $0 | $0 | $0 | $0 | |
| New Long-term Liabilities | $0 | $0 | $0 | $0 | $0 | $0 | $0 | $0 | $0 | $0 | $0 | $0 | |
| Sales of Other Current Assets | $0 | $0 | $0 | $0 | $0 | $0 | $0 | $0 | $0 | $0 | $0 | $0 | |
| Sales of Long-term Assets | $0 | $0 | $0 | $0 | $0 | $0 | $0 | $0 | $0 | $0 | $0 | $0 | |
| New Investment Received | $0 | $0 | $0 | $0 | $0 | $0 | $0 | $0 | $0 | $0 | $0 | $0 | |
| Subtotal Cash Received | $0 | $4,000 | $8,000 | $12,000 | $10,000 | $9,545 | $7,332 | $13,376 | $13,732 | $17,454 | $19,154 | $19,265 | |
| Expenditures | Month 1 | Month 2 | Month 3 | Month 4 | Month 5 | Month 6 | Month 7 | Month 8 | Month 9 | Month 10 | Month 11 | Month 12 | |
| Expenditures from Operations | |||||||||||||
| Cash Spending | $3,000 | $4,600 | $9,080 | $9,080 | $9,080 | $9,080 | $9,080 | $9,080 | $9,080 | $9,080 | $9,080 | $9,080 | |
| Bill Payments | $37 | $1,121 | $1,776 | $2,825 | $3,205 | $3,010 | $2,959 | $2,765 | $3,351 | $3,398 | $3,763 | $3,928 | |
| Subtotal Spent on Operations | $3,037 | $5,721 | $10,856 | $11,905 | $12,285 | $12,090 | $12,039 | $11,845 | $12,431 | $12,478 | $12,843 | $13,008 | |
| Additional Cash Spent | |||||||||||||
| Sales Tax, VAT, HST/GST Paid Out | $0 | $0 | $0 | $0 | $0 | $0 | $0 | $0 | $0 | $0 | $0 | $0 | |
| Principal Repayment of Current Borrowing | $0 | $0 | $0 | $0 | $0 | $0 | $0 | $0 | $0 | $0 | $0 | $0 | |
| Other Liabilities Principal Repayment | $0 | $0 | $0 | $0 | $0 | $0 | $0 | $0 | $0 | $0 | $0 | $0 | |
| Long-term Liabilities Principal Repayment | $0 | $0 | $0 | $0 | $0 | $0 | $0 | $0 | $0 | $0 | $0 | $0 | |
| Purchase Other Current Assets | $0 | $0 | $0 | $0 | $0 | $0 | $0 | $0 | $0 | $0 | $0 | $0 | |
| Purchase Long-term Assets | $0 | $0 | $0 | $0 | $0 | $0 | $0 | $0 | $0 | $0 | $0 | $0 | |
| Dividends | $0 | $0 | $0 | $0 | $0 | $0 | $0 | $0 | $0 | $0 | $0 | $0 | |
| Subtotal Cash Spent | $3,037 | $5,721 | $10,856 | $11,905 | $12,285 | $12,090 | $12,039 | $11,845 | $12,431 | $12,478 | $12,843 | $13,008 | |
| Net Cash Flow | ($3,037) | ($1,721) | ($2,856) | $95 | ($2,285) | ($2,545) | ($4,707) | $1,531 | $1,301 | $4,976 | $6,311 | $6,257 | |
| Cash Balance | $16,613 | $14,892 | $12,036 | $12,131 | $9,846 | $7,300 | $2,593 | $4,124 | $5,425 | $10,401 | $16,712 | $22,969 | |
| Pro Forma Balance Sheet | |||||||||||||
| Month 1 | Month 2 | Month 3 | Month 4 | Month 5 | Month 6 | Month 7 | Month 8 | Month 9 | Month 10 | Month 11 | Month 12 | ||
| Assets | Starting Balances | ||||||||||||
| Current Assets | |||||||||||||
| Cash | $19,650 | $16,613 | $14,892 | $12,036 | $12,131 | $9,846 | $7,300 | $2,593 | $4,124 | $5,425 | $10,401 | $16,712 | $22,969 |
| Other Current Assets | $0 | $0 | $0 | $0 | $0 | $0 | $0 | $0 | $0 | $0 | $0 | $0 | $0 |
| Total Current Assets | $19,650 | $16,613 | $14,892 | $12,036 | $12,131 | $9,846 | $7,300 | $2,593 | $4,124 | $5,425 | $10,401 | $16,712 | $22,969 |
| Long-term Assets | |||||||||||||
| Long-term Assets | $24,000 | $24,000 | $24,000 | $24,000 | $24,000 | $24,000 | $24,000 | $24,000 | $24,000 | $24,000 | $24,000 | $24,000 | $24,000 |
| Accumulated Depreciation | $0 | $288 | $576 | $864 | $1,152 | $1,440 | $1,728 | $2,016 | $2,304 | $2,592 | $2,880 | $3,168 | $3,456 |
| Total Long-term Assets | $24,000 | $23,712 | $23,424 | $23,136 | $22,848 | $22,560 | $22,272 | $21,984 | $21,696 | $21,408 | $21,120 | $20,832 | $20,544 |
| Total Assets | $43,650 | $40,325 | $38,316 | $35,172 | $34,979 | $32,406 | $29,572 | $24,577 | $25,820 | $26,833 | $31,521 | $37,544 | $43,513 |
| Liabilities and Capital | Month 1 | Month 2 | Month 3 | Month 4 | Month 5 | Month 6 | Month 7 | Month 8 | Month 9 | Month 10 | Month 11 | Month 12 | |
| Current Liabilities | |||||||||||||
| Accounts Payable | $0 | $1,063 | $1,682 | $2,718 | $3,105 | $2,912 | $2,868 | $2,654 | $3,238 | $3,272 | $3,632 | $3,796 | $3,807 |
| Current Borrowing | $0 | $0 | $0 | $0 | $0 | $0 | $0 | $0 | $0 | $0 | $0 | $0 | $0 |
| Other Current Liabilities | $0 | $0 | $0 | $0 | $0 | $0 | $0 | $0 | $0 | $0 | $0 | $0 | $0 |
| Subtotal Current Liabilities | $0 | $1,063 | $1,682 | $2,718 | $3,105 | $2,912 | $2,868 | $2,654 | $3,238 | $3,272 | $3,632 | $3,796 | $3,807 |
| Long-term Liabilities | $0 | $0 | $0 | $0 | $0 | $0 | $0 | $0 | $0 | $0 | $0 | $0 | $0 |
| Total Liabilities | $0 | $1,063 | $1,682 | $2,718 | $3,105 | $2,912 | $2,868 | $2,654 | $3,238 | $3,272 | $3,632 | $3,796 | $3,807 |
| Paid-in Capital | $44,000 | $44,000 | $44,000 | $44,000 | $44,000 | $44,000 | $44,000 | $44,000 | $44,000 | $44,000 | $44,000 | $44,000 | $44,000 |
| Retained Earnings | ($350) | ($350) | ($350) | ($350) | ($350) | ($350) | ($350) | ($350) | ($350) | ($350) | ($350) | ($350) | ($350) |
| Earnings | $0 | ($4,388) | ($7,016) | ($11,196) | ($11,776) | ($14,156) | ($16,946) | ($21,727) | ($21,068) | ($20,090) | ($15,761) | ($9,902) | ($3,944) |
| Total Capital | $43,650 | $39,262 | $36,634 | $32,454 | $31,874 | $29,494 | $26,705 | $21,923 | $22,582 | $23,560 | $27,889 | $33,748 | $39,706 |
| Total Liabilities and Capital | $43,650 | $40,325 | $38,316 | $35,172 | $34,979 | $32,406 | $29,572 | $24,577 | $25,820 | $26,833 | $31,521 | $37,544 | $43,513 |
| Net Worth | $43,650 | $39,262 | $36,634 | $32,454 | $31,874 | $29,494 | $26,705 | $21,923 | $22,582 | $23,560 | $27,889 | $33,748 | $39,706 |


