
4 Moons Pizzeria
Executive Summary
The following plan is based on years of experience, is highly focused and promises to follow a path of prosperity. It is based on conservative sales figures, and actual sales may be higher. The projections contained herein are authentic and will be used as the budget for the business. 4 Moons Pizzeria will show a profit almost immediately, and will increase sales and profits each year thereafter.
1.1 Objectives
The objective is to lease a site at 555 West Blue Plum Lane. We will need to remodel the interior according to the Franchisor’s design. We plan to duplicate and massage the successful formula used by Franchisor. We will use our own personal strategies and skills to create our own success in our 4 Moons Pizzeria. We plan to train our crew to ensure outstanding results in quality food and customer service. Our objectives are as follows.
- Be the first 4 Moons Pizzeria in Nevada
- Provide the highest quality product, duplicating Franchisor’s successful pizzerias in Oregon
- Give top notch service in a quick and efficient manner
- Keep our menu simple to maintain low food cost
- Maintain the competitive, fast-casual dining at the mid-range price point
- Use marketing strategies to build volume quickly
- First year sales over $677,000 with a 6% growth yearly
- Maintain and expand an outstanding reputation as being the best neighborhood pizzeria
1.2 Mission
4 Moons Pizzeria exists for the purpose of generating sales and profit. Because we are a service business, we will also exist to serve our customers. These two reasons for our existence are inextricable. If one aspect does not exist, the other will cease to exist.
- We will always offer a fresh product and welcoming environment
- We will remain cheerful, courteous, well trained, and focused on pleasing our guests
- We will strive to become the first destination of choice for those in our neighborhood and community
- Our staff will be offered a workplace where they can prosper and grow in a dignified, fun, and rewarding manner
- We will give support to and contribute to our community schools, churches, groups, and businesses
1.3 Keys to Success
Our policy of being operating managing members is to make sure we pass by every table to greet, visit with, or at least send a smile to our guests.
We will visit any table or answer to any phone call that has feedback, positive or negative. We will use every means available to satisfy our customers.
We will be committed to the success and happiness of our staff.
We will be committed to providing quality food and beverage at all times.
We will consistently follow the franchisor’s proven methods.
Company Summary
Established in 1958, 4 Moons Pizzerias are an award winning, “Home of the brick oven Pizza”. They offer a comfortable, friendly ambience, with its new “Modern Pizzeria” design. The menu features pizza, hot calzones, strombollis, sandwiches, baked pastas, and fresh tossed salads. The pizza dough is made fresh everyday on site. Beverages include soft drinks, imported and domestic beer, micro brews, and an impressive wine list. Food ingredients are the finest available including USDA Choice meats.
2.1 Company Ownership
We are an LLC, limited liability company, with four managing owners holding an equal share (25%) and interest in the franchise.
- Carol Mittani: General Managing Owner – Hands-on management of all daily restaurant and company operations.
- Steve Solutrian: Vice Managing Owner / Sales and restaurant operations. Hands-on management of daily operations and sales trends.
- Diane Solutrian: Vice Managing Owner / All office procedures. Hands-on management of daily operations.
- Rikard Mittani: Vice Managing Owner / Marketing and future finances and investments. Hands-on management of daily operations.
2.2 Start-up Summary
We hope to take advantage of an existing structure located at 555 West Blue Plum Lane, at Lakeside Center. It is 2,828 square feet. We will remodel according to the Franchisor’s designs to make our concept both visually and functionally suitable.
Construction is estimated at $214,630 – see attached “Franchisor’s Construction Cost Sheet” for item breakdown.*
Start-up cash on hand is estimated for 3 months working capital, inventory, labor and rent.
Short-term assets include phone equipment, smallwares, booths, chairs, tables, pendants, sconces, and lighting.
Long-term assets include all kitchen equipment, POS system, and signage.
*Confidential and proprietary information omitted from this sample plan.
| Start-up | |
| Requirements | |
| Start-up Expenses | |
| Remodel Costs | $214,630 |
| Proscreen/Wallpaper-Menu Boards | $3,644 |
| Insurance | $1,500 |
| Franchise Fee | $25,000 |
| 1st month rent | $4,242 |
| Drafting/Engineering | $3,000 |
| City fees/Misc costs | $2,491 |
| Beer and wine license | $500 |
| Training/travel | $2,000 |
| Utility start-up costs | $5,000 |
| Design | $4,200 |
| Total Start-up Expenses | $266,207 |
| Start-up Assets | |
| Cash Required | $87,286 |
| Start-up Inventory | $10,000 |
| Other Current Assets | $41,775 |
| Long-term Assets | $99,732 |
| Total Assets | $238,793 |
| Total Requirements | $505,000 |
Services
4 Moons Pizzerias are comfortable and inviting. We are a fast-casual operation with dine in, take-out, and delivery. The decor and theme are centered around the cutting edge open kitchen with brick arches and distinctive lighting. Our energy and atmosphere will appeal to families, groups, and schools.
The real power and energy of the pizzeria will come from the attentive and courteous service provided by our managers and staff. Our fresh menu will be prepared by our motivated kitchen team, and carefully orchestrated to provide the best service to our customers who are our priority. We will have at least one manager on duty at all times.
Our hours are Sunday thru Thursday 11 am. to 10 pm. Friday and Saturday 11 am. to 11 pm. Take out available during store hours. Delivery hours are 4 pm to closing everyday we are open. We will offer delivery all day on Saturday and Sunday and some holidays.
Market Analysis Summary
Ohno is one of the fastest growing cities in America with Nevada being voted the best small business state in the country. Ohno is a community diverse in the arts and culture. We have a strong labor market, low taxes, affordable housing, and natural amenities making Ohno an attractive place to live and do business.
The greater Ohno metropolitan area population has grown one third through the last decade and is projected to grow 11.4% in the next five years.
The median age is 36 years old with household incomes averaging $65,895. With a strong local economy we have a population with disposable cash for dining and entertainment.
According to the Nevada Restaurant Association, Nevada restaurants are expected to lead the nation in sales growth at 7.6%. Nevada is also the fastest growing state in the union.
4.1 Market Segmentation
4 Moons target market is a three mile radius of site location. Within the three mile operating radius is a population of 121,705. The total number of households in this area is 48,839 with an average income of $58,197.
This area is densely populated, and a desirable part of town in which to live. It is an under-served portion of town, especially to the west up to the Caughlin Ranch area. It is on one of the most traveled corridors in Ohno, Blue Plum Lane. Located near two of Ohno’s most popular malls, Parklane and Shopper’s Square.
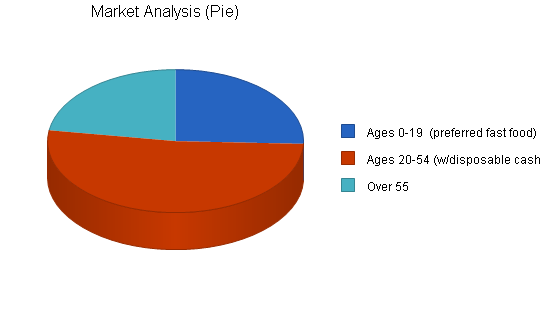
Our target market includes adults 20 to 54 years old who socialize and have families. Children are a big part of our market, at a third of the population is this area. Ages 4 to 19 prefer pizza over any fast food and often influence family dining decisions. According to one study, 93% of the U.S. population eats pizza. If we sold one pizza per month with an average of $17.00 per household, we would generate $721,141 in one month. This illustrates that with effective marketing, superior product, and proper management we will reach and exceed our projected sales goals.

In this area we have some of the best schools. 4 Moons Pizzerias provides support for local area school groups and sports teams, as well as local church groups. We will be involved through providing sponsorships, discounts, and donations.
| Market Analysis | |||||||
| Year 1 | Year 2 | Year 3 | Year 4 | Year 5 | |||
| Potential Customers | Growth | CAGR | |||||
| Ages 0-19 (preferred fast food) | 4% | 30,426 | 31,643 | 32,909 | 34,225 | 35,594 | 4.00% |
| Ages 20-54 (w/disposable cash) | 4% | 61,583 | 64,046 | 66,608 | 69,272 | 72,043 | 4.00% |
| Over 55 | 3% | 26,775 | 27,685 | 28,626 | 29,599 | 30,605 | 3.40% |
| Total | 3.87% | 118,784 | 123,374 | 128,143 | 133,096 | 138,242 | 3.87% |
4.2 Target Market Segment Strategy
We haven’t ruled any one group or class out in our target market area. Just about everyone eats pizza. Most residents in this area have busy schedules, and find value in exceptional and timely service, as well as mouth watering, delightful food. We believe most everyone will appreciate our value based menu and family atmosphere. We have a strong commitment to community involvement including sponsorship for school/group teams.
We strongly believe we will overcome any competition in our area. The local competition includes Sticky Paws Pizza, Damynos, Gridlow’s Pizza, Hoopla Take-and-Bake, Clodhopper’s, and Little Sayzar. Most of these are at least two miles from our location and are no competition to our concepts, ideals, fresh products, and welcoming service.
4.3 Service Business Analysis
Pizza Statistics:
- Represent 17% of all restaurants.
- Americans eat approximately 100 acres of pizza a day.
- Pizza is a $32+ billion per year industry with continuing overall restaurant growth.
- Accounts for 10% of all food service sales.
- 93% of Americans eat pizza at least once a month.
- 67% of Americans order pizza for a casual evening with friends.
- Children between 3-11 prefer pizza over all other food groups.
4.3.1 Competition and Buying Patterns
4 Moons Pizzerias are competitive in the mid price point, fast casual dining market. With an average ticket of $17.00, we are priced above Hoopla Take-and-Bake and Damyno but below Squaretable.
Quality, Quick, and Simple is the goal of 4 Moons Pizzerias. The customers are provided with the highest quality product. Store design provides a warm and friendly environment for all.
Strategy and Implementation Summary
Emphasize service
We will differentiate ourselves with SERVICE! We will establish our business offering as a clear and viable alternative for our target market.
Build a relationship-oriented business
Build long-term relationships with customers, not single-visit deals. Become their restaurant and destination of choice. Make them understand the value of the relationship.
Focus on target markets
We need to focus our offerings on specific population groups as the key market segment we should own. We do not want to compete for the buyers who go to “fast food” or “take and bake” types of restaurants. We definitely want to be able to sell to smart, quality conscious customers.
Utilize the various skills of our Managing Owners and learn through the extensive training program provided by Franchisor.
5.1 Competitive Edge
Clearly our competitive edge will be our customer service experience and management approach. Our smiling, unassuming, and good natured approach to all of our customers will be evident, and highly appreciated.
We will constantly monitor our product to ensure quality food and beverage at all times. Our recipes are delicious, made fresh daily, and our toppings go all the way to the edge of the pizza crust.
5.2 Marketing Strategy
We will start our marketing during the construction phase. Our main factor in success is simply that a person can enjoy a good pizza, fast service, and friendly familiar faces.
We will all be involved in Sales and Marketing. We will gather information about the neighborhoods, use our POS System to track top sellers and gather a customer base for marketing offers.
- Kids school tours
- Gift Certificate Program
- Phone book advertisement
- Coupons
- Door hangers
- Sporting events for schools and group events
- Eye catching signage
- Excellent service and high quality food
- Word of mouth
5.3 Sales Strategy
The marketing strategy discussed previously in this business plan will generate the desired sales.
We require our staff to have a thorough and comprehensive understanding of the menus, ingredients and methods of preparation of all of our foods. We train our staff to always describe and recommend items, even to regular customers, and to always up-sell. The key to our employee’s success in up-selling is the realization that it almost always brings in better tips because the checks are higher.
We will emphasize service to differentiate ourselves. We will establish our business offerings as a clear and viable alternative for our target market, from the scores of “slow delivery”, “frozen dough”, and “your average” pizza chains.
We will build long-term relationships with our customers, becoming their destination of choice for delivery, take out, and dine in. We will sell ourselves as the best neighborhood and community pizzeria.
5.3.1 Sales Forecast
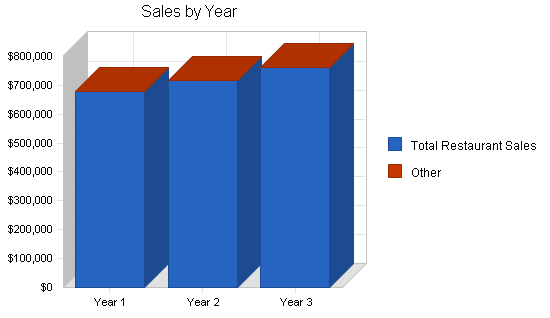
We are forecasting sales of approximately $677,000 in our first fiscal year (May 2005 to April 2006) with an opening date of mid-May 2005. We foresee sales increasing at .5% monthly, an overall yearly rate of 6% per year. Our forecast is conservative and is based on an average of $17.00 average per order.
We are convinced that our business will increase with time. We have a strong management team who will be on property daily to monitor daily operations. We will constantly watch food quality, customer service, and costs.

| Sales Forecast | |||
| Year 1 | Year 2 | Year 3 | |
| Sales | |||
| Total Restaurant Sales | $677,297 | $717,935 | $761,011 |
| Other | $0 | $0 | $0 |
| Total Sales | $677,297 | $717,935 | $761,011 |
| Direct Cost of Sales | Year 1 | Year 2 | Year 3 |
| Cost of Sales | $135,461 | $143,590 | $152,206 |
| Other | $0 | $0 | $0 |
| Subtotal Direct Cost of Sales | $135,461 | $143,590 | $152,206 |
Management Summary
4 Moons consists of four members with an equal concern in our franchise. We will owner operate our pizzeria daily. We will keep our starting salaries low to keep labor costs down. Each member contributes with a generalized assignment as well as being trained in all restaurant operations, including making pizza, working the counter, and delivering pizza. We are an extremely experienced, and well balanced team.
- Please see our attached resumes for a precise summary.*
Carol Mittani will be General Manager working every day to insure success. Steve Solutrian, Diane Solutrian, and Rikard Mittani will be on site various hours, and during peak dinner hours to help with general operational tasks, plus opening to closing hours on the weekend.
* Confidential and proprietary information omitted from this sample plan.
6.1 Personnel Plan
We plan to have a part-time staff to include pizza makers, delivery drivers, and counter persons. We are planning on a staff of 10 employees to come on at peak business levels.
Our first month will have a higher labor rate due to training, pre-opening preparation and grand opening labor.
We have forecasted labor at 18% of gross sales. We will strive to keep our payroll at 18% or lower.
| Personnel Plan | |||
| Year 1 | Year 2 | Year 3 | |
| Wages | $126,738 | $129,228 | $136,982 |
| Other | $0 | $0 | $0 |
| Total People | 14 | 14 | 14 |
| Total Payroll | $126,738 | $129,228 | $136,982 |
Financial Plan
Our main concerns will be aggressive time management to keep labor costs under control. Proper purchasing, food preparation and handling, and control of cheese consumption to keep food costs down. Growth will be sustained through increased sales.
7.1 Start-up Funding
Our start-up figures are approximate costs for start-up of a 4 Moons Pizzeria franchise as prescribed by the Franchisor.
4 Moons has $160,000 initial investment, $25,000 of which will cover the franchise fee.
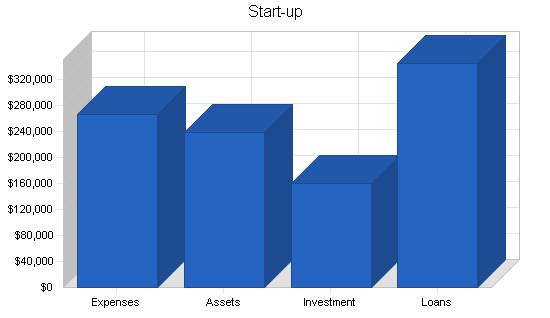
Our estimated start up is $505,000. We are seeking an SBA Loan in the amount of $345,000 (see Long term liability line).
| Start-up Funding | |
| Start-up Expenses to Fund | $266,207 |
| Start-up Assets to Fund | $238,793 |
| Total Funding Required | $505,000 |
| Assets | |
| Non-cash Assets from Start-up | $151,507 |
| Cash Requirements from Start-up | $87,286 |
| Additional Cash Raised | $0 |
| Cash Balance on Starting Date | $87,286 |
| Total Assets | $238,793 |
| Liabilities and Capital | |
| Liabilities | |
| Current Borrowing | $0 |
| Long-term Liabilities | $345,000 |
| Accounts Payable (Outstanding Bills) | $0 |
| Other Current Liabilities (interest-free) | $0 |
| Total Liabilities | $345,000 |
| Capital | |
| Planned Investment | |
| Solutrian, Steve and Diane | $75,000 |
| Mittani, Rikard and Carol | $75,000 |
| Additional Investment Requirement | $10,000 |
| Total Planned Investment | $160,000 |
| Loss at Start-up (Start-up Expenses) | ($266,207) |
| Total Capital | ($106,207) |
| Total Capital and Liabilities | $238,793 |
| Total Funding | $505,000 |
7.2 Important Assumptions
We are projecting profit based on the performance of other franchises and our own judgement based on the following:
- We assume by using marketing strategies, sales strategies, good customer relationships, fresh food, and good management practices, we will succeed.
- In order to meet the sales goal in the first year, open for at least 360 days, we would have to sell 111 checks each day with a $17 per check average.
- Our sales each day should reach an minimum average of $1,881.43.
- Our forecast is based on an average. Some months will increase and others decrease. We do not predict any major decreases in sales, as Ohno area restaurants are busy all year round.
| General Assumptions | |||
| Year 1 | Year 2 | Year 3 | |
| Plan Month | 1 | 2 | 3 |
| Current Interest Rate | 0.00% | 0.00% | 0.00% |
| Long-term Interest Rate | 7.00% | 7.00% | 7.00% |
| Tax Rate | 30.00% | 30.00% | 30.00% |
| Other | 0 | 0 | 0 |
7.3 Break-even Analysis
Break-even based on fixed costs including rent, insurance, maintenance, investor note, and pre-opening amortization. Additionally, controllables such as service labor, kitchen labor, management labor, excess rent, advertising, royalty, and legal/professional fees are included.

| Break-even Analysis | |
| Monthly Revenue Break-even | $22,254 |
| Assumptions: | |
| Average Percent Variable Cost | 20% |
| Estimated Monthly Fixed Cost | $17,804 |
7.4 Projected Profit and Loss
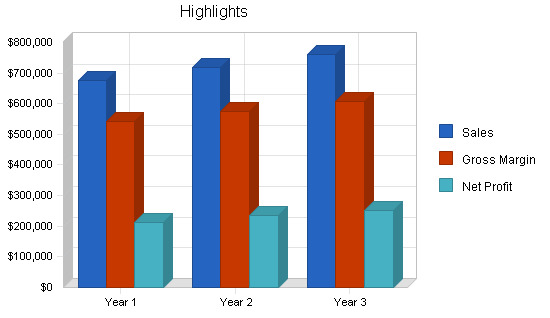
As the Profit and Loss table shows, the company expects to continue its steady growth in profitability over the next three years. We predicted a conservative 6% per year increase in sales.
The first month may have higher payroll due to employee training and restaurant set up.
Our operating expenses include rent at $4,242 estimate per month, royalty fees of 5% of gross sales, equipment rental and repair, utilities projected at 11% of gross sales, administrative charges including PC charges, cleaning supplies, payroll charges, and office supplies.
Marketing fees are 4% of gross sales per month.


| Pro Forma Profit and Loss | |||
| Year 1 | Year 2 | Year 3 | |
| Sales | $677,297 | $717,935 | $761,011 |
| Direct Cost of Sales | $135,461 | $143,590 | $152,206 |
| Other Costs of Sales | $0 | $0 | $0 |
| Total Cost of Sales | $135,461 | $143,590 | $152,206 |
| Gross Margin | $541,836 | $574,345 | $608,805 |
| Gross Margin % | 80.00% | 80.00% | 80.00% |
| Expenses | |||
| Payroll | $126,738 | $129,228 | $136,982 |
| Marketing/Promotion | $0 | $0 | $0 |
| Depreciation | $30,000 | $30,000 | $30,000 |
| Rent | $50,904 | $50,904 | $52,431 |
| Royalty fees | $0 | $0 | $0 |
| Equip rent/repair | $3,000 | $5,400 | $5,400 |
| Utilities | $0 | $0 | $0 |
| Admin charges | $3,000 | $3,000 | $3,000 |
| Total Operating Expenses | $213,642 | $218,532 | $227,813 |
| Profit Before Interest and Taxes | $328,194 | $355,813 | $380,992 |
| EBITDA | $358,194 | $385,813 | $410,992 |
| Interest Expense | $23,367 | $21,648 | $19,738 |
| Taxes Incurred | $91,448 | $100,249 | $108,376 |
| Net Profit | $213,378 | $233,915 | $252,878 |
| Net Profit/Sales | 31.50% | 32.58% | 33.23% |
7.5 Projected Cash Flow
The cash flow depends on assumptions for good daily operational management, good traffic counts in the restaurant, inventory turnover, payment days, and accounts receivable management. We do not predict any new financing until we open our second franchise.
Principal amounts are based on a loan of $345,000 with a 10 year SBA Loan at 7% interest.

| Pro Forma Cash Flow | |||
| Year 1 | Year 2 | Year 3 | |
| Cash Received | |||
| Cash from Operations | |||
| Cash Sales | $677,297 | $717,935 | $761,011 |
| Subtotal Cash from Operations | $677,297 | $717,935 | $761,011 |
| Additional Cash Received | |||
| Sales Tax, VAT, HST/GST Received | $0 | $0 | $0 |
| New Current Borrowing | $0 | $0 | $0 |
| New Other Liabilities (interest-free) | $0 | $0 | $0 |
| New Long-term Liabilities | $0 | $0 | $0 |
| Sales of Other Current Assets | $0 | $0 | $0 |
| Sales of Long-term Assets | $0 | $0 | $0 |
| New Investment Received | $0 | $0 | $0 |
| Subtotal Cash Received | $677,297 | $717,935 | $761,011 |
| Expenditures | Year 1 | Year 2 | Year 3 |
| Expenditures from Operations | |||
| Cash Spending | $126,738 | $129,228 | $136,982 |
| Bill Payments | $276,887 | $324,767 | $340,189 |
| Subtotal Spent on Operations | $403,625 | $453,995 | $477,171 |
| Additional Cash Spent | |||
| Sales Tax, VAT, HST/GST Paid Out | $0 | $0 | $0 |
| Principal Repayment of Current Borrowing | $0 | $0 | $0 |
| Other Liabilities Principal Repayment | $0 | $0 | $0 |
| Long-term Liabilities Principal Repayment | $22,576 | $26,332 | $28,237 |
| Purchase Other Current Assets | $0 | $0 | $0 |
| Purchase Long-term Assets | $0 | $0 | $0 |
| Dividends | $0 | $0 | $0 |
| Subtotal Cash Spent | $426,201 | $480,327 | $505,408 |
| Net Cash Flow | $251,096 | $237,608 | $255,603 |
| Cash Balance | $338,382 | $575,990 | $831,592 |
7.6 Projected Balance Sheet
The balance sheet is quite solid. We do not project any real trouble meeting our debt obligations–as long as we can achieve our specific sales objectives.
| Pro Forma Balance Sheet | |||
| Year 1 | Year 2 | Year 3 | |
| Assets | |||
| Current Assets | |||
| Cash | $338,382 | $575,990 | $831,592 |
| Inventory | $6,044 | $6,407 | $6,791 |
| Other Current Assets | $41,775 | $41,775 | $41,775 |
| Total Current Assets | $386,201 | $624,171 | $880,159 |
| Long-term Assets | |||
| Long-term Assets | $99,732 | $99,732 | $99,732 |
| Accumulated Depreciation | $30,000 | $60,000 | $90,000 |
| Total Long-term Assets | $69,732 | $39,732 | $9,732 |
| Total Assets | $455,933 | $663,903 | $889,891 |
| Liabilities and Capital | Year 1 | Year 2 | Year 3 |
| Current Liabilities | |||
| Accounts Payable | $26,338 | $26,725 | $28,071 |
| Current Borrowing | $0 | $0 | $0 |
| Other Current Liabilities | $0 | $0 | $0 |
| Subtotal Current Liabilities | $26,338 | $26,725 | $28,071 |
| Long-term Liabilities | $322,424 | $296,092 | $267,855 |
| Total Liabilities | $348,762 | $322,817 | $295,926 |
| Paid-in Capital | $160,000 | $160,000 | $160,000 |
| Retained Earnings | ($266,207) | ($52,829) | $181,086 |
| Earnings | $213,378 | $233,915 | $252,878 |
| Total Capital | $107,171 | $341,086 | $593,964 |
| Total Liabilities and Capital | $455,933 | $663,903 | $889,891 |
| Net Worth | $107,171 | $341,086 | $593,964 |
7.7 Business Ratios
The company’s projected business ratios are provided in the following table. The final column, Industry Profile, shows ratios for the “Pizza Restaurant Industry”, as determined by the Standard Industry Classification 5812.0600 with annual sales of $500,000 to $999,000.
| Ratio Analysis | ||||
| Year 1 | Year 2 | Year 3 | Industry Profile | |
| Sales Growth | 0.00% | 6.00% | 6.00% | 5.24% |
| Percent of Total Assets | ||||
| Inventory | 1.33% | 0.97% | 0.76% | 4.34% |
| Other Current Assets | 9.16% | 6.29% | 4.69% | 35.11% |
| Total Current Assets | 84.71% | 94.02% | 98.91% | 43.74% |
| Long-term Assets | 15.29% | 5.98% | 1.09% | 56.26% |
| Total Assets | 100.00% | 100.00% | 100.00% | 100.00% |
| Current Liabilities | 5.78% | 4.03% | 3.15% | 18.93% |
| Long-term Liabilities | 70.72% | 44.60% | 30.10% | 25.48% |
| Total Liabilities | 76.49% | 48.62% | 33.25% | 44.41% |
| Net Worth | 23.51% | 51.38% | 66.75% | 55.59% |
| Percent of Sales | ||||
| Sales | 100.00% | 100.00% | 100.00% | 100.00% |
| Gross Margin | 80.00% | 80.00% | 80.00% | 61.91% |
| Selling, General & Administrative Expenses | 48.50% | 47.42% | 46.77% | 39.08% |
| Advertising Expenses | 4.43% | 0.00% | 0.00% | 2.55% |
| Profit Before Interest and Taxes | 48.46% | 49.56% | 50.06% | 1.38% |
| Main Ratios | ||||
| Current | 14.66 | 23.36 | 31.35 | 1.14 |
| Quick | 14.43 | 23.12 | 31.11 | 0.79 |
| Total Debt to Total Assets | 76.49% | 48.62% | 33.25% | 49.97% |
| Pre-tax Return on Net Worth | 284.43% | 97.97% | 60.82% | 3.97% |
| Pre-tax Return on Assets | 66.86% | 50.33% | 40.60% | 7.93% |
| Additional Ratios | Year 1 | Year 2 | Year 3 | |
| Net Profit Margin | 31.50% | 32.58% | 33.23% | n.a |
| Return on Equity | 199.10% | 68.58% | 42.57% | n.a |
| Activity Ratios | ||||
| Inventory Turnover | 23.52 | 23.07 | 23.07 | n.a |
| Accounts Payable Turnover | 11.51 | 12.17 | 12.17 | n.a |
| Payment Days | 27 | 30 | 29 | n.a |
| Total Asset Turnover | 1.49 | 1.08 | 0.86 | n.a |
| Debt Ratios | ||||
| Debt to Net Worth | 3.25 | 0.95 | 0.50 | n.a |
| Current Liab. to Liab. | 0.08 | 0.08 | 0.09 | n.a |
| Liquidity Ratios | ||||
| Net Working Capital | $359,863 | $597,446 | $852,087 | n.a |
| Interest Coverage | 14.04 | 16.44 | 19.30 | n.a |
| Additional Ratios | ||||
| Assets to Sales | 0.67 | 0.92 | 1.17 | n.a |
| Current Debt/Total Assets | 6% | 4% | 3% | n.a |
| Acid Test | 14.43 | 23.12 | 31.11 | n.a |
| Sales/Net Worth | 6.32 | 2.10 | 1.28 | n.a |
| Dividend Payout | 0.00 | 0.00 | 0.00 | n.a |
Appendix
| Sales Forecast | |||||||||||||
| Month 1 | Month 2 | Month 3 | Month 4 | Month 5 | Month 6 | Month 7 | Month 8 | Month 9 | Month 10 | Month 11 | Month 12 | ||
| Sales | |||||||||||||
| Total Restaurant Sales | 0% | $28,750 | $57,500 | $57,788 | $58,076 | $58,366 | $58,658 | $58,952 | $59,246 | $59,542 | $59,840 | $60,139 | $60,440 |
| Other | 0% | $0 | $0 | $0 | $0 | $0 | $0 | $0 | $0 | $0 | $0 | $0 | $0 |
| Total Sales | $28,750 | $57,500 | $57,788 | $58,076 | $58,366 | $58,658 | $58,952 | $59,246 | $59,542 | $59,840 | $60,139 | $60,440 | |
| Direct Cost of Sales | Month 1 | Month 2 | Month 3 | Month 4 | Month 5 | Month 6 | Month 7 | Month 8 | Month 9 | Month 10 | Month 11 | Month 12 | |
| Cost of Sales | $5,750 | $11,500 | $11,557 | $11,616 | $11,673 | $11,732 | $11,791 | $11,849 | $11,909 | $11,968 | $12,028 | $12,088 | |
| Other | $0 | $0 | $0 | $0 | $0 | $0 | $0 | $0 | $0 | $0 | $0 | $0 | |
| Subtotal Direct Cost of Sales | $5,750 | $11,500 | $11,557 | $11,616 | $11,673 | $11,732 | $11,791 | $11,849 | $11,909 | $11,968 | $12,028 | $12,088 | |
| Personnel Plan | |||||||||||||
| Month 1 | Month 2 | Month 3 | Month 4 | Month 5 | Month 6 | Month 7 | Month 8 | Month 9 | Month 10 | Month 11 | Month 12 | ||
| Wages | 18% | $10,000 | $10,350 | $10,402 | $10,454 | $10,506 | $10,558 | $10,611 | $10,664 | $10,718 | $10,771 | $10,825 | $10,879 |
| Other | 0% | $0 | $0 | $0 | $0 | $0 | $0 | $0 | $0 | $0 | $0 | $0 | $0 |
| Total People | 14 | 14 | 14 | 14 | 14 | 14 | 14 | 14 | 14 | 14 | 14 | 14 | |
| Total Payroll | $10,000 | $10,350 | $10,402 | $10,454 | $10,506 | $10,558 | $10,611 | $10,664 | $10,718 | $10,771 | $10,825 | $10,879 | |
| Pro Forma Profit and Loss | |||||||||||||
| Month 1 | Month 2 | Month 3 | Month 4 | Month 5 | Month 6 | Month 7 | Month 8 | Month 9 | Month 10 | Month 11 | Month 12 | ||
| Sales | $28,750 | $57,500 | $57,788 | $58,076 | $58,366 | $58,658 | $58,952 | $59,246 | $59,542 | $59,840 | $60,139 | $60,440 | |
| Direct Cost of Sales | $5,750 | $11,500 | $11,557 | $11,616 | $11,673 | $11,732 | $11,791 | $11,849 | $11,909 | $11,968 | $12,028 | $12,088 | |
| Other Costs of Sales | $0 | $0 | $0 | $0 | $0 | $0 | $0 | $0 | $0 | $0 | $0 | $0 | |
| Total Cost of Sales | $5,750 | $11,500 | $11,557 | $11,616 | $11,673 | $11,732 | $11,791 | $11,849 | $11,909 | $11,968 | $12,028 | $12,088 | |
| Gross Margin | $23,000 | $46,000 | $46,231 | $46,460 | $46,693 | $46,926 | $47,161 | $47,397 | $47,633 | $47,872 | $48,111 | $48,352 | |
| Gross Margin % | 80.00% | 80.00% | 80.00% | 80.00% | 80.00% | 80.00% | 80.00% | 80.00% | 80.00% | 80.00% | 80.00% | 80.00% | |
| Expenses | |||||||||||||
| Payroll | $10,000 | $10,350 | $10,402 | $10,454 | $10,506 | $10,558 | $10,611 | $10,664 | $10,718 | $10,771 | $10,825 | $10,879 | |
| Marketing/Promotion | 4% | $0 | $0 | $0 | $0 | $0 | $0 | $0 | $0 | $0 | $0 | $0 | $0 |
| Depreciation | $2,500 | $2,500 | $2,500 | $2,500 | $2,500 | $2,500 | $2,500 | $2,500 | $2,500 | $2,500 | $2,500 | $2,500 | |
| Rent | $4,242 | $4,242 | $4,242 | $4,242 | $4,242 | $4,242 | $4,242 | $4,242 | $4,242 | $4,242 | $4,242 | $4,242 | |
| Royalty fees | 5% | $0 | $0 | $0 | $0 | $0 | $0 | $0 | $0 | $0 | $0 | $0 | $0 |
| Equip rent/repair | $250 | $250 | $250 | $250 | $250 | $250 | $250 | $250 | $250 | $250 | $250 | $250 | |
| Utilities | 11% | $0 | $0 | $0 | $0 | $0 | $0 | $0 | $0 | $0 | $0 | $0 | $0 |
| Admin charges | $250 | $250 | $250 | $250 | $250 | $250 | $250 | $250 | $250 | $250 | $250 | $250 | |
| Total Operating Expenses | $17,242 | $17,592 | $17,644 | $17,696 | $17,748 | $17,800 | $17,853 | $17,906 | $17,960 | $18,013 | $18,067 | $18,121 | |
| Profit Before Interest and Taxes | $5,758 | $28,408 | $28,587 | $28,764 | $28,945 | $29,126 | $29,308 | $29,491 | $29,673 | $29,859 | $30,044 | $30,231 | |
| EBITDA | $8,258 | $30,908 | $31,087 | $31,264 | $31,445 | $31,626 | $31,808 | $31,991 | $32,173 | $32,359 | $32,544 | $32,731 | |
| Interest Expense | $2,013 | $2,001 | $1,989 | $1,977 | $1,966 | $1,954 | $1,942 | $1,930 | $1,918 | $1,905 | $1,893 | $1,881 | |
| Taxes Incurred | $1,124 | $7,922 | $7,979 | $8,036 | $8,094 | $8,152 | $8,210 | $8,268 | $8,327 | $8,386 | $8,445 | $8,505 | |
| Net Profit | $2,622 | $18,485 | $18,619 | $18,751 | $18,886 | $19,020 | $19,156 | $19,293 | $19,429 | $19,567 | $19,706 | $19,845 | |
| Net Profit/Sales | 9.12% | 32.15% | 32.22% | 32.29% | 32.36% | 32.43% | 32.49% | 32.56% | 32.63% | 32.70% | 32.77% | 32.83% | |
| Pro Forma Cash Flow | |||||||||||||
| Month 1 | Month 2 | Month 3 | Month 4 | Month 5 | Month 6 | Month 7 | Month 8 | Month 9 | Month 10 | Month 11 | Month 12 | ||
| Cash Received | |||||||||||||
| Cash from Operations | |||||||||||||
| Cash Sales | $28,750 | $57,500 | $57,788 | $58,076 | $58,366 | $58,658 | $58,952 | $59,246 | $59,542 | $59,840 | $60,139 | $60,440 | |
| Subtotal Cash from Operations | $28,750 | $57,500 | $57,788 | $58,076 | $58,366 | $58,658 | $58,952 | $59,246 | $59,542 | $59,840 | $60,139 | $60,440 | |
| Additional Cash Received | |||||||||||||
| Sales Tax, VAT, HST/GST Received | 0.00% | $0 | $0 | $0 | $0 | $0 | $0 | $0 | $0 | $0 | $0 | $0 | $0 |
| New Current Borrowing | $0 | $0 | $0 | $0 | $0 | $0 | $0 | $0 | $0 | $0 | $0 | $0 | |
| New Other Liabilities (interest-free) | $0 | $0 | $0 | $0 | $0 | $0 | $0 | $0 | $0 | $0 | $0 | $0 | |
| New Long-term Liabilities | $0 | $0 | $0 | $0 | $0 | $0 | $0 | $0 | $0 | $0 | $0 | $0 | |
| Sales of Other Current Assets | $0 | $0 | $0 | $0 | $0 | $0 | $0 | $0 | $0 | $0 | $0 | $0 | |
| Sales of Long-term Assets | $0 | $0 | $0 | $0 | $0 | $0 | $0 | $0 | $0 | $0 | $0 | $0 | |
| New Investment Received | $0 | $0 | $0 | $0 | $0 | $0 | $0 | $0 | $0 | $0 | $0 | $0 | |
| Subtotal Cash Received | $28,750 | $57,500 | $57,788 | $58,076 | $58,366 | $58,658 | $58,952 | $59,246 | $59,542 | $59,840 | $60,139 | $60,440 | |
| Expenditures | Month 1 | Month 2 | Month 3 | Month 4 | Month 5 | Month 6 | Month 7 | Month 8 | Month 9 | Month 10 | Month 11 | Month 12 | |
| Expenditures from Operations | |||||||||||||
| Cash Spending | $10,000 | $10,350 | $10,402 | $10,454 | $10,506 | $10,558 | $10,611 | $10,664 | $10,718 | $10,771 | $10,825 | $10,879 | |
| Bill Payments | $263 | $8,538 | $27,619 | $26,300 | $26,404 | $26,506 | $26,612 | $26,717 | $26,822 | $26,929 | $27,034 | $27,142 | |
| Subtotal Spent on Operations | $10,263 | $18,888 | $38,021 | $36,753 | $36,910 | $37,065 | $37,224 | $37,382 | $37,539 | $37,700 | $37,860 | $38,021 | |
| Additional Cash Spent | |||||||||||||
| Sales Tax, VAT, HST/GST Paid Out | $0 | $0 | $0 | $0 | $0 | $0 | $0 | $0 | $0 | $0 | $0 | $0 | |
| Principal Repayment of Current Borrowing | $0 | $0 | $0 | $0 | $0 | $0 | $0 | $0 | $0 | $0 | $0 | $0 | |
| Other Liabilities Principal Repayment | $0 | $0 | $0 | $0 | $0 | $0 | $0 | $0 | $0 | $0 | $0 | $0 | |
| Long-term Liabilities Principal Repayment | $0 | $1,993 | $2,005 | $2,017 | $2,028 | $2,040 | $2,052 | $2,064 | $2,076 | $2,088 | $2,100 | $2,113 | |
| Purchase Other Current Assets | $0 | $0 | $0 | $0 | $0 | $0 | $0 | $0 | $0 | $0 | $0 | $0 | |
| Purchase Long-term Assets | $0 | $0 | $0 | $0 | $0 | $0 | $0 | $0 | $0 | $0 | $0 | $0 | |
| Dividends | $0 | $0 | $0 | $0 | $0 | $0 | $0 | $0 | $0 | $0 | $0 | $0 | |
| Subtotal Cash Spent | $10,263 | $20,881 | $40,026 | $38,770 | $38,938 | $39,105 | $39,276 | $39,446 | $39,615 | $39,788 | $39,960 | $40,134 | |
| Net Cash Flow | $18,487 | $36,619 | $17,762 | $19,306 | $19,428 | $19,553 | $19,676 | $19,800 | $19,927 | $20,052 | $20,179 | $20,306 | |
| Cash Balance | $105,773 | $142,393 | $160,154 | $179,460 | $198,888 | $218,441 | $238,117 | $257,918 | $277,845 | $297,897 | $318,076 | $338,382 | |
| Pro Forma Balance Sheet | |||||||||||||
| Month 1 | Month 2 | Month 3 | Month 4 | Month 5 | Month 6 | Month 7 | Month 8 | Month 9 | Month 10 | Month 11 | Month 12 | ||
| Assets | Starting Balances | ||||||||||||
| Current Assets | |||||||||||||
| Cash | $87,286 | $105,773 | $142,393 | $160,154 | $179,460 | $198,888 | $218,441 | $238,117 | $257,918 | $277,845 | $297,897 | $318,076 | $338,382 |
| Inventory | $10,000 | $4,250 | $5,750 | $5,779 | $5,808 | $5,837 | $5,866 | $5,896 | $5,925 | $5,955 | $5,984 | $6,014 | $6,044 |
| Other Current Assets | $41,775 | $41,775 | $41,775 | $41,775 | $41,775 | $41,775 | $41,775 | $41,775 | $41,775 | $41,775 | $41,775 | $41,775 | $41,775 |
| Total Current Assets | $139,061 | $151,798 | $189,918 | $207,708 | $227,043 | $246,499 | $266,082 | $285,788 | $305,617 | $325,574 | $345,656 | $365,865 | $386,201 |
| Long-term Assets | |||||||||||||
| Long-term Assets | $99,732 | $99,732 | $99,732 | $99,732 | $99,732 | $99,732 | $99,732 | $99,732 | $99,732 | $99,732 | $99,732 | $99,732 | $99,732 |
| Accumulated Depreciation | $0 | $2,500 | $5,000 | $7,500 | $10,000 | $12,500 | $15,000 | $17,500 | $20,000 | $22,500 | $25,000 | $27,500 | $30,000 |
| Total Long-term Assets | $99,732 | $97,232 | $94,732 | $92,232 | $89,732 | $87,232 | $84,732 | $82,232 | $79,732 | $77,232 | $74,732 | $72,232 | $69,732 |
| Total Assets | $238,793 | $249,030 | $284,650 | $299,940 | $316,775 | $333,731 | $350,814 | $368,020 | $385,349 | $402,806 | $420,388 | $438,097 | $455,933 |
| Liabilities and Capital | Month 1 | Month 2 | Month 3 | Month 4 | Month 5 | Month 6 | Month 7 | Month 8 | Month 9 | Month 10 | Month 11 | Month 12 | |
| Current Liabilities | |||||||||||||
| Accounts Payable | $0 | $7,616 | $26,743 | $25,420 | $25,521 | $25,620 | $25,722 | $25,824 | $25,924 | $26,028 | $26,130 | $26,234 | $26,338 |
| Current Borrowing | $0 | $0 | $0 | $0 | $0 | $0 | $0 | $0 | $0 | $0 | $0 | $0 | $0 |
| Other Current Liabilities | $0 | $0 | $0 | $0 | $0 | $0 | $0 | $0 | $0 | $0 | $0 | $0 | $0 |
| Subtotal Current Liabilities | $0 | $7,616 | $26,743 | $25,420 | $25,521 | $25,620 | $25,722 | $25,824 | $25,924 | $26,028 | $26,130 | $26,234 | $26,338 |
| Long-term Liabilities | $345,000 | $345,000 | $343,007 | $341,002 | $338,985 | $336,957 | $334,917 | $332,865 | $330,801 | $328,725 | $326,637 | $324,537 | $322,424 |
| Total Liabilities | $345,000 | $352,616 | $369,750 | $366,422 | $364,506 | $362,577 | $360,639 | $358,689 | $356,725 | $354,753 | $352,767 | $350,771 | $348,762 |
| Paid-in Capital | $160,000 | $160,000 | $160,000 | $160,000 | $160,000 | $160,000 | $160,000 | $160,000 | $160,000 | $160,000 | $160,000 | $160,000 | $160,000 |
| Retained Earnings | ($266,207) | ($266,207) | ($266,207) | ($266,207) | ($266,207) | ($266,207) | ($266,207) | ($266,207) | ($266,207) | ($266,207) | ($266,207) | ($266,207) | ($266,207) |
| Earnings | $0 | $2,622 | $21,107 | $39,725 | $58,476 | $77,362 | $96,382 | $115,538 | $134,831 | $154,260 | $173,828 | $193,533 | $213,378 |
| Total Capital | ($106,207) | ($103,585) | ($85,100) | ($66,482) | ($47,731) | ($28,845) | ($9,825) | $9,331 | $28,624 | $48,053 | $67,621 | $87,326 | $107,171 |
| Total Liabilities and Capital | $238,793 | $249,030 | $284,650 | $299,940 | $316,775 | $333,731 | $350,814 | $368,020 | $385,349 | $402,806 | $420,388 | $438,097 | $455,933 |
| Net Worth | ($106,207) | ($103,585) | ($85,100) | ($66,482) | ($47,731) | ($28,845) | ($9,825) | $9,331 | $28,624 | $48,053 | $67,621 | $87,326 | $107,171 |
| General Assumptions | |||||||||||||
| Month 1 | Month 2 | Month 3 | Month 4 | Month 5 | Month 6 | Month 7 | Month 8 | Month 9 | Month 10 | Month 11 | Month 12 | ||
| Plan Month | 1 | 2 | 3 | 4 | 5 | 6 | 7 | 8 | 9 | 10 | 11 | 12 | |
| Current Interest Rate | 0.00% | 0.00% | 0.00% | 0.00% | 0.00% | 0.00% | 0.00% | 0.00% | 0.00% | 0.00% | 0.00% | 0.00% | |
| Long-term Interest Rate | 7.00% | 7.00% | 7.00% | 7.00% | 7.00% | 7.00% | 7.00% | 7.00% | 7.00% | 7.00% | 7.00% | 7.00% | |
| Tax Rate | Tax Rate | 30.00% | 30.00% | 30.00% | 30.00% | 30.00% | 30.00% | 30.00% | 30.00% | 30.00% | 30.00% | 30.00% | 30.00% |
| Other | 0 | 0 | 0 | 0 | 0 | 0 | 0 | 0 | 0 | 0 | 0 | 0 | |


