
Pizzeria del Causamali
Executive Summary
Pizzeria del Causamali is a new player in the restaurant industry. The restaurant is in a comfortable, familiar, small town that has a strong need for additional dining options. Bolstered by the need for more choices in family-oriented dining experiences, combined with the option for home-delivery, the restaurant is positioned to take advantage of the market need and serve the families in the Deauville area.
The Deauville’s population is rapidly growing with new subdivisions and young families moving to the rural suburb of the Hewgton area. It is Pizzeria del Causamali’s strategy to exploit the first-mover opportunity and establish itself as the preferred pizza provider to the area. We believe a locally-owned restaurant is the best option to serve the rapidly growing population with a fresh, unique menu as opposed to a national chain franchise.
This business plan calls for an exciting, profitable start-up year ahead with future forecasted growth as we meet the demands of the community. In all, this plan describes a healthy company with good growth prospects, looking to manage its orderly growth in the near future.

1.1 Mission
Pizzeria del Causamali creates a friendly and pleasant atmosphere for customers in a well-designed, and productive environment in which people can work happily. We are sensitive to the look and taste of good pizza as well as to high-quality ingredients. We look to provide the best possible value to our customers who desire great tasting pizza and to provide customers with the satisfaction of receiving a great value, both tangibly and intangibly. Additionally, we are the first home-deliverer of pizzas in our area.
Our customers are our neighbors as we are residents of our market area. We will also create and nurture a healthy, creative, respectful, and fun working environment, in which our employees are fairly compensated and encouraged to respect the customer and the quality of the product we produce. We seek fair and responsible profit, enough to keep the company financially healthy for the long term and to fairly compensate owners and investors for their investment and risk.
1.2 Keys to Success
The keys to success in this business are:
- Delivering the customer value proposition.
- Marketing: promoting a new company, product, and delivery channels to a rural community.
- Product quality and consistency.
- Pricing effectively with respect to the project quality and customer value proposition.
- Family-oriented atmosphere with occasional nights of family entertainment.
- Management: products delivered on time, costs controlled, marketing budgets managed. There is a temptation to fixate on growth at the expense of profits.
- Reporting and controls in place for inventory and financials.
1.3 Objectives
The objectives for Pizzeria del Causamali are:
- To establish the market presence needed to support marketing and sales goals and to attract customers.
- To reach healthy monthly sales by the end of the year, and average monthly sales increasing modestly by steadily through Year 3.
- To achieve double digit profit margins.
- To develop top-rated relationships with 2-4 well-respected, all encompassing distributors.
Company Summary
Pizzeria del Causamali is a privately-owned pizza restaurant offering a product menu that does not currently exist in the area and first to offer home delivery. Our customers are many of the young families and students in the area.
2.1 Company Ownership
Pizzeria del Causamali will be established as a limited liability company (LLC) with Marion E. and Marianne K. Bruxellesprot as the sole owners.
2.2 Start-up Summary
Our start-up costs cover the renovation of the occupied store space, professional fees, and expenses associated with opening our first location. The start-up costs are to be financed by direct owner investment, financial institutions, and private investors. The assumptions are shown in the following table and illustration.

| Start-up | |
| Requirements | |
| Start-up Expenses | |
| Professional Fees (Legal, Accounting, Consulting) | $1,800 |
| Placemats, Stationery, Business Cards | $1,100 |
| Renovation | $8,300 |
| Marketing | $2,500 |
| Rent | $2,000 |
| Expensed Equipment | $5,000 |
| Insurance | $350 |
| Website Development | $1,000 |
| Misc Expense | $3,800 |
| Total Start-up Expenses | $25,850 |
| Start-up Assets | |
| Cash Required | $23,100 |
| Start-up Inventory | $6,000 |
| Other Current Assets | $5,250 |
| Long-term Assets | $20,300 |
| Total Assets | $54,650 |
| Total Requirements | $80,500 |
| Start-up Funding | |
| Start-up Expenses to Fund | $25,850 |
| Start-up Assets to Fund | $54,650 |
| Total Funding Required | $80,500 |
| Assets | |
| Non-cash Assets from Start-up | $31,550 |
| Cash Requirements from Start-up | $23,100 |
| Additional Cash Raised | $0 |
| Cash Balance on Starting Date | $23,100 |
| Total Assets | $54,650 |
| Liabilities and Capital | |
| Liabilities | |
| Current Borrowing | $0 |
| Long-term Liabilities | $25,000 |
| Accounts Payable (Outstanding Bills) | $9,500 |
| Other Current Liabilities (interest-free) | $0 |
| Total Liabilities | $34,500 |
| Capital | |
| Planned Investment | |
| Investor 1 | $15,000 |
| Owners | $30,000 |
| Additional Investment Requirement | $1,000 |
| Total Planned Investment | $46,000 |
| Loss at Start-up (Start-up Expenses) | ($25,850) |
| Total Capital | $20,150 |
| Total Capital and Liabilities | $54,650 |
| Total Funding | $80,500 |
Services
Pizzeria del Causamali offers high quality pizza to a growing community that currently has limited availability of restaurants and no availability to delivery. At start up we will be open for dinner 4 p.m. to 10 p.m. Sunday – Thursday and 3 p.m. to 11 p.m. Friday and Saturday. We will consider opening earlier and serving lunch if there is a demand, and if forecast and financial analysis can justify the increased costs.
Our menu will include 4 sizes of pizzas with various combinations of toppings. Predefined, high-margin pizzas will be highlighted on the menu. Additionally, breadsticks, beer, and soda will be included in the initial menu offerings.
Market Analysis Summary
Our primary target market is people who desire a comfortable, family-oriented environment for dine-in pizza. Our secondary target market also desires a delivery service for pizza, or a take-out approach. There is overlap of these segments.
Deauville and its surrounding communities are a growing middle-class area with nearly 14,000 residents. A majority of these residents are families of four or more. The boom in the area is primarily in response to an exodus of families moving out of the over-populated areas and into a more rural setting.
According to a Growth Plan Deauville conducted in 2001, population within Deauville is expected to increase. However, the number of persons per household is expected to decline, meaning the need for additional housing in Deauville will continue to grow. From the same plan, population is listed as being evenly distributed by age groupings, with approximately 33% of the population being minors. Another 40% are less than 54 years of age, indicating a major concentration of the Deauville population being families. The report forecasts there being nearly 1,900 households in the Deauville by 2005. This is driving the need for more quality, family-oriented restaurants.
Additionally, Deauville residents frequently visit the building in which Pizzeria del Causamali is located. Tanning and video rental businesses are adjacent to the restaurant, so we are providing a new convenience for families to select a movie and pick up a pizza.
With the expected continued growth in the area, estimated at 7% annually, opportunities to serve Deauville and its surrounding communities will increase. The company will sell predominantly to individuals, but it will also accept some catering jobs to individual parties, schools, and company functions in the Deauville area.
4.1 Market Segmentation
Those residents of neighboring communities of Deauville, including Doughbuoy, d’Ohtown, and Doe Valley are included in the Market Segmentation. Only those residents of Deauville are included in the delivery, as delivery radius is limited to a 5-mile radius in the city of Deauville. An estimated 53% of Deauville residents live within the Sanitary District, or within this 5-mile radius.

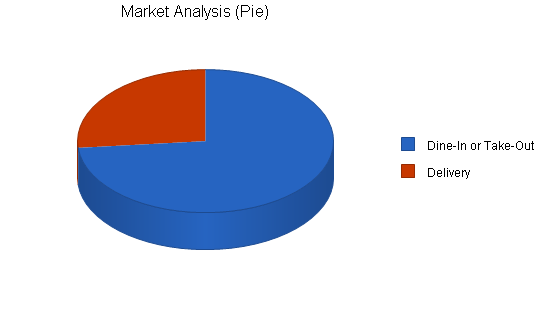
| Market Analysis | |||||||
| Year 1 | Year 2 | Year 3 | Year 4 | Year 5 | |||
| Potential Customers | Growth | CAGR | |||||
| Dine-In or Take-Out | 7% | 13,860 | 14,830 | 15,868 | 16,979 | 18,168 | 7.00% |
| Delivery | 7% | 5,000 | 5,350 | 5,725 | 6,126 | 6,555 | 7.00% |
| Total | 7.00% | 18,860 | 20,180 | 21,593 | 23,105 | 24,723 | 7.00% |
4.2 Target Market Segment Strategy
Including Deauville and its surrounding areas, no pizza establishments exist. In Deauville one to two restaurants serve pizza, but not as a primary menu item. These pizza outlets are in taverns which are not conducive to family-type atmosphere. No eating establishments in the Deauville area provide home-delivery service.
4.3 Service Business Analysis
Other family-oriented restaurants in the area include: Subway(R), What’s Cookin’ diner, and Colonial House supper club. Subway serves sandwiches, wraps, and salads, none of which are direct competition to the pizza establishment. The diner is open until 2 p.m. each day and focuses on the breakfast crowd, with a limited sandwich availability for lunch. The supper club has a Chicken and Pizza buffet once a week for approximately $6; the pizza served as part of the buffet are frozen pizzas.
Other restaurants in Deauville are taverns and are not conducive to family activities. One of the bars in Deauville serves a homemade pizza.
In conversations with an independent pizza operator in Lakeshore Haven, an hour’s drive away, he indicated pizza sales in his community are thriving despite competition from 4 other pizza establishments, including Pizza Hut(R). While exact figures were not shared, he indicated a high level of penetration into the pizza market in his area with profitable margins. He also provided suggestions and tips to minimize costs, and components of his restaurant he would do differently, including payroll handling, vendors, and layout.
4.3.1 Competition and Buying Patterns
There is minimal competition for pizza in the Deauville area, besides the bar establishments previously mentioned. The closest locales for pizza to the Deauville area are Bolingbrooke, Avro, and de Havilland. None of these competing pizza locations deliver to the Deauville area. Additionally, Pizzeria del Causamali would be the only family-oriented, non-smoking restaurant in Deauville.
Strategy and Implementation Summary
Our strategy is based on delivering a strong customer value proposition in a niche market. The world is full of small, family-oriented towns that do not have endless opportunities for dining out. We are looking to offer the Deauville and its surrounding areas a new choice in food options.
Also:
- What begins as a need to satisfy a need in the community, can eventually turn into a mainstay in the small town community.
- We are building our marketing infrastructure so that we can eventually reach additional towns with the same offering.
- We focus on satisfying the needs of small towns.
5.1 Competitive Edge
Our competitive edge is to be first-to-the-market with pizza in a friendly, non-smoking, family-oriented dine-in experience, and first-to-the-area with food delivery.
Additionally, the location of Pizzeria del Causamali is crucial as a convenience model to customers. Deauville residents frequent the video rental store adjacent to the restaurant. This location is directly in the center of activity in this rural community–it is within walking distance of the middle and high schools, the local church, and within 2 miles of the existing large subdivisions and apartment complexes in the area.
5.2 Marketing Strategy
To drive customers to Pizzeria del Causamali, we will employ several techniques outlined below.
Advertising in Bolingbrooke Post, de Havilland Buyer’s Guide, Deauville Register, and Deauville Shopping News will be used to promote the Grand Opening of Pizzeria del Causamali. As part of the advertising, a coupon will be available to customers. Intermittent newspaper advertisements will continue throughout the year to promote upcoming events. Most initiatives will focus on the local Deauville papers as the target of these papers is specifically the Deauville residents. Additional marketing efforts will come in the form of on-box coupons for future purchases.
Additionally, family-oriented events will be hosted by Pizzeria del Causamali to attract customers such as trivia nights, birthday parties, and prize giveaways. Frequent buyer cards will be employed to entice repeat customers. Pizzeria del Causamali will also sponsor a local Little League baseball team, and a bowling team to publicize the restaurant within the community events.
Future plans of working in coordination with the adjacent video store to offer “bundle savings” if both pizza and video rentals are purchased will be pursued within the second year of operation.
5.3 Sales Strategy
The Deauville area has expressed its need for additional restaurants, specifically a desire for pizza. Because of this, there is pent-up demand for pizza in this area. We will expect a high rate of sales growth within the first 3 months as this customer desire is met.
For the next year, we continue to focus on a growing presence in the community and advertising heavily throughout the community. As a major convention center and water park open in nearby Fairchild, we will focus our attention on becoming the recognized provider of pizza to that establishment.
5.3.1 Sales Forecast
Our sales forecast assumes a modest change in annual costs to accommodate new entry into the market.
We are expecting to increase sales modestly but steadily over the next year, which is a respectable growth rate. The growth forecast is assumed given this is a new product for the area using new channels of availability. We are not projecting significant change in the product line, or in the proportion between different lines.
Based on industry averages and the absence of competition for pizza in the Deauville area, we are predicting an average of 25 pizzas sold each week night (Sunday – Wednesday). On the weekends (Thursday – Saturday), we are estimating 40 pizzas are sold each day. Of those pizzas ordered, we are expecting approximately 1/3 to be dine-in customers. Those customers dining in will most likely order drinks and/or beer (on average 4 for each family). Additionally, we are estimating that approximately one-third of the pizza orders will be accompanied by an order for breadsticks. Our estimated average prices for each item are as follows:
- Pizza: $12
- Breadsticks: $2.50
- Beer: $2.50/pint
- Drinks: $1.70 refillable


| Sales Forecast | |||
| Year 1 | Year 2 | Year 3 | |
| Sales | |||
| Pizza | $133,900 | $143,808 | $153,875 |
| Breadsticks | $18,667 | $19,973 | $21,371 |
| Beer | $37,333 | $39,947 | $42,743 |
| Drinks | $50,773 | $54,327 | $58,130 |
| Total Sales | $240,673 | $258,055 | $276,120 |
| Direct Cost of Sales | Year 1 | Year 2 | Year 3 |
| Pizza | $42,848 | $44,990 | $47,240 |
| Breadsticks | $3,733 | $3,920 | $4,116 |
| Beer | $7,467 | $7,840 | $8,232 |
| Drinks | $2,539 | $2,666 | $2,799 |
| Subtotal Direct Cost of Sales | $56,587 | $59,416 | $62,387 |
5.4 Milestones
The following table lists important program milestones, with dates and managers in charge, and budgets for each. The milestone schedule indicates our emphasis on planning for implementation.

| Milestones | |||||
| Milestone | Start Date | End Date | Budget | Manager | Department |
| Business Plan | 1/8/2004 | 1/31/2004 | $0 | Marianne Bruxellesprot | Management |
| Secure Start-up Funding | 2/1/2004 | 3/1/2004 | $0 | Marianne Bruxellesprot | Management |
| Site Selection | 1/8/2004 | 2/1/2004 | $0 | Marion Bruxellesprot | Operations |
| Architect Designs/Redesign | 2/15/2004 | 3/1/2004 | $500 | Marion Bruxellesprot | Operations |
| Technology Design | 3/15/2004 | 4/1/2004 | $5,000 | Marianne Bruxellesprot | Technical |
| Personnel Plan | 3/1/2004 | 3/15/2004 | $0 | Marianne Bruxellesprot | Management |
| Accounting Plan | 3/1/2004 | 3/31/2004 | $400 | Marianne Bruxellesprot | Management |
| Renovation | 4/1/2004 | 5/15/2004 | $7,800 | Marion Bruxellesprot | Operations |
| Equipment Installation | 5/1/2004 | 5/15/2004 | $2,000 | Marion Bruxellesprot | Operations |
| Marketing Plans | 3/4/2004 | 4/30/2004 | $2,500 | Marianne Bruxellesprot | Marketing |
| Grand Opening | 5/1/2004 | 5/15/2004 | $2,500 | Marianne Bruxellesprot | Marketing |
| Totals | $20,700 | ||||
Web Plan Summary
The Pizzeria del Causamali website will be the virtual business card and portfolio for the company, as well as its online “home.” It will showcase the history, product information, and offers for Pizzeria del Causamali. Special online-only offers will be made available on the website, along with customer’s opportunity to sign-up for email news and offers.
The Pizzeria del Causamali website needs to be a simple yet classy and well designed website that, at the same time, is in keeping with the latest trends in user interface design. Customers will be coming to the site for product information, history, and offers.
Future elements of the site can contain online ordering, if customers express an interest in this functionality.
6.1 Website Marketing Strategy
Our Internet marketing activities will be focused on product information and offers. Future opportunities exist in offering online ordering.
6.2 Development Requirements
The Pizzeria del Causamali website will be initially developed with few technical resources. A simple hosting provider, Yahoo! Web services, will host the site and provide the technical back end. The owner’s expertise in professional Web development will lead this effort.
The user interface designer will work with a graphic artist to come up with the website logo, and the website graphics.
The maintenance of the site will be done by the owners. If the website rolls out future development such as newsletters and online ordering, the internal staff at Pizzeria del Causamali will design, implement, and execute the technology.
Management Summary
We are a small company owned and operated by Marion and Marianne Bruxellesprot, husband and wife, as a partnership. Management style reflects the participation of the owners. The company respects its community of co-workers and treats all workers well.
Marianne Bruxellesprot is a 1998 graduate of University School of Business with High Honors and Distinction in Business. Her experience with general business, technology, and operations is a great asset to this venture.
Additionally, Otho Colderobby is an advisor to the owners. Otho is a 1991 graduate of State College with a degree in Economics. Furthermore, Otho graduated in 1995 with a Masters in Business Administration from University School of Business with emphases in Marketing and Finance. Otho held a senior finance management position with Frito Lay for 5 years. Otho is currently a managing consultant with a marketing strategy firm. He also spent 5 years in a strategic services consulting practice.
7.1 Personnel Plan
The personnel table assumes a level need of employees, and 5% per annum pay raises. Staffing for a 7-day a week restaurant necessitates two shifts. In addition to the hours open for serving we anticipate an additional hour before opening for prep and as much as an hour after closing for cleanup. This is approximately 8 hours of staffing necessary Sunday – Thursday and 10 hours on both Friday and Saturday.
The two kitchen lead positions are part-time, earning $9/hr. The kitchen leads will serve as the shift leaders of the kitchen/wait staff. Kitchen staff will serve as the wait staff. There will be one dedicated dishwashing position per shift. Wages for kitchen/wait staff, dishwashers, and delivery drivers, who are all part-time, are $6/hr, with opportunities for all to share the combined earn tips. It is imperative the people serving as the kitchen lead are over 21 and can legally serve alcohol.
Hourly part-time positions as kitchen/wait, dishwashing, and delivery staff average out to be approximately 30 hours per week each. Delivery staff will work 5 hour shifts each night, with an extra delivery staff member added on Thursdays, Fridays, and Saturdays. During the week if this person is not delivering, they will work in the kitchen as needed, directed by the kitchen lead.
| Personnel Plan | |||
| Year 1 | Year 2 | Year 3 | |
| Kitchen Leads | $28,080 | $29,484 | $30,958 |
| Kitchen/Wait | $37,440 | $39,312 | $41,278 |
| Dishwasher | $15,600 | $16,380 | $17,199 |
| Owner | $9,000 | $9,450 | $9,923 |
| Delivery | $15,600 | $16,380 | $17,199 |
| Total People | 12 | 12 | 12 |
| Total Payroll | $105,720 | $111,006 | $116,556 |
Financial Plan
The financial picture is quite encouraging. We will be slow to take on debt and heavily investing our own assets, but with our increase in sales we do expect to apply for a credit line with the bank, to a limit of $50,000. The credit line is supported by assets.
8.1 Important Assumptions
The financial plan depends on important assumptions, most of which are shown in the following table. The key underlying assumptions are:
- We assume a fairly high-growth economy for pizza in the Deauville area, given the lack of competition and interest in having a pizza restaurant available in the area and pent-up demand.
- We assume, of course, that there are no unforeseen changes in technology to make our products immediately obsolete.
- We assume access to equity capital and financing sufficient to maintain our financial plan as shown in the tables.
| General Assumptions | |||
| Year 1 | Year 2 | Year 3 | |
| Plan Month | 1 | 2 | 3 |
| Current Interest Rate | 6.00% | 6.00% | 6.00% |
| Long-term Interest Rate | 5.00% | 5.00% | 5.00% |
| Tax Rate | 30.00% | 30.00% | 30.00% |
| Other | 0 | 0 | 0 |
8.2 Break-even Analysis
Our break-even analysis is based on running costs, the “burn-rate” costs we incur to keep the business running, not on theoretical fixed costs that would be relevant only if we were closing. The essential insight here is that our sales level seems to be running comfortably above break-even.

| Break-even Analysis | |
| Monthly Revenue Break-even | $16,283 |
| Assumptions: | |
| Average Percent Variable Cost | 24% |
| Estimated Monthly Fixed Cost | $12,454 |
8.3 Projected Profit and Loss
We expect to be profitable in the first year, with profits increasing over the next two years, as we establish a loyal customer base.


| Pro Forma Profit and Loss | |||
| Year 1 | Year 2 | Year 3 | |
| Sales | $240,673 | $258,055 | $276,120 |
| Direct Cost of Sales | $56,587 | $59,416 | $62,387 |
| Other Costs of Goods | $0 | $0 | $0 |
| Total Cost of Sales | $56,587 | $59,416 | $62,387 |
| Gross Margin | $184,087 | $198,639 | $213,733 |
| Gross Margin % | 76.49% | 76.98% | 77.41% |
| Expenses | |||
| Payroll | $105,720 | $111,006 | $116,556 |
| Sales and Marketing and Other Expenses | $7,250 | $7,250 | $7,500 |
| Depreciation | $2,040 | $1,836 | $1,652 |
| Rent | $14,400 | $14,400 | $14,400 |
| Utilities | $7,200 | $7,200 | $7,200 |
| Insurance | $4,200 | $4,500 | $4,800 |
| Payroll Taxes | $8,042 | $8,444 | $8,866 |
| Website Hosting and Maintenance | $600 | $50 | $50 |
| Other | $0 | $0 | $0 |
| Total Operating Expenses | $149,452 | $154,686 | $161,024 |
| Profit Before Interest and Taxes | $34,635 | $43,954 | $52,709 |
| EBITDA | $36,675 | $45,790 | $54,361 |
| Interest Expense | $1,088 | $700 | $225 |
| Taxes Incurred | $10,064 | $12,976 | $15,745 |
| Net Profit | $23,483 | $30,278 | $36,739 |
| Net Profit/Sales | 9.76% | 11.73% | 13.31% |
8.4 Projected Cash Flow
The following table and chart is the projected cash flow for three years.

| Pro Forma Cash Flow | |||
| Year 1 | Year 2 | Year 3 | |
| Cash Received | |||
| Cash from Operations | |||
| Cash Sales | $240,673 | $258,055 | $276,120 |
| Subtotal Cash from Operations | $240,673 | $258,055 | $276,120 |
| Additional Cash Received | |||
| Sales Tax, VAT, HST/GST Received | $0 | $0 | $0 |
| New Current Borrowing | $0 | $0 | $0 |
| New Other Liabilities (interest-free) | $0 | $0 | $0 |
| New Long-term Liabilities | $0 | $0 | $0 |
| Sales of Other Current Assets | $0 | $0 | $0 |
| Sales of Long-term Assets | $0 | $0 | $0 |
| New Investment Received | $0 | $0 | $0 |
| Subtotal Cash Received | $240,673 | $258,055 | $276,120 |
| Expenditures | Year 1 | Year 2 | Year 3 |
| Expenditures from Operations | |||
| Cash Spending | $105,720 | $111,006 | $116,556 |
| Bill Payments | $105,383 | $114,835 | $120,750 |
| Subtotal Spent on Operations | $211,103 | $225,841 | $237,306 |
| Additional Cash Spent | |||
| Sales Tax, VAT, HST/GST Paid Out | $0 | $0 | $0 |
| Principal Repayment of Current Borrowing | $0 | $0 | $0 |
| Other Liabilities Principal Repayment | $0 | $0 | $0 |
| Long-term Liabilities Principal Repayment | $6,000 | $10,000 | $9,000 |
| Purchase Other Current Assets | $0 | $0 | $0 |
| Purchase Long-term Assets | $0 | $0 | $0 |
| Dividends | $0 | $0 | $0 |
| Subtotal Cash Spent | $217,103 | $235,841 | $246,306 |
| Net Cash Flow | $23,570 | $22,214 | $29,813 |
| Cash Balance | $46,670 | $68,884 | $98,698 |
8.5 Projected Balance Sheet
As shown in the balance sheet in the following table, we expect a healthy growth in net worth. The monthly projections are in the appendices.
| Pro Forma Balance Sheet | |||
| Year 1 | Year 2 | Year 3 | |
| Assets | |||
| Current Assets | |||
| Cash | $46,670 | $68,884 | $98,698 |
| Inventory | $1,720 | $1,806 | $1,896 |
| Other Current Assets | $5,250 | $5,250 | $5,250 |
| Total Current Assets | $53,640 | $75,940 | $105,844 |
| Long-term Assets | |||
| Long-term Assets | $20,300 | $20,300 | $20,300 |
| Accumulated Depreciation | $2,040 | $3,876 | $5,528 |
| Total Long-term Assets | $18,260 | $16,424 | $14,772 |
| Total Assets | $71,900 | $92,364 | $120,616 |
| Liabilities and Capital | Year 1 | Year 2 | Year 3 |
| Current Liabilities | |||
| Accounts Payable | $9,267 | $9,454 | $9,967 |
| Current Borrowing | $0 | $0 | $0 |
| Other Current Liabilities | $0 | $0 | $0 |
| Subtotal Current Liabilities | $9,267 | $9,454 | $9,967 |
| Long-term Liabilities | $19,000 | $9,000 | $0 |
| Total Liabilities | $28,267 | $18,454 | $9,967 |
| Paid-in Capital | $46,000 | $46,000 | $46,000 |
| Retained Earnings | ($25,850) | ($2,367) | $27,911 |
| Earnings | $23,483 | $30,278 | $36,739 |
| Total Capital | $43,633 | $73,911 | $110,649 |
| Total Liabilities and Capital | $71,900 | $92,364 | $120,616 |
| Net Worth | $43,633 | $73,911 | $110,649 |
8.6 Business Ratios
Standard business ratios are included in the following table. Industry profile ratios are shown for comparison, and are based on Standard Industrial Classification (SIC) code 5812.0600, Pizza Restaurants. The ratios show a plan for balanced, healthy growth. Our return on sales and return on assets remain strong in percentage terms.
| Ratio Analysis | ||||
| Year 1 | Year 2 | Year 3 | Industry Profile | |
| Sales Growth | 0.00% | 7.22% | 7.00% | 5.24% |
| Percent of Total Assets | ||||
| Inventory | 2.39% | 1.96% | 1.57% | 3.54% |
| Other Current Assets | 7.30% | 5.68% | 4.35% | 34.82% |
| Total Current Assets | 74.60% | 82.22% | 87.75% | 43.85% |
| Long-term Assets | 25.40% | 17.78% | 12.25% | 56.15% |
| Total Assets | 100.00% | 100.00% | 100.00% | 100.00% |
| Current Liabilities | 12.89% | 10.24% | 8.26% | 20.80% |
| Long-term Liabilities | 26.43% | 9.74% | 0.00% | 28.42% |
| Total Liabilities | 39.31% | 19.98% | 8.26% | 49.22% |
| Net Worth | 60.69% | 80.02% | 91.74% | 50.78% |
| Percent of Sales | ||||
| Sales | 100.00% | 100.00% | 100.00% | 100.00% |
| Gross Margin | 76.49% | 76.98% | 77.41% | 61.18% |
| Selling, General & Administrative Expenses | 39.83% | 39.27% | 38.77% | 38.56% |
| Advertising Expenses | 0.00% | 0.00% | 0.00% | 2.28% |
| Profit Before Interest and Taxes | 14.39% | 17.03% | 19.09% | 1.44% |
| Main Ratios | ||||
| Current | 5.79 | 8.03 | 10.62 | 0.99 |
| Quick | 5.60 | 7.84 | 10.43 | 0.67 |
| Total Debt to Total Assets | 39.31% | 19.98% | 8.26% | 52.80% |
| Pre-tax Return on Net Worth | 76.88% | 58.52% | 47.43% | 2.77% |
| Pre-tax Return on Assets | 46.66% | 46.83% | 43.51% | 5.88% |
| Additional Ratios | Year 1 | Year 2 | Year 3 | |
| Net Profit Margin | 9.76% | 11.73% | 13.31% | n.a |
| Return on Equity | 53.82% | 40.97% | 33.20% | n.a |
| Activity Ratios | ||||
| Inventory Turnover | 31.29 | 33.70 | 33.70 | n.a |
| Accounts Payable Turnover | 11.35 | 12.17 | 12.17 | n.a |
| Payment Days | 30 | 30 | 29 | n.a |
| Total Asset Turnover | 3.35 | 2.79 | 2.29 | n.a |
| Debt Ratios | ||||
| Debt to Net Worth | 0.65 | 0.25 | 0.09 | n.a |
| Current Liab. to Liab. | 0.33 | 0.51 | 1.00 | n.a |
| Liquidity Ratios | ||||
| Net Working Capital | $44,373 | $66,487 | $95,877 | n.a |
| Interest Coverage | 31.85 | 62.79 | 234.26 | n.a |
| Additional Ratios | ||||
| Assets to Sales | 0.30 | 0.36 | 0.44 | n.a |
| Current Debt/Total Assets | 13% | 10% | 8% | n.a |
| Acid Test | 5.60 | 7.84 | 10.43 | n.a |
| Sales/Net Worth | 5.52 | 3.49 | 2.50 | n.a |
| Dividend Payout | 0.00 | 0.00 | 0.00 | n.a |
Appendix
| Sales Forecast | |||||||||||||
| Month 1 | Month 2 | Month 3 | Month 4 | Month 5 | Month 6 | Month 7 | Month 8 | Month 9 | Month 10 | Month 11 | Month 12 | ||
| Sales | |||||||||||||
| Pizza | 0% | $7,200 | $12,600 | $11,160 | $12,000 | $11,460 | $11,340 | $11,820 | $11,160 | $11,320 | $11,640 | $10,560 | $11,640 |
| Breadsticks | 0% | $1,000 | $1,750 | $1,550 | $1,667 | $1,592 | $1,575 | $1,642 | $1,550 | $1,642 | $1,617 | $1,467 | $1,617 |
| Beer | 0% | $2,000 | $3,500 | $3,100 | $3,333 | $3,183 | $3,150 | $3,283 | $3,100 | $3,283 | $3,233 | $2,933 | $3,233 |
| Drinks | 0% | $2,720 | $4,760 | $4,216 | $4,533 | $4,329 | $4,284 | $4,465 | $4,216 | $4,465 | $4,397 | $3,989 | $4,397 |
| Total Sales | $12,920 | $22,610 | $20,026 | $21,533 | $20,564 | $20,349 | $21,210 | $20,026 | $20,710 | $20,887 | $18,949 | $20,887 | |
| Direct Cost of Sales | Month 1 | Month 2 | Month 3 | Month 4 | Month 5 | Month 6 | Month 7 | Month 8 | Month 9 | Month 10 | Month 11 | Month 12 | |
| Pizza | 32% | $2,304 | $4,032 | $3,571 | $3,840 | $3,667 | $3,629 | $3,782 | $3,571 | $3,622 | $3,725 | $3,379 | $3,725 |
| Breadsticks | 20% | $200 | $350 | $310 | $333 | $318 | $315 | $328 | $310 | $328 | $323 | $293 | $323 |
| Beer | 20% | $400 | $700 | $620 | $667 | $637 | $630 | $657 | $620 | $657 | $647 | $587 | $647 |
| Drinks | 5% | $136 | $238 | $211 | $227 | $216 | $214 | $223 | $211 | $223 | $220 | $199 | $220 |
| Subtotal Direct Cost of Sales | $3,040 | $5,320 | $4,712 | $5,067 | $4,839 | $4,788 | $4,991 | $4,712 | $4,831 | $4,915 | $4,459 | $4,915 | |
| Personnel Plan | |||||||||||||
| Month 1 | Month 2 | Month 3 | Month 4 | Month 5 | Month 6 | Month 7 | Month 8 | Month 9 | Month 10 | Month 11 | Month 12 | ||
| Kitchen Leads | 0% | $2,340 | $2,340 | $2,340 | $2,340 | $2,340 | $2,340 | $2,340 | $2,340 | $2,340 | $2,340 | $2,340 | $2,340 |
| Kitchen/Wait | 0% | $3,120 | $3,120 | $3,120 | $3,120 | $3,120 | $3,120 | $3,120 | $3,120 | $3,120 | $3,120 | $3,120 | $3,120 |
| Dishwasher | 0% | $1,300 | $1,300 | $1,300 | $1,300 | $1,300 | $1,300 | $1,300 | $1,300 | $1,300 | $1,300 | $1,300 | $1,300 |
| Owner | 0% | $750 | $750 | $750 | $750 | $750 | $750 | $750 | $750 | $750 | $750 | $750 | $750 |
| Delivery | 0% | $1,300 | $1,300 | $1,300 | $1,300 | $1,300 | $1,300 | $1,300 | $1,300 | $1,300 | $1,300 | $1,300 | $1,300 |
| Total People | 12 | 12 | 12 | 12 | 12 | 12 | 12 | 12 | 12 | 12 | 12 | 12 | |
| Total Payroll | $8,810 | $8,810 | $8,810 | $8,810 | $8,810 | $8,810 | $8,810 | $8,810 | $8,810 | $8,810 | $8,810 | $8,810 | |
| General Assumptions | |||||||||||||
| Month 1 | Month 2 | Month 3 | Month 4 | Month 5 | Month 6 | Month 7 | Month 8 | Month 9 | Month 10 | Month 11 | Month 12 | ||
| Plan Month | 1 | 2 | 3 | 4 | 5 | 6 | 7 | 8 | 9 | 10 | 11 | 12 | |
| Current Interest Rate | 6.00% | 6.00% | 6.00% | 6.00% | 6.00% | 6.00% | 6.00% | 6.00% | 6.00% | 6.00% | 6.00% | 6.00% | |
| Long-term Interest Rate | 5.00% | 5.00% | 5.00% | 5.00% | 5.00% | 5.00% | 5.00% | 5.00% | 5.00% | 5.00% | 5.00% | 5.00% | |
| Tax Rate | 30.00% | 30.00% | 30.00% | 30.00% | 30.00% | 30.00% | 30.00% | 30.00% | 30.00% | 30.00% | 30.00% | 30.00% | |
| Other | 0 | 0 | 0 | 0 | 0 | 0 | 0 | 0 | 0 | 0 | 0 | 0 | |
| Pro Forma Profit and Loss | |||||||||||||
| Month 1 | Month 2 | Month 3 | Month 4 | Month 5 | Month 6 | Month 7 | Month 8 | Month 9 | Month 10 | Month 11 | Month 12 | ||
| Sales | $12,920 | $22,610 | $20,026 | $21,533 | $20,564 | $20,349 | $21,210 | $20,026 | $20,710 | $20,887 | $18,949 | $20,887 | |
| Direct Cost of Sales | $3,040 | $5,320 | $4,712 | $5,067 | $4,839 | $4,788 | $4,991 | $4,712 | $4,831 | $4,915 | $4,459 | $4,915 | |
| Other Costs of Goods | $0 | $0 | $0 | $0 | $0 | $0 | $0 | $0 | $0 | $0 | $0 | $0 | |
| Total Cost of Sales | $3,040 | $5,320 | $4,712 | $5,067 | $4,839 | $4,788 | $4,991 | $4,712 | $4,831 | $4,915 | $4,459 | $4,915 | |
| Gross Margin | $9,880 | $17,290 | $15,314 | $16,467 | $15,726 | $15,561 | $16,220 | $15,314 | $15,880 | $15,973 | $14,491 | $15,973 | |
| Gross Margin % | 76.47% | 76.47% | 76.47% | 76.47% | 76.47% | 76.47% | 76.47% | 76.47% | 76.68% | 76.47% | 76.47% | 76.47% | |
| Expenses | |||||||||||||
| Payroll | $8,810 | $8,810 | $8,810 | $8,810 | $8,810 | $8,810 | $8,810 | $8,810 | $8,810 | $8,810 | $8,810 | $8,810 | |
| Sales and Marketing and Other Expenses | $500 | $750 | $750 | $750 | $750 | $750 | $750 | $750 | $250 | $250 | $500 | $500 | |
| Depreciation | $170 | $170 | $170 | $170 | $170 | $170 | $170 | $170 | $170 | $170 | $170 | $170 | |
| Rent | $1,200 | $1,200 | $1,200 | $1,200 | $1,200 | $1,200 | $1,200 | $1,200 | $1,200 | $1,200 | $1,200 | $1,200 | |
| Utilities | $600 | $600 | $600 | $600 | $600 | $600 | $600 | $600 | $600 | $600 | $600 | $600 | |
| Insurance | $350 | $350 | $350 | $350 | $350 | $350 | $350 | $350 | $350 | $350 | $350 | $350 | |
| Payroll Taxes | 15% | $670 | $670 | $670 | $670 | $670 | $670 | $670 | $670 | $670 | $670 | $670 | $670 |
| Website Hosting and Maintenance | 15% | $50 | $50 | $50 | $50 | $50 | $50 | $50 | $50 | $50 | $50 | $50 | $50 |
| Other | $0 | $0 | $0 | $0 | $0 | $0 | $0 | $0 | $0 | $0 | $0 | $0 | |
| Total Operating Expenses | $12,350 | $12,600 | $12,600 | $12,600 | $12,600 | $12,600 | $12,600 | $12,600 | $12,100 | $12,100 | $12,350 | $12,350 | |
| Profit Before Interest and Taxes | ($2,470) | $4,690 | $2,714 | $3,866 | $3,125 | $2,961 | $3,619 | $2,714 | $3,779 | $3,872 | $2,140 | $3,622 | |
| EBITDA | ($2,300) | $4,860 | $2,884 | $4,036 | $3,295 | $3,131 | $3,789 | $2,884 | $3,949 | $4,042 | $2,310 | $3,792 | |
| Interest Expense | $102 | $100 | $98 | $96 | $94 | $92 | $90 | $88 | $85 | $83 | $81 | $79 | |
| Taxes Incurred | ($772) | $1,377 | $785 | $1,131 | $910 | $861 | $1,059 | $788 | $1,108 | $1,137 | $618 | $1,063 | |
| Net Profit | ($1,801) | $3,213 | $1,831 | $2,639 | $2,122 | $2,008 | $2,471 | $1,838 | $2,586 | $2,652 | $1,441 | $2,480 | |
| Net Profit/Sales | -13.94% | 14.21% | 9.14% | 12.26% | 10.32% | 9.87% | 11.65% | 9.18% | 12.49% | 12.70% | 7.61% | 11.87% | |
| Pro Forma Cash Flow | |||||||||||||
| Month 1 | Month 2 | Month 3 | Month 4 | Month 5 | Month 6 | Month 7 | Month 8 | Month 9 | Month 10 | Month 11 | Month 12 | ||
| Cash Received | |||||||||||||
| Cash from Operations | |||||||||||||
| Cash Sales | $12,920 | $22,610 | $20,026 | $21,533 | $20,564 | $20,349 | $21,210 | $20,026 | $20,710 | $20,887 | $18,949 | $20,887 | |
| Subtotal Cash from Operations | $12,920 | $22,610 | $20,026 | $21,533 | $20,564 | $20,349 | $21,210 | $20,026 | $20,710 | $20,887 | $18,949 | $20,887 | |
| Additional Cash Received | |||||||||||||
| Sales Tax, VAT, HST/GST Received | 0.00% | $0 | $0 | $0 | $0 | $0 | $0 | $0 | $0 | $0 | $0 | $0 | $0 |
| New Current Borrowing | $0 | $0 | $0 | $0 | $0 | $0 | $0 | $0 | $0 | $0 | $0 | $0 | |
| New Other Liabilities (interest-free) | $0 | $0 | $0 | $0 | $0 | $0 | $0 | $0 | $0 | $0 | $0 | $0 | |
| New Long-term Liabilities | $0 | $0 | $0 | $0 | $0 | $0 | $0 | $0 | $0 | $0 | $0 | $0 | |
| Sales of Other Current Assets | $0 | $0 | $0 | $0 | $0 | $0 | $0 | $0 | $0 | $0 | $0 | $0 | |
| Sales of Long-term Assets | $0 | $0 | $0 | $0 | $0 | $0 | $0 | $0 | $0 | $0 | $0 | $0 | |
| New Investment Received | $0 | $0 | $0 | $0 | $0 | $0 | $0 | $0 | $0 | $0 | $0 | $0 | |
| Subtotal Cash Received | $12,920 | $22,610 | $20,026 | $21,533 | $20,564 | $20,349 | $21,210 | $20,026 | $20,710 | $20,887 | $18,949 | $20,887 | |
| Expenditures | Month 1 | Month 2 | Month 3 | Month 4 | Month 5 | Month 6 | Month 7 | Month 8 | Month 9 | Month 10 | Month 11 | Month 12 | |
| Expenditures from Operations | |||||||||||||
| Cash Spending | $8,810 | $8,810 | $8,810 | $8,810 | $8,810 | $8,810 | $8,810 | $8,810 | $8,810 | $8,810 | $8,810 | $8,810 | |
| Bill Payments | $9,590 | $2,921 | $9,309 | $9,037 | $10,016 | $9,381 | $9,359 | $9,806 | $9,113 | $9,189 | $9,254 | $8,409 | |
| Subtotal Spent on Operations | $18,400 | $11,731 | $18,119 | $17,847 | $18,826 | $18,191 | $18,169 | $18,616 | $17,923 | $17,999 | $18,064 | $17,219 | |
| Additional Cash Spent | |||||||||||||
| Sales Tax, VAT, HST/GST Paid Out | $0 | $0 | $0 | $0 | $0 | $0 | $0 | $0 | $0 | $0 | $0 | $0 | |
| Principal Repayment of Current Borrowing | $0 | $0 | $0 | $0 | $0 | $0 | $0 | $0 | $0 | $0 | $0 | $0 | |
| Other Liabilities Principal Repayment | $0 | $0 | $0 | $0 | $0 | $0 | $0 | $0 | $0 | $0 | $0 | $0 | |
| Long-term Liabilities Principal Repayment | $500 | $500 | $500 | $500 | $500 | $500 | $500 | $500 | $500 | $500 | $500 | $500 | |
| Purchase Other Current Assets | $0 | $0 | $0 | $0 | $0 | $0 | $0 | $0 | $0 | $0 | $0 | $0 | |
| Purchase Long-term Assets | $0 | $0 | $0 | $0 | $0 | $0 | $0 | $0 | $0 | $0 | $0 | $0 | |
| Dividends | $0 | $0 | $0 | $0 | $0 | $0 | $0 | $0 | $0 | $0 | $0 | $0 | |
| Subtotal Cash Spent | $18,900 | $12,231 | $18,619 | $18,347 | $19,326 | $18,691 | $18,669 | $19,116 | $18,423 | $18,499 | $18,564 | $17,719 | |
| Net Cash Flow | ($5,980) | $10,379 | $1,407 | $3,187 | $1,238 | $1,658 | $2,541 | $910 | $2,288 | $2,388 | $386 | $3,168 | |
| Cash Balance | $17,120 | $27,499 | $28,906 | $32,093 | $33,331 | $34,989 | $37,530 | $38,440 | $40,728 | $43,116 | $43,501 | $46,670 | |
| Pro Forma Balance Sheet | |||||||||||||
| Month 1 | Month 2 | Month 3 | Month 4 | Month 5 | Month 6 | Month 7 | Month 8 | Month 9 | Month 10 | Month 11 | Month 12 | ||
| Assets | Starting Balances | ||||||||||||
| Current Assets | |||||||||||||
| Cash | $23,100 | $17,120 | $27,499 | $28,906 | $32,093 | $33,331 | $34,989 | $37,530 | $38,440 | $40,728 | $43,116 | $43,501 | $46,670 |
| Inventory | $6,000 | $2,960 | $1,862 | $1,649 | $1,773 | $1,694 | $1,676 | $1,747 | $1,649 | $1,691 | $1,720 | $1,561 | $1,720 |
| Other Current Assets | $5,250 | $5,250 | $5,250 | $5,250 | $5,250 | $5,250 | $5,250 | $5,250 | $5,250 | $5,250 | $5,250 | $5,250 | $5,250 |
| Total Current Assets | $34,350 | $25,330 | $34,611 | $35,805 | $39,116 | $40,275 | $41,915 | $44,527 | $45,339 | $47,669 | $50,086 | $50,312 | $53,640 |
| Long-term Assets | |||||||||||||
| Long-term Assets | $20,300 | $20,300 | $20,300 | $20,300 | $20,300 | $20,300 | $20,300 | $20,300 | $20,300 | $20,300 | $20,300 | $20,300 | $20,300 |
| Accumulated Depreciation | $0 | $170 | $340 | $510 | $680 | $850 | $1,020 | $1,190 | $1,360 | $1,530 | $1,700 | $1,870 | $2,040 |
| Total Long-term Assets | $20,300 | $20,130 | $19,960 | $19,790 | $19,620 | $19,450 | $19,280 | $19,110 | $18,940 | $18,770 | $18,600 | $18,430 | $18,260 |
| Total Assets | $54,650 | $45,460 | $54,571 | $55,595 | $58,736 | $59,725 | $61,195 | $63,637 | $64,279 | $66,439 | $68,686 | $68,742 | $71,900 |
| Liabilities and Capital | Month 1 | Month 2 | Month 3 | Month 4 | Month 5 | Month 6 | Month 7 | Month 8 | Month 9 | Month 10 | Month 11 | Month 12 | |
| Current Liabilities | |||||||||||||
| Accounts Payable | $9,500 | $2,611 | $9,008 | $8,702 | $9,703 | $9,070 | $9,031 | $9,503 | $8,806 | $8,880 | $8,975 | $8,089 | $9,267 |
| Current Borrowing | $0 | $0 | $0 | $0 | $0 | $0 | $0 | $0 | $0 | $0 | $0 | $0 | $0 |
| Other Current Liabilities | $0 | $0 | $0 | $0 | $0 | $0 | $0 | $0 | $0 | $0 | $0 | $0 | $0 |
| Subtotal Current Liabilities | $9,500 | $2,611 | $9,008 | $8,702 | $9,703 | $9,070 | $9,031 | $9,503 | $8,806 | $8,880 | $8,975 | $8,089 | $9,267 |
| Long-term Liabilities | $25,000 | $24,500 | $24,000 | $23,500 | $23,000 | $22,500 | $22,000 | $21,500 | $21,000 | $20,500 | $20,000 | $19,500 | $19,000 |
| Total Liabilities | $34,500 | $27,111 | $33,008 | $32,202 | $32,703 | $31,570 | $31,031 | $31,003 | $29,806 | $29,380 | $28,975 | $27,589 | $28,267 |
| Paid-in Capital | $46,000 | $46,000 | $46,000 | $46,000 | $46,000 | $46,000 | $46,000 | $46,000 | $46,000 | $46,000 | $46,000 | $46,000 | $46,000 |
| Retained Earnings | ($25,850) | ($25,850) | ($25,850) | ($25,850) | ($25,850) | ($25,850) | ($25,850) | ($25,850) | ($25,850) | ($25,850) | ($25,850) | ($25,850) | ($25,850) |
| Earnings | $0 | ($1,801) | $1,412 | $3,243 | $5,883 | $8,005 | $10,014 | $12,484 | $14,323 | $16,909 | $19,561 | $21,003 | $23,483 |
| Total Capital | $20,150 | $18,349 | $21,562 | $23,393 | $26,033 | $28,155 | $30,164 | $32,634 | $34,473 | $37,059 | $39,711 | $41,153 | $43,633 |
| Total Liabilities and Capital | $54,650 | $45,460 | $54,571 | $55,595 | $58,736 | $59,725 | $61,195 | $63,637 | $64,279 | $66,439 | $68,686 | $68,742 | $71,900 |
| Net Worth | $20,150 | $18,349 | $21,562 | $23,393 | $26,033 | $28,155 | $30,164 | $32,634 | $34,473 | $37,059 | $39,711 | $41,153 | $43,633 |

