
Tsunami Pizza
Executive Summary
The westside of South Gate has experienced explosive growth the past three years. Over 3,000 new residents live in the westside area. Area businesses are slowly catching up with this new opportunity. Tsunami Pizza is opening a new pizza delivery service that will focus on the westside area.
Currently, the area’s closest pizza restaurant takes up to 45 minutes to deliver a pizza. Tsunami will cut the delivery time to no more than 20 minutes.
Tsunami will offer a better pizza, at a lower price, and will deliver it hot to the customer’s door faster than the closest competitor.

1.1 Objectives
- Capture the majority of the pizza delivery business in the westside area.
- Offer our customers a superior product, at a low price, and provide customer service that is second to none.
1.2 Mission
Tsunami Pizza’s mission is to offer residents of the westside the best pizza delivery service in the city.
1.3 Keys to Success
- A superior product that will promote customer loyalty.
- A business location that will assure that the pizza will be delivered quickly.
- Delivery people that have great customer skills.
Company Summary
Tsunami Pizza is a new pizza delivery service started in the city’s westside area. John Lindsay, owner of Tsunami Pizza, has seven years experience in the restaurant industry. His focus is to satisfy the customer’s demand for a quality pizza that is delivered quickly with a smile. Tsunami Pizza will serve a seven mile area with over 25,000 residents. Overhead will be kept low so that Tsunami Pizza’s prices will beat the competition. Delivery people will use their own vehicles so the business will not have to purchase delivery vehicles.
2.1 Start-up Summary
The start-up cost of Tsunami Pizza will consist primarily of kitchen equipment. John Lindsay will invest $50,000.

2.1.1 Company Ownership
Tsunami Pizza is owned by John Lindsay.
| Start-up | |
| Requirements | |
| Start-up Expenses | |
| Legal | $1,000 |
| Kitchen Inventory | $5,000 |
| Delivery Paper Products | $3,000 |
| Leased Kitchen Equipment | $20,000 |
| Insurance | $1,000 |
| Rent | $1,000 |
| Promotional Signs for Delivery Cars | $2,000 |
| Expensed Equipment | $0 |
| Business Sign | $4,000 |
| Other | $0 |
| Total Start-up Expenses | $37,000 |
| Start-up Assets | |
| Cash Required | $5,000 |
| Other Current Assets | $0 |
| Long-term Assets | $8,000 |
| Total Assets | $13,000 |
| Total Requirements | $50,000 |
| Start-up Funding | |
| Start-up Expenses to Fund | $37,000 |
| Start-up Assets to Fund | $13,000 |
| Total Funding Required | $50,000 |
| Assets | |
| Non-cash Assets from Start-up | $8,000 |
| Cash Requirements from Start-up | $5,000 |
| Additional Cash Raised | $0 |
| Cash Balance on Starting Date | $5,000 |
| Total Assets | $13,000 |
| Liabilities and Capital | |
| Liabilities | |
| Current Borrowing | $0 |
| Long-term Liabilities | $0 |
| Accounts Payable (Outstanding Bills) | $0 |
| Other Current Liabilities (interest-free) | $0 |
| Total Liabilities | $0 |
| Capital | |
| Planned Investment | |
| John Lindsey | $50,000 |
| Other | $0 |
| Additional Investment Requirement | $0 |
| Total Planned Investment | $50,000 |
| Loss at Start-up (Start-up Expenses) | ($37,000) |
| Total Capital | $13,000 |
| Total Capital and Liabilities | $13,000 |
| Total Funding | $50,000 |
2.2 Company Locations and Facilities
Tsunami Pizza will be located at the corner of 11th and Tyler. These two streets are the area’s busiest and provide easy access to our service area.
Products
Tsunami Pizza will offer a wide variety of New York style pizzas, as well as sodas and fruit juices.
Market Analysis Summary
The westside is a growing middle-class area with 25,000 residents. A majority of these residents are families of four or more. The average income for the area is $38,000. The boom in the area is primarily in response to new employment opportunities in the city’s Westside Industrial Park. Businesses that traditionally do well with this population have demonstrated the potential for Tsunami Pizza. A neighbor of Tsunami Pizza, Magic Videos, has been in operation in the area for a little over a year. Magic Videos is the closest video store serving the westside area. Their sales have grown by 40% due to its location and the absence of direct competition in the westside.
With continued growth in the area, opportunities to serve the westside residents will increase. The company will sell predominantly to individuals, but it will also accept some catering jobs to individual parties and company functions in the westside.
Strategy and Implementation Summary
Tsunami Pizza will use advertising to promote the business. We will use the local westside flyer to advertise. In addition, we will hire people to hold signs at the corner of 11th and Tyler. We will also use door handle flyer promotion throughout the westside neighborhoods.
Our most important promotion will done in conjunction with Magic Video. We will offer a two for price of one video coupon with each purchase at Tsunami Pizza that can be used at Magic Video. Magic Video will offer its customers a $2 off coupon that can be used at Tsunami Pizza.
5.1 Competitive Edge
Tsunami Pizza’s competitive edge is:
- Location: Tsunami Pizza is located in the heart of the westside area on the corners of 11th and Tyler. These two streets are the area’s busiest. The closest pizza restaurant to the westside area is a fifteen minute drive. Tsunami Pizza can deliver in half the time of its competitors.
- Low Overhead/Lower Prices: Since Tsunami Pizza only delivers pizza, its prices don’t reflect overhead demands of a traditional pizza restaurant.
5.2 Sales Strategy
The sales strategy of Tsunami Pizza is simple. First, offer the customer a superior pizza at a low price. Second, make sure that pizza is delivered quickly. Third, the delivery people must work to create customer loyalty.
5.2.1 Sales Forecast
The following is the sales forecast for three years.
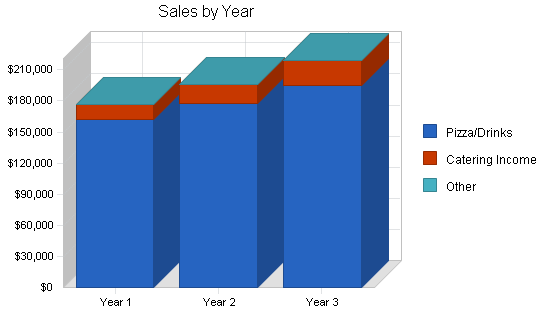
| Sales Forecast | |||
| Year 1 | Year 2 | Year 3 | |
| Sales | |||
| Pizza/Drinks | $162,500 | $178,000 | $195,000 |
| Catering Income | $14,000 | $18,000 | $24,000 |
| Other | $0 | $0 | $0 |
| Total Sales | $176,500 | $196,000 | $219,000 |
| Direct Cost of Sales | Year 1 | Year 2 | Year 3 |
| Pizza/Drinks | $24,500 | $30,000 | $36,000 |
| Catering Income | $1,400 | $1,800 | $2,400 |
| Other | $0 | $0 | $0 |
| Subtotal Direct Cost of Sales | $25,900 | $31,800 | $38,400 |
Management Summary
John Lindsay will be the manager of Tsunami Pizza. John started as a waiter at the city’s famous Sweetwater restaurant. At the time, John was in his junior year at Robertson University. He graduated in 1995 with a BA in history. Soon after graduation, John was offered the position of shift manager at the Sweetwater. He has held that position for five years.
6.1 Personnel Plan
The Tsunami will have the following staff:
- Manager.
- One kitchen staff.
- Two delivery staff.
| Personnel Plan | |||
| Year 1 | Year 2 | Year 3 | |
| Manager | $30,000 | $34,000 | $38,000 |
| Kitchen Staff Member | $24,000 | $25,000 | $29,000 |
| Delivery Staff (2) | $36,000 | $37,000 | $38,000 |
| Other | $0 | $0 | $0 |
| Total People | 4 | 4 | 4 |
| Total Payroll | $90,000 | $96,000 | $105,000 |
Financial Plan
The following is the financial plan for Tsunami Pizza.
7.1 Break-even Analysis
The following table and chart show the Break-even Analysis.

| Break-even Analysis | |
| Monthly Revenue Break-even | $12,803 |
| Assumptions: | |
| Average Percent Variable Cost | 15% |
| Estimated Monthly Fixed Cost | $10,925 |
7.2 Projected Profit and Loss
The following table and charts show the projected profit and loss for three years.


| Pro Forma Profit and Loss | |||
| Year 1 | Year 2 | Year 3 | |
| Sales | $176,500 | $196,000 | $219,000 |
| Direct Cost of Sales | $25,900 | $31,800 | $38,400 |
| Other Production Expenses | $0 | $0 | $0 |
| Total Cost of Sales | $25,900 | $31,800 | $38,400 |
| Gross Margin | $150,600 | $164,200 | $180,600 |
| Gross Margin % | 85.33% | 83.78% | 82.47% |
| Expenses | |||
| Payroll | $90,000 | $96,000 | $105,000 |
| Sales and Marketing and Other Expenses | $8,000 | $8,000 | $8,000 |
| Depreciation | $1,596 | $1,600 | $1,600 |
| Leased Equipment | $0 | $0 | $0 |
| Utilities | $6,000 | $6,000 | $6,000 |
| Insurance | $0 | $0 | $0 |
| Rent | $12,000 | $12,000 | $12,000 |
| Payroll Taxes | $13,500 | $14,400 | $15,750 |
| Other | $0 | $0 | $0 |
| Total Operating Expenses | $131,096 | $138,000 | $148,350 |
| Profit Before Interest and Taxes | $19,504 | $26,200 | $32,250 |
| EBITDA | $21,100 | $27,800 | $33,850 |
| Interest Expense | $0 | $0 | $0 |
| Taxes Incurred | $5,851 | $7,860 | $9,675 |
| Net Profit | $13,653 | $18,340 | $22,575 |
| Net Profit/Sales | 7.74% | 9.36% | 10.31% |
7.3 Projected Cash Flow
The following table and chart is the projected cash flow for three years.

| Pro Forma Cash Flow | |||
| Year 1 | Year 2 | Year 3 | |
| Cash Received | |||
| Cash from Operations | |||
| Cash Sales | $176,500 | $196,000 | $219,000 |
| Subtotal Cash from Operations | $176,500 | $196,000 | $219,000 |
| Additional Cash Received | |||
| Sales Tax, VAT, HST/GST Received | $0 | $0 | $0 |
| New Current Borrowing | $0 | $0 | $0 |
| New Other Liabilities (interest-free) | $0 | $0 | $0 |
| New Long-term Liabilities | $0 | $0 | $0 |
| Sales of Other Current Assets | $0 | $0 | $0 |
| Sales of Long-term Assets | $0 | $0 | $0 |
| New Investment Received | $0 | $0 | $0 |
| Subtotal Cash Received | $176,500 | $196,000 | $219,000 |
| Expenditures | Year 1 | Year 2 | Year 3 |
| Expenditures from Operations | |||
| Cash Spending | $90,000 | $96,000 | $105,000 |
| Bill Payments | $63,520 | $81,211 | $89,022 |
| Subtotal Spent on Operations | $153,520 | $177,211 | $194,022 |
| Additional Cash Spent | |||
| Sales Tax, VAT, HST/GST Paid Out | $0 | $0 | $0 |
| Principal Repayment of Current Borrowing | $0 | $0 | $0 |
| Other Liabilities Principal Repayment | $0 | $0 | $0 |
| Long-term Liabilities Principal Repayment | $0 | $0 | $0 |
| Purchase Other Current Assets | $0 | $0 | $0 |
| Purchase Long-term Assets | $0 | $0 | $0 |
| Dividends | $0 | $0 | $0 |
| Subtotal Cash Spent | $153,520 | $177,211 | $194,022 |
| Net Cash Flow | $22,980 | $18,789 | $24,978 |
| Cash Balance | $27,980 | $46,769 | $71,747 |

7.4 Projected Balance Sheet
The following table is the projected balance sheet for three years.
| Pro Forma Balance Sheet | |||
| Year 1 | Year 2 | Year 3 | |
| Assets | |||
| Current Assets | |||
| Cash | $27,980 | $46,769 | $71,747 |
| Other Current Assets | $0 | $0 | $0 |
| Total Current Assets | $27,980 | $46,769 | $71,747 |
| Long-term Assets | |||
| Long-term Assets | $8,000 | $8,000 | $8,000 |
| Accumulated Depreciation | $1,596 | $3,196 | $4,796 |
| Total Long-term Assets | $6,404 | $4,804 | $3,204 |
| Total Assets | $34,384 | $51,573 | $74,951 |
| Liabilities and Capital | Year 1 | Year 2 | Year 3 |
| Current Liabilities | |||
| Accounts Payable | $7,731 | $6,580 | $7,383 |
| Current Borrowing | $0 | $0 | $0 |
| Other Current Liabilities | $0 | $0 | $0 |
| Subtotal Current Liabilities | $7,731 | $6,580 | $7,383 |
| Long-term Liabilities | $0 | $0 | $0 |
| Total Liabilities | $7,731 | $6,580 | $7,383 |
| Paid-in Capital | $50,000 | $50,000 | $50,000 |
| Retained Earnings | ($37,000) | ($23,347) | ($5,007) |
| Earnings | $13,653 | $18,340 | $22,575 |
| Total Capital | $26,653 | $44,993 | $67,568 |
| Total Liabilities and Capital | $34,384 | $51,573 | $74,951 |
| Net Worth | $26,653 | $44,993 | $67,568 |
7.5 Business Ratios
Business ratios for the years of this plan are shown below. Industry profile ratios based on the Standard Industrial Classification (SIC) code 5812, Eating Places, are shown for comparison.
| Ratio Analysis | ||||
| Year 1 | Year 2 | Year 3 | Industry Profile | |
| Sales Growth | 0.00% | 11.05% | 11.73% | 7.60% |
| Percent of Total Assets | ||||
| Other Current Assets | 0.00% | 0.00% | 0.00% | 35.60% |
| Total Current Assets | 81.37% | 90.69% | 95.73% | 43.70% |
| Long-term Assets | 18.63% | 9.31% | 4.27% | 56.30% |
| Total Assets | 100.00% | 100.00% | 100.00% | 100.00% |
| Current Liabilities | 22.48% | 12.76% | 9.85% | 32.70% |
| Long-term Liabilities | 0.00% | 0.00% | 0.00% | 28.50% |
| Total Liabilities | 22.48% | 12.76% | 9.85% | 61.20% |
| Net Worth | 77.52% | 87.24% | 90.15% | 38.80% |
| Percent of Sales | ||||
| Sales | 100.00% | 100.00% | 100.00% | 100.00% |
| Gross Margin | 85.33% | 83.78% | 82.47% | 60.50% |
| Selling, General & Administrative Expenses | 77.59% | 74.42% | 72.16% | 39.80% |
| Advertising Expenses | 4.53% | 4.08% | 3.65% | 3.20% |
| Profit Before Interest and Taxes | 11.05% | 13.37% | 14.73% | 0.70% |
| Main Ratios | ||||
| Current | 3.62 | 7.11 | 9.72 | 0.98 |
| Quick | 3.62 | 7.11 | 9.72 | 0.65 |
| Total Debt to Total Assets | 22.48% | 12.76% | 9.85% | 61.20% |
| Pre-tax Return on Net Worth | 73.18% | 58.23% | 47.73% | 1.70% |
| Pre-tax Return on Assets | 56.72% | 50.80% | 43.03% | 4.30% |
| Additional Ratios | Year 1 | Year 2 | Year 3 | |
| Net Profit Margin | 7.74% | 9.36% | 10.31% | n.a |
| Return on Equity | 51.22% | 40.76% | 33.41% | n.a |
| Activity Ratios | ||||
| Accounts Payable Turnover | 9.22 | 12.17 | 12.17 | n.a |
| Payment Days | 27 | 33 | 28 | n.a |
| Total Asset Turnover | 5.13 | 3.80 | 2.92 | n.a |
| Debt Ratios | ||||
| Debt to Net Worth | 0.29 | 0.15 | 0.11 | n.a |
| Current Liab. to Liab. | 1.00 | 1.00 | 1.00 | n.a |
| Liquidity Ratios | ||||
| Net Working Capital | $20,249 | $40,189 | $64,364 | n.a |
| Interest Coverage | 0.00 | 0.00 | 0.00 | n.a |
| Additional Ratios | ||||
| Assets to Sales | 0.19 | 0.26 | 0.34 | n.a |
| Current Debt/Total Assets | 22% | 13% | 10% | n.a |
| Acid Test | 3.62 | 7.11 | 9.72 | n.a |
| Sales/Net Worth | 6.62 | 4.36 | 3.24 | n.a |
| Dividend Payout | 0.00 | 0.00 | 0.00 | n.a |
Appendix
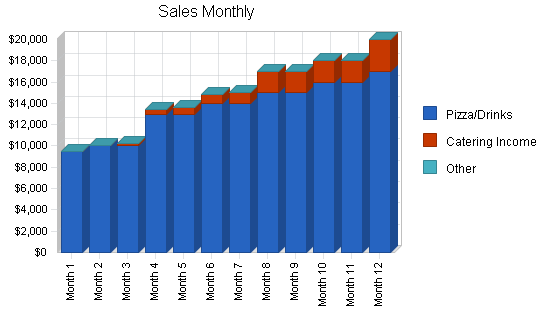
| Sales Forecast | |||||||||||||
| Month 1 | Month 2 | Month 3 | Month 4 | Month 5 | Month 6 | Month 7 | Month 8 | Month 9 | Month 10 | Month 11 | Month 12 | ||
| Sales | |||||||||||||
| Pizza/Drinks | 0% | $9,500 | $10,000 | $10,000 | $13,000 | $13,000 | $14,000 | $14,000 | $15,000 | $15,000 | $16,000 | $16,000 | $17,000 |
| Catering Income | 0% | $0 | $0 | $200 | $400 | $600 | $800 | $1,000 | $2,000 | $2,000 | $2,000 | $2,000 | $3,000 |
| Other | 0% | $0 | $0 | $0 | $0 | $0 | $0 | $0 | $0 | $0 | $0 | $0 | $0 |
| Total Sales | $9,500 | $10,000 | $10,200 | $13,400 | $13,600 | $14,800 | $15,000 | $17,000 | $17,000 | $18,000 | $18,000 | $20,000 | |
| Direct Cost of Sales | Month 1 | Month 2 | Month 3 | Month 4 | Month 5 | Month 6 | Month 7 | Month 8 | Month 9 | Month 10 | Month 11 | Month 12 | |
| Pizza/Drinks | $1,000 | $1,100 | $1,100 | $2,000 | $2,000 | $2,200 | $2,200 | $2,400 | $2,400 | $2,700 | $2,700 | $2,700 | |
| Catering Income | $0 | $0 | $20 | $40 | $60 | $80 | $100 | $200 | $200 | $200 | $200 | $300 | |
| Other | $0 | $0 | $0 | $0 | $0 | $0 | $0 | $0 | $0 | $0 | $0 | $0 | |
| Subtotal Direct Cost of Sales | $1,000 | $1,100 | $1,120 | $2,040 | $2,060 | $2,280 | $2,300 | $2,600 | $2,600 | $2,900 | $2,900 | $3,000 | |
| Personnel Plan | |||||||||||||
| Month 1 | Month 2 | Month 3 | Month 4 | Month 5 | Month 6 | Month 7 | Month 8 | Month 9 | Month 10 | Month 11 | Month 12 | ||
| Manager | 0% | $2,500 | $2,500 | $2,500 | $2,500 | $2,500 | $2,500 | $2,500 | $2,500 | $2,500 | $2,500 | $2,500 | $2,500 |
| Kitchen Staff Member | 0% | $2,000 | $2,000 | $2,000 | $2,000 | $2,000 | $2,000 | $2,000 | $2,000 | $2,000 | $2,000 | $2,000 | $2,000 |
| Delivery Staff (2) | 0% | $3,000 | $3,000 | $3,000 | $3,000 | $3,000 | $3,000 | $3,000 | $3,000 | $3,000 | $3,000 | $3,000 | $3,000 |
| Other | 0% | $0 | $0 | $0 | $0 | $0 | $0 | $0 | $0 | $0 | $0 | $0 | $0 |
| Total People | 4 | 4 | 4 | 4 | 4 | 4 | 4 | 4 | 4 | 4 | 4 | 4 | |
| Total Payroll | $7,500 | $7,500 | $7,500 | $7,500 | $7,500 | $7,500 | $7,500 | $7,500 | $7,500 | $7,500 | $7,500 | $7,500 | |
| General Assumptions | |||||||||||||
| Month 1 | Month 2 | Month 3 | Month 4 | Month 5 | Month 6 | Month 7 | Month 8 | Month 9 | Month 10 | Month 11 | Month 12 | ||
| Plan Month | 1 | 2 | 3 | 4 | 5 | 6 | 7 | 8 | 9 | 10 | 11 | 12 | |
| Current Interest Rate | 10.00% | 10.00% | 10.00% | 10.00% | 10.00% | 10.00% | 10.00% | 10.00% | 10.00% | 10.00% | 10.00% | 10.00% | |
| Long-term Interest Rate | 10.00% | 10.00% | 10.00% | 10.00% | 10.00% | 10.00% | 10.00% | 10.00% | 10.00% | 10.00% | 10.00% | 10.00% | |
| Tax Rate | 30.00% | 30.00% | 30.00% | 30.00% | 30.00% | 30.00% | 30.00% | 30.00% | 30.00% | 30.00% | 30.00% | 30.00% | |
| Other | 0 | 0 | 0 | 0 | 0 | 0 | 0 | 0 | 0 | 0 | 0 | 0 | |
| Pro Forma Profit and Loss | |||||||||||||
| Month 1 | Month 2 | Month 3 | Month 4 | Month 5 | Month 6 | Month 7 | Month 8 | Month 9 | Month 10 | Month 11 | Month 12 | ||
| Sales | $9,500 | $10,000 | $10,200 | $13,400 | $13,600 | $14,800 | $15,000 | $17,000 | $17,000 | $18,000 | $18,000 | $20,000 | |
| Direct Cost of Sales | $1,000 | $1,100 | $1,120 | $2,040 | $2,060 | $2,280 | $2,300 | $2,600 | $2,600 | $2,900 | $2,900 | $3,000 | |
| Other Production Expenses | $0 | $0 | $0 | $0 | $0 | $0 | $0 | $0 | $0 | $0 | $0 | $0 | |
| Total Cost of Sales | $1,000 | $1,100 | $1,120 | $2,040 | $2,060 | $2,280 | $2,300 | $2,600 | $2,600 | $2,900 | $2,900 | $3,000 | |
| Gross Margin | $8,500 | $8,900 | $9,080 | $11,360 | $11,540 | $12,520 | $12,700 | $14,400 | $14,400 | $15,100 | $15,100 | $17,000 | |
| Gross Margin % | 89.47% | 89.00% | 89.02% | 84.78% | 84.85% | 84.59% | 84.67% | 84.71% | 84.71% | 83.89% | 83.89% | 85.00% | |
| Expenses | |||||||||||||
| Payroll | $7,500 | $7,500 | $7,500 | $7,500 | $7,500 | $7,500 | $7,500 | $7,500 | $7,500 | $7,500 | $7,500 | $7,500 | |
| Sales and Marketing and Other Expenses | $1,000 | $1,000 | $1,000 | $1,000 | $500 | $500 | $500 | $500 | $500 | $500 | $500 | $500 | |
| Depreciation | $133 | $133 | $133 | $133 | $133 | $133 | $133 | $133 | $133 | $133 | $133 | $133 | |
| Leased Equipment | $0 | $0 | $0 | $0 | $0 | $0 | $0 | $0 | $0 | $0 | $0 | $0 | |
| Utilities | $500 | $500 | $500 | $500 | $500 | $500 | $500 | $500 | $500 | $500 | $500 | $500 | |
| Insurance | $0 | $0 | $0 | $0 | $0 | $0 | $0 | $0 | $0 | $0 | $0 | $0 | |
| Rent | $1,000 | $1,000 | $1,000 | $1,000 | $1,000 | $1,000 | $1,000 | $1,000 | $1,000 | $1,000 | $1,000 | $1,000 | |
| Payroll Taxes | 15% | $1,125 | $1,125 | $1,125 | $1,125 | $1,125 | $1,125 | $1,125 | $1,125 | $1,125 | $1,125 | $1,125 | $1,125 |
| Other | $0 | $0 | $0 | $0 | $0 | $0 | $0 | $0 | $0 | $0 | $0 | $0 | |
| Total Operating Expenses | $11,258 | $11,258 | $11,258 | $11,258 | $10,758 | $10,758 | $10,758 | $10,758 | $10,758 | $10,758 | $10,758 | $10,758 | |
| Profit Before Interest and Taxes | ($2,758) | ($2,358) | ($2,178) | $102 | $782 | $1,762 | $1,942 | $3,642 | $3,642 | $4,342 | $4,342 | $6,242 | |
| EBITDA | ($2,625) | ($2,225) | ($2,045) | $235 | $915 | $1,895 | $2,075 | $3,775 | $3,775 | $4,475 | $4,475 | $6,375 | |
| Interest Expense | $0 | $0 | $0 | $0 | $0 | $0 | $0 | $0 | $0 | $0 | $0 | $0 | |
| Taxes Incurred | ($827) | ($707) | ($653) | $31 | $235 | $529 | $583 | $1,093 | $1,093 | $1,303 | $1,303 | $1,873 | |
| Net Profit | ($1,931) | ($1,651) | ($1,525) | $71 | $547 | $1,233 | $1,359 | $2,549 | $2,549 | $3,039 | $3,039 | $4,369 | |
| Net Profit/Sales | -20.32% | -16.51% | -14.95% | 0.53% | 4.03% | 8.33% | 9.06% | 15.00% | 15.00% | 16.89% | 16.89% | 21.85% | |
| Pro Forma Cash Flow | |||||||||||||
| Month 1 | Month 2 | Month 3 | Month 4 | Month 5 | Month 6 | Month 7 | Month 8 | Month 9 | Month 10 | Month 11 | Month 12 | ||
| Cash Received | |||||||||||||
| Cash from Operations | |||||||||||||
| Cash Sales | $9,500 | $10,000 | $10,200 | $13,400 | $13,600 | $14,800 | $15,000 | $17,000 | $17,000 | $18,000 | $18,000 | $20,000 | |
| Subtotal Cash from Operations | $9,500 | $10,000 | $10,200 | $13,400 | $13,600 | $14,800 | $15,000 | $17,000 | $17,000 | $18,000 | $18,000 | $20,000 | |
| Additional Cash Received | |||||||||||||
| Sales Tax, VAT, HST/GST Received | 0.00% | $0 | $0 | $0 | $0 | $0 | $0 | $0 | $0 | $0 | $0 | $0 | $0 |
| New Current Borrowing | $0 | $0 | $0 | $0 | $0 | $0 | $0 | $0 | $0 | $0 | $0 | $0 | |
| New Other Liabilities (interest-free) | $0 | $0 | $0 | $0 | $0 | $0 | $0 | $0 | $0 | $0 | $0 | $0 | |
| New Long-term Liabilities | $0 | $0 | $0 | $0 | $0 | $0 | $0 | $0 | $0 | $0 | $0 | $0 | |
| Sales of Other Current Assets | $0 | $0 | $0 | $0 | $0 | $0 | $0 | $0 | $0 | $0 | $0 | $0 | |
| Sales of Long-term Assets | $0 | $0 | $0 | $0 | $0 | $0 | $0 | $0 | $0 | $0 | $0 | $0 | |
| New Investment Received | $0 | $0 | $0 | $0 | $0 | $0 | $0 | $0 | $0 | $0 | $0 | $0 | |
| Subtotal Cash Received | $9,500 | $10,000 | $10,200 | $13,400 | $13,600 | $14,800 | $15,000 | $17,000 | $17,000 | $18,000 | $18,000 | $20,000 | |
| Expenditures | Month 1 | Month 2 | Month 3 | Month 4 | Month 5 | Month 6 | Month 7 | Month 8 | Month 9 | Month 10 | Month 11 | Month 12 | |
| Expenditures from Operations | |||||||||||||
| Cash Spending | $7,500 | $7,500 | $7,500 | $7,500 | $7,500 | $7,500 | $7,500 | $7,500 | $7,500 | $7,500 | $7,500 | $7,500 | |
| Bill Payments | $127 | $3,805 | $4,020 | $4,145 | $5,686 | $5,437 | $5,936 | $6,035 | $6,818 | $6,835 | $7,328 | $7,350 | |
| Subtotal Spent on Operations | $7,627 | $11,305 | $11,520 | $11,645 | $13,186 | $12,937 | $13,436 | $13,535 | $14,318 | $14,335 | $14,828 | $14,850 | |
| Additional Cash Spent | |||||||||||||
| Sales Tax, VAT, HST/GST Paid Out | $0 | $0 | $0 | $0 | $0 | $0 | $0 | $0 | $0 | $0 | $0 | $0 | |
| Principal Repayment of Current Borrowing | $0 | $0 | $0 | $0 | $0 | $0 | $0 | $0 | $0 | $0 | $0 | $0 | |
| Other Liabilities Principal Repayment | $0 | $0 | $0 | $0 | $0 | $0 | $0 | $0 | $0 | $0 | $0 | $0 | |
| Long-term Liabilities Principal Repayment | $0 | $0 | $0 | $0 | $0 | $0 | $0 | $0 | $0 | $0 | $0 | $0 | |
| Purchase Other Current Assets | $0 | $0 | $0 | $0 | $0 | $0 | $0 | $0 | $0 | $0 | $0 | $0 | |
| Purchase Long-term Assets | $0 | $0 | $0 | $0 | $0 | $0 | $0 | $0 | $0 | $0 | $0 | $0 | |
| Dividends | $0 | $0 | $0 | $0 | $0 | $0 | $0 | $0 | $0 | $0 | $0 | $0 | |
| Subtotal Cash Spent | $7,627 | $11,305 | $11,520 | $11,645 | $13,186 | $12,937 | $13,436 | $13,535 | $14,318 | $14,335 | $14,828 | $14,850 | |
| Net Cash Flow | $1,873 | ($1,305) | ($1,320) | $1,755 | $414 | $1,863 | $1,564 | $3,465 | $2,682 | $3,665 | $3,172 | $5,150 | |
| Cash Balance | $6,873 | $5,568 | $4,248 | $6,003 | $6,417 | $8,280 | $9,844 | $13,310 | $15,992 | $19,657 | $22,830 | $27,980 | |
| Pro Forma Balance Sheet | |||||||||||||
| Month 1 | Month 2 | Month 3 | Month 4 | Month 5 | Month 6 | Month 7 | Month 8 | Month 9 | Month 10 | Month 11 | Month 12 | ||
| Assets | Starting Balances | ||||||||||||
| Current Assets | |||||||||||||
| Cash | $5,000 | $6,873 | $5,568 | $4,248 | $6,003 | $6,417 | $8,280 | $9,844 | $13,310 | $15,992 | $19,657 | $22,830 | $27,980 |
| Other Current Assets | $0 | $0 | $0 | $0 | $0 | $0 | $0 | $0 | $0 | $0 | $0 | $0 | $0 |
| Total Current Assets | $5,000 | $6,873 | $5,568 | $4,248 | $6,003 | $6,417 | $8,280 | $9,844 | $13,310 | $15,992 | $19,657 | $22,830 | $27,980 |
| Long-term Assets | |||||||||||||
| Long-term Assets | $8,000 | $8,000 | $8,000 | $8,000 | $8,000 | $8,000 | $8,000 | $8,000 | $8,000 | $8,000 | $8,000 | $8,000 | $8,000 |
| Accumulated Depreciation | $0 | $133 | $266 | $399 | $532 | $665 | $798 | $931 | $1,064 | $1,197 | $1,330 | $1,463 | $1,596 |
| Total Long-term Assets | $8,000 | $7,867 | $7,734 | $7,601 | $7,468 | $7,335 | $7,202 | $7,069 | $6,936 | $6,803 | $6,670 | $6,537 | $6,404 |
| Total Assets | $13,000 | $14,740 | $13,302 | $11,849 | $13,471 | $13,752 | $15,482 | $16,913 | $20,246 | $22,795 | $26,327 | $29,367 | $34,384 |
| Liabilities and Capital | Month 1 | Month 2 | Month 3 | Month 4 | Month 5 | Month 6 | Month 7 | Month 8 | Month 9 | Month 10 | Month 11 | Month 12 | |
| Current Liabilities | |||||||||||||
| Accounts Payable | $0 | $3,671 | $3,884 | $3,955 | $5,506 | $5,239 | $5,736 | $5,807 | $6,590 | $6,590 | $7,083 | $7,083 | $7,731 |
| Current Borrowing | $0 | $0 | $0 | $0 | $0 | $0 | $0 | $0 | $0 | $0 | $0 | $0 | $0 |
| Other Current Liabilities | $0 | $0 | $0 | $0 | $0 | $0 | $0 | $0 | $0 | $0 | $0 | $0 | $0 |
| Subtotal Current Liabilities | $0 | $3,671 | $3,884 | $3,955 | $5,506 | $5,239 | $5,736 | $5,807 | $6,590 | $6,590 | $7,083 | $7,083 | $7,731 |
| Long-term Liabilities | $0 | $0 | $0 | $0 | $0 | $0 | $0 | $0 | $0 | $0 | $0 | $0 | $0 |
| Total Liabilities | $0 | $3,671 | $3,884 | $3,955 | $5,506 | $5,239 | $5,736 | $5,807 | $6,590 | $6,590 | $7,083 | $7,083 | $7,731 |
| Paid-in Capital | $50,000 | $50,000 | $50,000 | $50,000 | $50,000 | $50,000 | $50,000 | $50,000 | $50,000 | $50,000 | $50,000 | $50,000 | $50,000 |
| Retained Earnings | ($37,000) | ($37,000) | ($37,000) | ($37,000) | ($37,000) | ($37,000) | ($37,000) | ($37,000) | ($37,000) | ($37,000) | ($37,000) | ($37,000) | ($37,000) |
| Earnings | $0 | ($1,931) | ($3,581) | ($5,106) | ($5,034) | ($4,487) | ($3,254) | ($1,894) | $655 | $3,205 | $6,244 | $9,283 | $13,653 |
| Total Capital | $13,000 | $11,069 | $9,419 | $7,894 | $7,966 | $8,513 | $9,746 | $11,106 | $13,655 | $16,205 | $19,244 | $22,283 | $26,653 |
| Total Liabilities and Capital | $13,000 | $14,740 | $13,302 | $11,849 | $13,471 | $13,752 | $15,482 | $16,913 | $20,246 | $22,795 | $26,327 | $29,367 | $34,384 |
| Net Worth | $13,000 | $11,069 | $9,419 | $7,894 | $7,966 | $8,513 | $9,746 | $11,106 | $13,655 | $16,205 | $19,244 | $22,283 | $26,653 |


