
UPer Crust Pies
Executive Summary
UPer Crust Pies will specialize in meat, vegetable and fruit pies made using old-country traditional family recipes from the UP – Michigan’s Upper Peninsula. Our pies will be baked fresh everyday and sold hot directly to customers through our retail stores. We will also sell frozen pies in lunch and family sizes that can be cooked at home in an oven or microwave. Our products are low fat and free of genetically modified ingredients and will be complemented by an assortment of fresh premium salads and desserts.
By importing our products directly from a private label bakery in the UP we avoid high labor costs, expensive investment in manufacturing and production equipment, and additional warehousing and production facility costs. Our major costs will be limited to product purchasing, shipping and cold storage.
We have plans to expand the company through further retail outlets and are focused on developing a business model that is favorable to franchise possibilities. With an exclusive import license that could be used to sell frozen product through supermarkets and bulk wholesale food chains, UPer Crust Pies could quickly and clearly establish itself as the market leader.
We have identified four main keys to our success. The first is to secure stores in highly visible locations. The second will be our unique value-for-money product line. The third will be a focus on superior customer service and education, and the fourth key will be employee retention through training and internal promotion.
The proposed business location for the first UPer Crust Pies store will be in downtown Yubetchatown. At this stage five possible sites are being considered in three areas. UPer Crust Pies will target three market segments within the core metro district. Our largest target market is young adults and business people (42%). Our next largest market, and the one with the greatest growth potential, is families with children (36%), and our final target market will be 15-24 year olds which includes students (22%).
Our marketing strategy will be to attract new customers, educate those customers and then create a loyal customer base. UPer Crust Pies will attract consumers through highly visible signage, print media advertising, flyers, entertainment book coupons, word-of-mouth advertising and strategic alliances.
Our sales strategy includes hiring employees who genuinely enjoy their jobs. We will continually assess all aspects of the business and interact with our customers personally, evaluating food choices for popularity and keeping favorites on the menu as we rotate weekly and seasonal specials.
UPer Crust Pies is a Limited Liability Company. All membership shares are currently owned by Lina and Olie Mackinac-Gogebic, with the intent of using a portion of shares to raise capital. UPer Crust Pies is currently seeking a bank loan with an additional private investment contribution from outside investors. The majority of these funds will be used for corporate design, remodeling and lease payments three months prior to opening.
Start-up costs include initial inventory for the first store including shipping and cold storage fees associated with the product. Equipment assets such as a commercial oven, pie warmers, ambient display cases, refrigerators, freezers and miscellaneous one-time furnishings must be purchased. In addition, UPer Crust Pies anticipates the need for liquid cash for operating expenses, unforseen expenses and to help cover wages for the first three months of business.
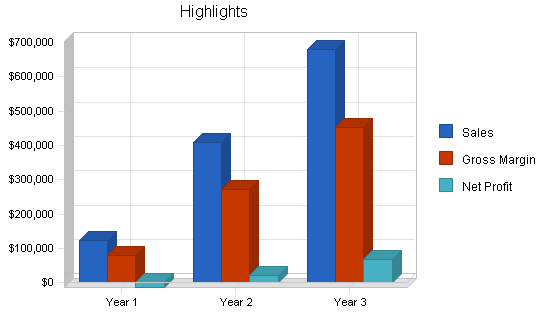
UPer Crust Pies has forecasted a modest growth rate for the first year of business. In the second year, the company will add two more stores and in the third year, an additional two stores. The addition of these stores will increase the gross revenue in the second and third years. Compared to industry standards we have forecasted a very conservative growth rate for the first three years of operations.
1.1 Objectives
- Achieve first year sales above $120,000.
- Maintain a healthy average gross margin.
- Develop a business model that is favorable to expansion.
- Establish five store locations by the end of the third year.
1.2 Mission
Customer satisfaction and education are our paramount missions. We will endeavor to meet the highest standards of excellence through superb customer service and consistent product delivery in a friendly and comforting environment.
We seek fair and responsible profit, enough to keep the company financially healthy and ensure continued growth and development. Responsible profit will fairly compensate owners and investors for their risk and reward employees for their hard work, loyalty and commitment.
Employee welfare, participation, and training are equally important to our success. Every employee will be treated fairly, with dignity and the utmost respect. It is our responsibility to provide employees with a friendly, comfortable and challenging work environment with opportunities for growth and development.
1.3 Keys to Success
- Locations: visibility, high traffic patterns, convenient access.
- Store design: visually attractive, relaxed atmosphere, fast and efficient operations.
- Unique products: differentiation, competitive pricing, no direct competition.
- Quality controls: genetically modified free policy, consistency, clean presentation.
- Service: cheerful, professional, articulate and informative.
- Marketing: positive image, educational, word-of-mouth advertising.
- Employee retention: training, ongoing education, recognition programs.
Company Summary
UPer Crust Pies is a specialty meat and fruit pie retailer importing its products from Michigan’s Upper Peninsula. At present there are only two small competitors servicing the entire U.S.A. UPer Crust Pies will offer hot ready-to-go meat and fruit pies and frozen take-home options as well as an assortment of fresh salads and cold beverages.
We are considering five possible locations for its first store in downtown Yubetchatown. The company has plans to expand with an additional four stores in the local megalopolis over the next three years. Implementing a sound business model into our first store will aid expansion plans and open up the possibility of franchising.
UPer Crust Pies is currently seeking a bank loan and an additional private investment contribution from outside investors and family members.
Major costs include initial inventory purchases, equipment purchases, shop rental, personnel wages, site remodeling, marketing and various other operating expenses. Projected gross sales for the first year of business are expected to be over $120,000.
2.1 Company Ownership
UPer Crust Pies is a Limited Liability Company. All membership shares are currently owned by Lina and Olie Mackinac-Gogebic, with the intent of using a portion of these shares to raise private investment through outside investors and family members.
If all funds are raised, based on the investment requirements established in the financial section of this plan, Lina and Olie Mackinac-Gogebic will maintain ownership of no less than 51% of the company.
Reinvestment of earnings will be the backbone of this business after start-up and will ensure future growth and achievement of the company’s goals. A second and possibly third round of private investment may be considered to aid the company’s expansion plans in years two and three of operations.

2.2 Start-up Summary
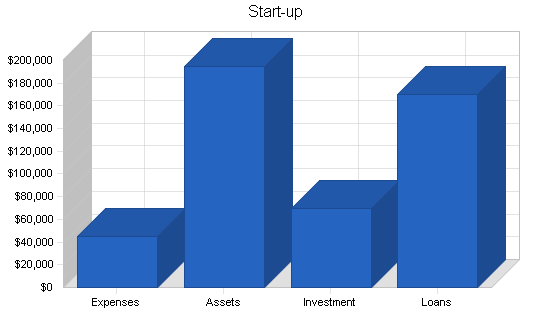
Start-up expenses and assets are shown below, and the majority of these funds will be used for corporate design, re-modeling and to pay rent for three months prior to opening.
No legal costs will be incurred as the owners have agreed to trade a stock option with the company’s legal counsel in return for on-going legal services.
Start-up assets include initial inventory for the first store including purchasing, packaging, shipping and cold storage fees associated with buying the product inventory. Purchases of equipment assets such as a commercial oven, pie warmers, ambient display cases, refrigerators and freezers and miscellaneous one-time furnishings are necessary. The company anticipates the need for liquid cash for operating expenses, unforseen company expenses and to help cover wages for the first three months of business.
| Start-up | |
| Requirements | |
| Start-up Expenses | |
| Legal | $0 |
| Stationery | $600 |
| Liability insurance | $2,000 |
| Rent (3 months prior to opening) | $8,000 |
| Computer | $1,200 |
| Licenses | $700 |
| Corporate design | $9,000 |
| Web design & implementation | $3,500 |
| Lease-hold improvements | $20,000 |
| Total Start-up Expenses | $45,000 |
| Start-up Assets | |
| Cash Required | $118,000 |
| Start-up Inventory | $12,000 |
| Other Current Assets | $0 |
| Long-term Assets | $65,000 |
| Total Assets | $195,000 |
| Total Requirements | $240,000 |
Services
UPer Crust Pies will specialize in quality pies and pastries, imported frozen from the Upper Peninsula of Michigan and baked fresh every day. The premium taste, presentation and quality of our pies will not only be unique in Yubetchatown and the greater megalopolis area, but in the entire United States.
UPer Crust Pies are low in fat, free of genetically modified ingredients and made with premium ingredients. After oven baking, pies are put into warmers and held at a steady temperature to ensure rapid service and high customer satisfaction.
The company will also sell frozen pies that can be taken home and cooked in an oven or microwave. New technology in manufacturing has enabled New Zealand producers to develop a pie that can be heated by microwave in less than three minutes with the pastry remaining flaky as if it had been cooked in a convection oven for thirty minutes.
Our pies experience will be complemented by an assortment of premium salads and desserts as well as cold beverages. Savory samples will also be offered to first-time visitors.
What is a Pie?
The meat pie is a traditional old-country food consisting of savory fillings in a pastry shell. Traditional fillings include beef and cheese, steak, bacon and egg, and chicken and vegetable to name a few.
Usually eaten hot from a paper bag, with flaky golden pastry and savory fillings, the pie is unpretentious comfort food. UPer Crust Pies will bring the Upper Peninsula pie experience to the U.S. and endeavor to establish the humble meat pie as gourmet fare for Americans while bringing a taste of home to “UPers” living throughout America.
The Menu
The Classic Pie Selection (6.25 oz)
- Beef: Lean savory ground beef in a smooth sauce with fresh herbs and spices in a low-fat pastry.
- Steak: Prime lean steak in rich hearty gravy wrapped in a low-fat flaky pastry.
- Chicken & Vegetable: Chicken breast with garden vegetables in creamy white sauce and wrapped in a low-fat flaky pastry.
- Bacon & Egg: One egg cracked on top of a lean slice of shoulder bacon wrapped in a low-fat flaky pastry.
- Potato Top: A traditional Shepherds pie with lean ground minced beef and a creamy mashed potato topping.
- Steak & Mushroom: Chunky steak prepared in a smooth dark sauce with fresh sliced mushrooms in a low-fat flaky pastry.
- Steak & Cheese: Chunky steak in a dark gravy mixed with pizza blended cheese and wrapped in a low-fat flaky pastry.
- Beef & Cheese: Ground beef in rich gravy mixed with pizza blended cheese and wrapped in a low-fat flaky pastry.
The Gourmet Pie Selection (9.5 oz)
- Thai Chicken: Succulent chicken breast in a creamy oriental sauce wrapped in a light low-fat flaky pastry.
- Bacon & Egg: Two whole eggs cracked on top of lean shoulder bacon, wrapped in a low-fat flaky pastry.
- Beef, Cheese & Tomato: Ground beef in dark gravy with low fat cheese, garden tomatoes and wrapped in a low-fat flaky pastry.
- Chicken & Vegetable: Succulent chicken breast and garden vegetables in a creamy white sauce wrapped in low-fat flaky pastry.
- Butter Chicken: Chicken breast in a smooth, creamy Indian delight prepared in a low-fat flaky pastry.
- Cracked Pepper: Prime strips of beef in rich creamy sauce complimented with spicy cracked pepper corns.
- Beef, Bacon & Double Cheese: Lean beef in a rich gravy, creamy cheese sauce and slices of bacon wrapped in a low-fat flaky pastry.
- Steak & Cheese: Chunky steak in a rich hearty gravy with fresh herbs and spices, wrapped in a low-fat flaky pastry.
- Vegetarian: Garden vegetables prepared in a smooth creamy sauce and wrapped in a true light vegetable pastry.
Rolls & Savories: Sausage rolls, beef rolls, garlic and cheese rolls and small savories all wrapped in a low-fat flaky pastry.
Desserts & Fruit Pies: Low-fat lattice-top dessert pies in cherry, apple, apricot, custard, apple and a selection of cheese cakes.
Salads: Caesar Salad, Greek Salad, French Salad, Potato Salad, Fruit Salad.
Cold Beverages: Coke, Sprite, 7-Up, Carrot, Apple and Orange Juice, spring water, energy drinks.
Market Analysis Summary
The market we will engage in first is the downtown Yubetchatown district. Yubetchatown is centrally located in the Bigriver Valley, home to approximately 3.5 million people. It is an integral part of greater Megalopolis.
Yubetchatown is the seventh largest city in the state with a population of 84,560 and a geographic area of 29 square miles. With a growth rate of 8.5% Yubetchatown’s population is projected to grow well over 100,000 by 2008. It is anticipated that Yubetchatown will become the largest city in south Bigriver Valley.
Yubetchatown’s trade area consists of approximately 160,000 residents and is home to a diverse economic base including corporate offices, retail, industrial and manufacturing companies and one of the largest warehouse and distribution centers in North America.
The median household income in the Yubetchatown area is around $91,000 and the median age is 34 years old. Of the south Bigriver Valley population 13% are under 14, 14.5% are 15-24, 21.5 % are 25-34, 36% are 35-59 and 15% are over 60 years of age.
Demographically the UPer Crust Pie customer will come from all age and income levels of the market. Within this population we will focus on three separate groups with different needs: 15-24 year olds (including students), young adults and business people (25-34) and families with children under 14.
4.1 Market Segmentation
UPer Crust Pies intends to market to a wide customer base. However, we have defined the following groups as targeted segments that contribute to our growth projections:
- 15-24 Year Olds
- Young Adults and Businesspeople
- Families with Children
The largest target market is young adults and businesspeople. Our next largest market and the one with the greatest growth potential is families with children followed by the 15-24 year-old segment.

| Market Analysis | |||||||
| Year 1 | Year 2 | Year 3 | Year 4 | Year 5 | |||
| Potential Customers | Growth | CAGR | |||||
| 15-24 Year Olds | 2% | 80,662 | 82,275 | 83,921 | 85,599 | 87,311 | 2.00% |
| Young Adults and Businesspeople | 3% | 122,282 | 125,950 | 129,729 | 133,621 | 137,630 | 3.00% |
| Families with Children | 3% | 115,498 | 118,963 | 122,532 | 126,208 | 129,994 | 3.00% |
| Total | 2.75% | 318,442 | 327,188 | 336,182 | 345,428 | 354,935 | 2.75% |
4.2 Target Market Segment Strategy
15-24 year olds go out for fast food more than any other age group. They have disposable incomes which they tend to spend on immediate gratification items, especially food products they perceive to be unique, cosmopolitan or have an individuality value. Because these individuals are the most open to trying new foods they are vitally important in building an effective word-of-mouth marketing strategy.
Young adults and businesspeople have the potential of providing large volume sales to the company during the peak hours of 11 a.m. to 2 p.m. The lunch business is driven by individuals. Many go out to lunch to get out of the office setting or have business meetings at lunch either in or out of the office. We will endeavor to accommodate surrounding businesses placing phone-in orders for business meetings. Satisfaction of this group will provide a vital long-term revenue stream.
Families with children are a growing population, both numerically and in their choice for convenient foods. Two-income families have less time to prepare meals so they are an easy group to market to because their lifestyle is very specific. We will aggressively target single and working mothers who tend to turn to fast and convenient food choices to accommodate family demands. By targeting this group, we not only generate a large volume of immediate business, but also create long-term customers in their children.
Our downtown location and increasing customer base will probably draw in customers outside of our targeted groups to include visitors and downtown shoppers. We believe these customers will be glad to pay a reasonable price for our products in exchange for high quality, great taste and the uniqueness they receive.
4.3 Service Business Analysis
The United States Fast Food Industry
The U.S. has 277,208 fast-food outlets from coast to coast, that’s one for every 1,000 people. According to the U.S. department of Agriculture, consumption of food away from home accounted for 47% of total food expenditures in 2001, up from 45% in 1990 and 26% in 1960. The National Restaurant Association estimates that by 2010, total sales in the fast food industry will exceed $577 billion. At that time, consumers will spend 53% of every food dollar on meals, snacks and beverages away from home.
The strong demand for takeout food, prepared and packaged for busy customers to eat at home, should continue to grow solidly over the next few years, especially with a significant decline in the cost difference between dining out and cooking at home. The NPD Group, Inc.’s 2003 Consumer Spending Survey indicated the recent drop in the economy has encouraged more people to eat ‘on-the-go’ fast foods. Food on the run has now become the food of choice from executives to blue collar workers. According to Technomic Inc., a Chicago based research firm, take out sales accounted for 67% of total sales at the top 25 limited service chains.
The NPD 2003 Consumer Spending Survey also found that 18 to 34 year olds are turning towards new dining venues that are more likely to serve specialty foods like, sandwiches, Mexican wraps and home meal replacements instead of fried foods. NPD found that consumers frequenting these types of outlets are interested in higher quality food preparation and taste, better physical eating conditions and superior customer service, and are willing to pay a higher price.
Increases in income, especially when coupled with exposure to new and different foods, will stimulate Americans’ continuing quest for increased variety in their diets. Technomic Inc. suggests the most successful food companies in 2020 are likely to be those that tap most effectively into Americans’ appreciation for diversity in their lives, especially the insatiable desire for new and different food choices.
The United States Pie Industry
The U.S. Retailer’s Bakery Association stated in 2001 that bakeries will become the new springboard for successful retail meal programs. The Association believes there are unlimited opportunities for fresh pizza, quiche, pot pies, vegetable pies, soup, pasta and sandwiches.
According to the Bakery Production & Marketing Red Book, total U.S. fresh pie sales for 2003 were $204,567,600 compared to fresh pie sales in 2000 which totaled $182,602,096. Total U.S. frozen pie sales were $339,121,696 in 2003, a substantial increase when compared to 2000 sales of $141,488,000.
An estimated 70% of total pie sales in the U.S., including both frozen and fresh pies, are sweet pies. Although statistics complied by the American Institute of Baking stated that frozen pot pies contributed $68,705,000 to the total figure of $141,488,000 frozen pie sales in 2000.
An increase in consumer demand for the convenience of pot pies corresponds with U.S. consumer’s passion for meat and poultry. In 2002 total meat consumption (red meat, poultry and fish) reached 195 pounds per person, 57 pounds more than the average annual consumption in the 1950s. Each American consumed an average of 7 pounds more red meat than in the 1950s, 46 pounds more poultry and 4 pounds more fish and shellfish.
The Upper Peninsula Pie Industry
The pie is considered the national food of Michigan’s Upper Peninsula and the pie making business is a serious endeavor. Pie sales contributed substantially to the UP’s economy according to a statistics report in 2002.
UP brand Chequamegon is the present market leader in fresh pies with a 54.7% market share, well ahead of their closest competitor on 15% share. Chequamegon offers fresh single and multi-pack pies in as well as a range of sausage rolls and savories. Chequamegon also produces frozen family pies, single pies, frozen single sausage rolls and unbaked sausage rolls.
According to Rosemary Ontonagon, marketing manager for Chequamegon, frozen family pies and multi-pack pies are being used as convenient value-for-money family meal solutions. Single pies are purchased with snacking in mind, being a handy product for households to have on hand for hungry family members. Sausage rolls and savories are being used for more social occasions.
4.3.1 Competition and Buying Patterns
Within the restaurant and fast food industry there are several different segments:
- Fast food: McDonald’s, Burger King
- Pizza: delivery and dine in
- Buffets: all you can eat
- Lounges: combining food and alcohol
- Fine dining: typically restaurants at the highest price point
- Fast-casual: combination of fast service and sit down dining
Local Competitors
The Tintagel Pasty Company
The Tintagel Pasty Company has been operating since 1998. The company recently opened its second store, a small retail outlet on Bass Street in the heart of downtown which is supplied by their original store. The company is owned and operated by Anne Thracite, a Cornish woman with no previous baking or relevant industry experience.
Limited planning and organization have affected the company and there are no procedures or sufficient systems in place to deal with rapid expansion or substantial increases in production. The company is presently struggling to fulfill the demands of having a second retail outlet, regularly running out of product or unable to fulfill customer requests during peak times of the year. The quality of the company’s products can vary from week to week. Product is sometimes overcooked or very dry and equipment is not reliable. Product is sometimes baked twice and then sold frozen to customers in order to fulfill demands.
Business hours at the home store are 9:00 am to 5:30 pm Tuesday to Saturday and at Bass Street 10:00 am to 6:00 pm Monday to Sunday. Although the atmosphere is relaxed and inviting at both stores, a lack of seating has affected customer choice at the Bass Street location. Punch cards (buy nine get one free) have been adopted in the last two years and have aided in sales and repeat business. Customers include a variety of curious first timers and local business people. There is a strong expatriate base and loyal customer following at both stores. Of the customers that have entered both stores, one in 20 has enquired as to whether the company offers franchise opportunities.
The company’s products include six varieties of beef pie, three varieties of Chicken pie and one vegetable pie. Pies come in Lunch size (5 inch, $3.25 to $3.75), Family size (9 inch, $10.75) and Party size (2 inch, $10.00 per dozen). There are also spinach and sausage rolls ($2.50 each) and rotational weekly specials that include, Thai Curry Chicken, Indian Butter Chicken, plain Chicken, Ham and Brie, and Beef Stroganoff. Of the customers that have entered both stores, one in five has asked for sweet pies and desserts.
All product ingredients are presently bought by the owner and purchased at locally. Beverages are out-sourced and delivered weekly by Fizzy Beverage also locally based. Cornish dry foods sold through the store are imported by the owner through her brother in Falmouth, Cornwall, U.K.
The estimated gross profit for the company after the cost of goods in 2000 was $70,185, in 2001 $69,531, 2002 $82,029, in 2003 $100,729 and in 2004 around $132,353. Shipping of frozen product accounts for around 30% of the gross profit for each year. These figures show a healthy growth rate of over 20% in the last 3 years of business. Based on income and expenses over the last five years, wages have averaged between 25-30%, cost of goods around 20% and rent around 20%.
These figures do not take into account the gross profit of the new Bass Street store which started operations in late October 2004. Gross profit after three months of business at this store was $22,730. Based on the present growth rate and an influx of tourists during the summer months the annual gross profit of the Pike Street store alone is estimated to be between $90,000 and $100,000 gross.
The Quern Flour Bakery (Tidalborestad)
The Quern Flour Bakery is based in Tidalborestad, on the East Coast and has been operating since December 2003. Maltese owner and operator Siggiewi Gozo is a former corporate recruiter with an Masters Degree in Psychology who originally came to Tidalborestad for a job with a national sportswear company. He has no previous baking or relevant industry experience.
A one man shoe-string operation, Siggiewi works 15 hour days to make between 700 and 900 pies per week. In early 2004 Gozo was making and selling about 400 pies per month. In January of 2005 he sold 4,000 in bars and Irish pubs alone. Business is now good enough for him to take on extra staff and to scout a bigger location for the bakery. Currently he operates out of a rented nightclub kitchen after hours.
Quern Flour produces seven varieties for the Tidalborestad market, including steak and mushroom, beef and cheese and a shepherd’s pie. He also makes a breakfast egg and bacon pie and a sausage roll. He sells his pies to several midtown pubs, caters events around town and delivers by the dozen directly to customers’ homes by bicycle or subway. Quern Flour Bakery now offers overnight shipping via FedEx anywhere in the country.
The majority of his clientele hail from British Mediterranean areas. There are around 2,300 Maltese and Gibraltarian customers in Tidalborestad that make up the company’s customer base. Quern Flour supplies around six restaurants and pubs with frozen and hot pies within the Tidalborestad area. Gozo also caters for holiday parties and his pies were served at some consulates during morning tea in 2004.
All the ingredients considered carefully. The flagship ‘chunky steak’ pie is made from sirloin steak and all cuts of meat are inspected to make sure there is no gristle. To develop the perfect pie crust, Quern Flour Bakery sources special margarine directly from Malta.
Quern Flour Bakery pies retail for up to $5.00, and last year the company turned over $90,000 gross. Based on the current market Siggiewi Gozo expects the company to quadruple turnovers by 2005.
Buying Patterns
The most difficult function in predicting customer buying patterns is following the fine line of baking too much product or not having enough product left to serve customers late in the day. Despite implementing sophisticated POS systems that track hourly sales figures, there is no predictable pattern of daily activity. One Tuesday could be a sellout and the next Tuesday there could be pie warmers left full of product.
Despite customer unpredictability, buying patterns typically revolve around several different factors:
- Quality. The menu items must meet minimum levels of quality for people to be willing to spend money on the food, particularly when there are so many different options available.
- Location. Proximity to home or work is very important; so is convenient parking for the end-of-workday traffic stopping to pick up hot food to go or frozen meal solutions.
- Price. Low price or lowest price is not essential. Many customers associate low price with lower quality.
- Convenience. People tend to eat out because it’s quicker than preparing a meal themselves.
- Uniqueness. As consumers seek variety and new experiences, the challenge is to stand out from competitors, not only as an alternative fast food option, but as one that offers consistently high-quality food and a distinctive atmosphere.
Location
The proposed business location for the first UPer Crust store will be in downtown Yubetchatown. Five possible sites are being considered in three areas: the new Yubetchatown Station presently under construction, central downtown Yubetchatown, and the area of Chambers Street and 18th Avenue.
Each will need approximately 500-700 square feet. This area will include freezer space for on-site storage of frozen product. The operating space will consist of an oven, counter and serving area, pie warmers and ambient display cases, cold beverage display, an eating area and a restroom.
The stores will be located on high traffic commuter routes and close to shopping facilities in order to catch customers going to or from work, while they are out for lunch, or on a shopping expedition. The business will operate from Monday through Sunday. Hours of operation will depend entirely on the area and final location of each store.
5.1 Facilities and Equipment
Pie warmers are custom designed and manufactured display cases. Chilled and ambient display cases that house salads, desserts and cold beverages, uniform in design, will also be purchased. Commercial ovens, cash registers and point of sale (POS) accounting systems will be necessary capital asset acquisitions.
5.2 Suppliers and Alliances
UPer Crust Pies is in negotiations with two Michigan Upper Peninsula pie manufacturers to supply frozen pies, rolls and a small selection of dessert pies. It will establish a relationship with a reputable shipping company and a freight agent to aid in the smooth transition of product from the UP to our distribution center.
The company is also currently seeking reputable organizations to supply its stores with fresh salads and desserts on a daily basis, and will also establish contracts with a beverage company to provide popular product brands. Credit and delivery policies will be established; to avoid fluctuating costs the company will endeavor to build a fixed product rate into the contracts.
UPer Crust Pies wishes to establish long-term loyal relationships with its suppliers. Factors such as history, reliability, reputation, delivery system, service, product guarantees and liability issues will be crucial in the final decision. Due to the company’s expansion plans in years two and three, it is important that our suppliers have regional and possibly national coverage.
5.3 Inventory
Our imported products will be stored locally with a company that specializes in cold storage. Lead time for ordering, production, shipping and receiving is expected to be two months, although this will depend on sales volumes and product demand during the first year of business. This lead time will be reviewed constantly and altered in accordance with company expansion and seasonal demands.
Frozen and chilled pastries will be distributed to stores on a weekly basis, dependant on turnover, and will be kept frozen on site. Perishables such as salads and some desserts will be delivered fresh directly to our stores on a daily or two- to three-day schedule. Cold beverages will also be delivered directly to stores according to demand. A small back-up supply of products will also be kept on site.
5.4 Legal Environment
A submission of application for a food license to the State Department of Health will include prepared plans and specifications for review and approval before the construction or remodeling of the initial establishment. The application fee is $300.00.
The State Department of Health will conduct one or more pre-operational inspections to verify that the establishment is constructed and equipped in accordance with the approved plans and in compliance with the Food Code.
The State Department of Health also requires that each employee possess a Food Handlers Permit. This permit is $10.00 and is obtained after a simple exam.
The company will adhere to the State Department of Health and U.S. Food and Drug Administration Food Code standards. An appropriate insurance policy will also be taken out in accordance with State Department of Health regulations.
5.5 Policies and Procedures
Establishing company policies and procedures will be important the company’s growth and employee development. The following policies and procedures will be adopted:
- Development of an employee policy handbook
- Development of a company procedures and systems handbook
- Clearly defined employee job descriptions, training, reviews and monthly meetings
- An open-door policy for employee suggestions and concerns
The company’s credit policy will be to accept only cash, Visa or MasterCard credit cards.
Strategy and Implementation Summary
UPer Crust Pies will penetrate the commuter and captive consumer markets by setting up stores in highly visible and accessible locations. With the proliferation of coffee and fast-food chains across America, customers expect product consistency. Although our unique products will initially captivate a curious market and compete on a consistency level, it will be our fast and cheerful customer service that will differentiate us from competitors and keep our customers returning.
UPer Crust Pies has identified its market as busy, mobile people whose time is already at a premium. This market desires exciting, new-tasting products with familiar ingredients for lunch time or while commuting to or from work or school.
Strategic Assumptions:
- Every resident in the greater Yubetchatown area is a potential customer.
- Each location gives us an opportunity to increase customer awareness.
- Marketing to our target segments will expose us to additional new customers.
6.1 Competitive Edge
UPer Crust Pies’ unique products and focus on the customers experience will give it a significant market edge and differentiate the company from its competitors.
The company has several distinct advantages over its two leading competitors; its authentic products, modern baking and presentation equipment, and the latest operating systems and technology.
A fast and unique food alternative: We offer our customers a completely new experience through our pies, pastries, salads and desserts. The look, feel and taste of our products when compared to the competition will initially establish a sense of curiosity, followed by a value for money reputation and eventually a loyal following of pie lovers and connoisseurs.
Products are made from the finest quality ingredients and are low in fat and free of genetically modified foods. Many products, such as the authentic Upper Peninsula pies, will not be available anywhere else.
Our products will be served fast and ready to consume and will be an alternative to the usual fast-food options available in today’s market.
The importance of the experience: With so many fast food restaurants and prepared foods being offered at grocery markets, the customer experience becomes extremely important as an effective way of distinguishing offerings. It is this experience that remains in the customer’s mind well after they have consumed their food. This memory is what is communicated to their friends and colleagues.
We realize that our business is a lot more than just pies. It’s our pies, our people and the experience the customers have in our stores. The store environment will play a major role in a positive customer experience. The cleanliness, smoke-free environment, color scheme and nostalgic Upper Peninsula/Great Lakes images will create a completely new experience.
6.2 Marketing Strategy
The focus of our marketing strategy will be to attract new customers, educate those customers and create a loyal base. Our goal is to be known as a unique food experience with superior customer service.
The following marketing strategies will be employed in the first year of business:
Signage: Highly visible, eye catching and recognizable signs and logos at each store.
Print media advertising: Weekly and monthly food and dining out guides will be used for print advertising.
Flyers: Distributed to local businesses to create customer awareness, accompanied with buy-one get one-free coupons during our Grand Opening.
Entertainment book coupons: Create initial customer awareness and economic incentive to try our products. The effectiveness of these books diminishes after approximately eight months and UPer Crust Pies will turn to more cost effective marketing.
Word of mouth: Unsurpassed customer service and our unique products will help develop strong word-of-mouth advertising and in turn help extend the company brand.
Alliances: Although the company is primarily in the fast-food industry, it’s unique products and cultural origins could be used as a tourism vehicle to promote the Upper Peninsula through a strategic alliance with Michigan Tourism.
6.3 Sales Strategy
We intend to succeed by giving our customers a combination of delicious food in an appealing environment with outstanding customer service. Once a customer enters our store, it is our job to make sure their experience with us is enjoyable. To establish a loyal customer base, it is vitally important we develop repeat business.
Our pies will be cooked throughout the day, ensuring they can be served with confidence while guaranteeing our customers supreme freshness and taste. We will also offer fresh baked samples free of charge to those who enter our store for the first time.
We need to offer fast service at peak times. To speed up customer service, at least two employees will be servicing customers. One employee will be preparing the customer’s order, the other one will be taking care of the sales transaction. All sales data logged on our computerized POS system will be analyzed for marketing purposes.
We will offer punch cards, meal deals and weekly menu specials and keep accurate track of what types of pies and associated foods sell well through a customer feedback program. With this information we will be able to streamline our food line to match local tastes and encourage more people to eat at the pie shop.
We need to sell the company as well as the product. All employees will go through a comprehensive training process on how to offer customers the finest experience. Employees will be empowered to resolve issues and are encouraged to seek assistance from managers for any conflicts they are unable to resolve.
Part of our mission is to educate our customers about pies. However, this must be done in a respectful fashion. Our knowledge is a resource, and must never be used to make a customer feel uncomfortable or ignorant.
In the first year of business we will implement a Point-of-Sale (POS) computerized cash register system that will make tracking and managing receipts and charitable contributions more robust. We will seek a professional who has experience in how to tie in POS systems to the Internet and inventory controls. This individual’s knowledge will also help establish technology guidelines for the company.
Our sales strategy requires consistently high quality food and fast service in a relaxed atmosphere. We can accomplish this by:
- Hiring employees who appreciate our unique products.
- Continually assessing the quality of all aspects of the business and immediately addressing any issues.
- Interacting with our customers personally, so they know that their feedback goes directly to the owners.
- Evaluating food choices and keeping favorites on the menu as we rotate weekly and seasonal specials.
6.3.1 Sales Forecast
Our sales forecast shows modest estimates for the first year of operations beginning in July 2005. Cost control is a critical focus for UPer Crust Pies. Because we are importing our product from Michigan, we will negotiate a flat purchase price for the first three years of business to compensate for fluctuating economic conditions. We have projected a 60% gross mark up over the first three years of business. Keeping costs low while increasing sales will be vital to the company’s profitability in subsequent years.
UPer Crust Pies envisions the first three months of sales to be fairly slow due to limited product awareness, the competitive nature of the market and existing customer loyalty. We have therefore forecasted a 5% growth rate over the first year. In the second year, UPer Crust Pies will add two more stores and in the third year, an additional two stores. The addition of these stores will nearly triple the gross revenue in the second year and increase half again as much in the third year. Compared to industry standards we have taken a very conservative 10% growth rate over the first three years of operations.
Not projected in this sales forecast is the possibility of additional revenue generated from shipping via an e-commerce facility to be added to our website in year two. Based on current market research, shipping could be a significant profit center. We would sell frozen products that could be shipped overnight via DHL or FedEx to customers throughout the U.S. Shipping would also become an integral part of the company’s marketing plan to help develop brand recognition and build product awareness.
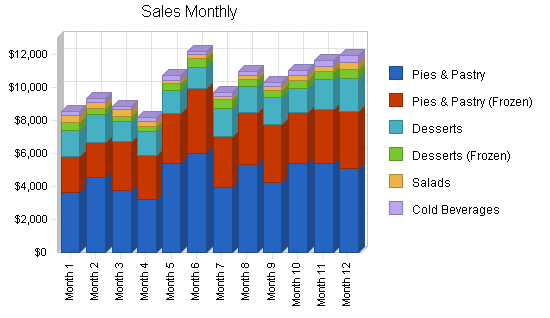
We understand product sales will also vary according to the season. Dessert and salad sales in the summer months are expected to be slightly higher since more people will be having barbecues and picnics requiring ad-on products. Pie and pastry sales should be higher in winter because of food oriented holidays and pies tend to be viewed as a comfort food. It is anticipated that sales of sodas during the summer months should be substantially higher.
Please note that the sales forecast for the first year reflects store number one at a 5% growth rate. In the second year, the forecast reflects the combined sales of three stores at a 10% growth rate, and in the third year, the combined sales of five stores at a 10% growth rate.
| Sales Forecast | |||
| Year 1 | Year 2 | Year 3 | |
| Sales | |||
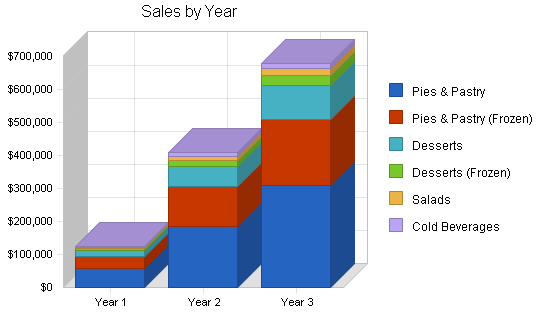
| Pies & Pastry | $56,149 | $185,298 | $308,820 |
| Pies & Pastry (Frozen) | $36,531 | $120,552 | $200,921 |
| Desserts | $18,726 | $61,796 | $102,993 |
| Desserts (Frozen) | $5,444 | $17,965 | $29,942 |
| Salads | $3,586 | $11,834 | $19,723 |
| Cold Beverages | $3,154 | $10,408 | $17,347 |
| Total Sales | $123,589 | $407,853 | $679,746 |
| Direct Cost of Sales | Year 1 | Year 2 | Year 3 |
| Pies & Pastry | $19,652 | $61,904 | $103,173 |
| Pies & Pastry (Frozen) | $12,786 | $40,276 | $67,127 |
| Desserts | $6,554 | $20,645 | $34,409 |
| Desserts (Frozen) | $1,905 | $6,001 | $10,001 |
| Salads | $1,255 | $3,953 | $6,589 |
| Cold Beverages | $1,104 | $3,478 | $5,796 |
| Subtotal Direct Cost of Sales | $43,256 | $136,257 | $227,095 |
Web Plan Summary
In the first year of operation UPer Crust Pies will establish a basic Internet presence. The website will be a virtual business card and portfolio for the company with a simple yet contemporary design to keep up with the latest trends in user interface. The site will have general information about the company, its products, prices, store locations, hours of operation and contact information.
In year two, the company will launch an e-commerce facility for customer ordering and shipping of frozen products throughout the U.S.
7.1 Website Marketing Strategy
Marketing efforts will start with our existing brick-and-mortar store customer base, informing them of our Internet presence and encouraging their word-of-mouth recommendations. Further awareness will be heightened by utilizing search engine submissions, URL links and e-mail marketing.
The company website and email address will be referenced on all printed material and correspondence including menus, business cards and advertising media.
The launching of our e-commerce facility for shipping in year two will also be marketed in our stores through word of mouth and on all printed media. Expansion into outside sales will help us to create greater community awareness.
7.2 Development Requirements
Development Costs
- Site design: $1000 – $2,000.
- Website name registration for www.UPerCrustPies.com is $149.00 for 10 years.
- Site implementation: UPer Crust Pies will utilize the programming services of a friend with 12 years of experience in software development, including custom programming, data management and Web development.
Ongoing Costs
- Site hosting: $19.95 per month. Includes 250 MB Disk Space, 10 GB Data transfer and 20 POP e-mailboxes. (Year 1)
- Fully integrated e-commerce site hosting: $99.95 per month. Includes 5,000 MB Disk Space, 200 GB Data transfer and 200 POP e-mailboxes, storefront and shopping cart, secure online credit card processing and payment options. (Year 2)
- Search engine submission: $44.95 per month. Guaranteed placement in Google and Yahoo! (Year 2)
- Site design changes: Free of charge; however, material for changes such as photography, new logos or designs may incur a fee but will be considered part of the marketing budget.
Management Summary
The strength of our management team positions us for success. We have assembled a team that embraces different disciplines with expertise in all areas of the business. Overhead for management will be kept to a minimum and initially all managers will be hands-on workers. There is no intention of having a top-heavy organization that drains profits and complicates decisions.
UPer Crust Pies’ management style will encourage all employees to learn as much as possible about all aspects of the business and be involved in decision making where appropriate. The company respects its community of co-workers, and will treat all workers well. It is important to us that they enjoy their jobs, feel part of the company and are well rewarded for their work.
In addition to the day-to-day operations, the management team, as principals within the company, will oversee product development, purchasing, positioning, pricing, inventory control and approval of all financial obligations of the company. They will plan, develop, and establish customer service policies and objectives, write employee job descriptions and draft an employee manual for all employee-related policies. They will:
- Manage working capital, including receivables, inventory and cash.
- Perform financial forecasting, budgeting, cash flow analysis and external financing requirements.
- Prepare financial analyses for guiding management, including income and expense reports.
- Prepare budgets and financial forecasts and arrange for audits of the company’s accounts.
8.1 Management Team
Lina Mackinac-Gogebic, CEO – Accounting, Marketing, Legal, Human Resources
Confidential and proprietary information removed from this sample plan.
Olie Mackinac-Gogebic, COO – Operations, Marketing, Financial, Business Development
Confidential and proprietary information removed from this sample plan.
Misty Glade – Vendor Relationships, Sales, Recruitment, Training
Confidential and proprietary information removed from this sample plan.
Full Time Employee – Operations, Inventory, Store Development
Confidential and proprietary information removed from this sample plan.
Advisory Board
Confidential and proprietary information removed from this sample plan.
8.2 Personnel Plan
UPer Crust Pies will be slow to hire people in the first year of operation, but very loyal to those who are hired. Initially all employees will be part time as the majority of work will be done by the owner. As the company grows, we intend to hire employees with relevant skills and reward them accordingly. From that point, we intend to increase the responsibilities of each employee as opposed to hiring more people.
Retail and restaurant businesses live or die on customer service, yet their employees have among the lowest pay and worst benefits of any industry. We know we have great products, but it’s the way those products are delivered that will determine our success. We realize that our employees are our biggest asset and that the image of our company is built by the people who work for us.
Compensation for employees will include direct monetary payments and as the business progresses, performance bonuses will be paid to full-time employees. Because this is a small business, employees will be paid a comfortable wage that is fair to both the employees and the business.
Our opening employment goal is one full-time and one part-time employee with an additional two full-time and three part-time employees by the end of the second year. All employees with be trained in food handling and store procedures and will be required to hold a food handlers permit.
Our employee policies will include:
- Weekly management meetings
- Monthly employee meetings
- On-going training
- Performance reviews every six months
- Performance incentives
- Encouragement of creativity
| Personnel Plan | |||
| Year 1 | Year 2 | Year 3 | |
| Olie Mackinac-Gogebic | $27,040 | $27,040 | $29,120 |
| Misty Glade | $0 | $27,040 | $29,140 |
| Full-time Employee 1 | $0 | $27,040 | $27,040 |
| Lina Mackinac-Gogebic | $0 | $0 | $0 |
| Full-time Employee 2 | $0 | $0 | $24,960 |
| Full-time Employee 3 | $0 | $0 | $24,960 |
| Part-time Employee 1 | $7,000 | $7,000 | $9,000 |
| Part-time Employee 2 | $0 | $7,000 | $9,000 |
| Part-time Employee 3 | $0 | $7,000 | $9,000 |
| Name or Title or Group | $0 | $0 | $0 |
| Total People | 2 | 6 | 8 |
| Total Payroll | $34,040 | $102,120 | $162,220 |
Financial Plan
A bank relationship will be established as soon as possible. Sales could very well increase at a much sharper rate than assumed in these conservative projections. Sharper sales will result in a greater need for funds in support of inventory and store growth and a line of credit will need to be established.
We will set a budget for marketing and advertising and will continue to reinvest residual profits into company expansion and personnel.
Sales growth will be aggressive during the first 18 months as we sharpen our product line and inventory to better meet our customer’s requirements. Although we anticipate substantial growth in years two and three we are forecasting a very conservative 10% growth rate.
- Salaries and rent are two major expenses. Depreciation will also increase as the company develops.
- The owners will not take any profits out of the business and will be paid as an employees.
- Payoff of private investment is expected within four to five years.
9.1 Start-up Funding
Total startup funding amounts are shown in the table below. This includes initial start-up expenses, liquid cash for operating expenses, unforseen expenses, to help cover wages, and also includes start-up inventory. This inventory will include the purchase and storage costs of frozen products, purchasing of cold beverages and daily delivery of fresh salads and various other desserts.
The purchase of long-term assets that will include an oven, two pie warmers, an ambient display case, freezers and refrigerators, a dishwasher and microwave, a three-compartment sink, decor and furnishings, utensils, a cash register and Point-Of-Sale software and accessories.
A long-term loan has been secured for the purchase of the long-term assets.
A first round of private investment from outside investors and family members will begin in April 2005. A second round will commence at the end of April 2006 for the purchase of further inventory and long-term assets to service the next two stores.
Profits will be reinvested and the owners will be employees collecting a very modest wage. This will ensure that any operating debts incurred are paid for within the shortest possible time period.
| Start-up Funding | |
| Start-up Expenses to Fund | $45,000 |
| Start-up Assets to Fund | $195,000 |
| Total Funding Required | $240,000 |
| Assets | |
| Non-cash Assets from Start-up | $77,000 |
| Cash Requirements from Start-up | $118,000 |
| Additional Cash Raised | $0 |
| Cash Balance on Starting Date | $118,000 |
| Total Assets | $195,000 |
| Liabilities and Capital | |
| Liabilities | |
| Current Borrowing | $0 |
| Long-term Liabilities | $170,000 |
| Accounts Payable (Outstanding Bills) | $0 |
| Other Current Liabilities (interest-free) | $0 |
| Total Liabilities | $170,000 |
| Capital | |
| Planned Investment | |
| Investor 1 | $8,000 |
| Investor 2 | $8,000 |
| Investor 3 | $8,000 |
| Investor 4 | $8,000 |
| Investor 5 | $8,000 |
| Investor 6 | $10,000 |
| Investor 7 | $10,000 |
| Investor 8 | $10,000 |
| Additional Investment Requirement | $0 |
| Total Planned Investment | $70,000 |
| Loss at Start-up (Start-up Expenses) | ($45,000) |
| Total Capital | $25,000 |
| Total Capital and Liabilities | $195,000 |
| Total Funding | $240,000 |
9.2 Important Assumptions
Payroll burden is calculated at an estimated 12.65% made up of 7.65% for social security and medicare, 2% for unemployment, and 3% for worker’s compensation.
The tax rate has been left at 0% in the first year plan due to accumulated losses carried forward and that as an LLC the the owners will be taxed personally.
Our long-term interest rate is 6%.
Our State Sales tax is 4%. This does not affect our total profitability, but monthly payments to the State does impact our cash flow and cash balance.
Our financial plan depends on important assumptions. Our key underlying assumptions are:
- A slow-growth economy without major recession.
- There are no unforeseen changes in public health perceptions of our general products.
- Access to sufficient capital to sustain the company’s projected growth plan.
9.3 Break-even Analysis
Our break-even analysis is summarized by the following chart and table.

| Break-even Analysis | |
| Monthly Revenue Break-even | $10,862 |
| Assumptions: | |
| Average Percent Variable Cost | 35% |
| Estimated Monthly Fixed Cost | $7,060 |
9.4 Projected Profit and Loss
The following table and charts indicate projected profit and loss.


| Pro Forma Profit and Loss | |||
| Year 1 | Year 2 | Year 3 | |
| Sales | $123,589 | $407,853 | $679,746 |
| Direct Cost of Sales | $43,256 | $136,257 | $227,095 |
| Other Costs of Sales | $0 | $0 | $0 |
| Total Cost of Sales | $43,256 | $136,257 | $227,095 |
| Gross Margin | $80,333 | $271,596 | $452,651 |
| Gross Margin % | 65.00% | 66.59% | 66.59% |
| Expenses | |||
| Payroll | $34,040 | $102,120 | $162,220 |
| Marketing/Promotion | $3,000 | $9,000 | $15,000 |
| Depreciation | $9,285 | $9,285 | $9,285 |
| Rent | $24,000 | $72,000 | $120,000 |
| Utilities | $2,700 | $8,100 | $13,500 |
| Liability insurance | $2,400 | $7,200 | $12,000 |
| Payroll Taxes | $0 | $0 | $0 |
| Legal fees | $0 | $0 | $0 |
| Accounting | $1,200 | $3,600 | $6,000 |
| Bank Service Charges | $1,500 | $5,000 | $7,000 |
| Telephone/Cell Phone | $900 | $1,500 | $2,100 |
| License and Permits | $500 | $1,500 | $2,500 |
| Cold Storage | $2,500 | $6,000 | $12,000 |
| Office Supplies | $500 | $1,000 | $2,000 |
| Repairs and Maintenance | $1,000 | $2,500 | $6,000 |
| Gas/Auto Expenses | $1,000 | $2,000 | $5,000 |
| Postage | $200 | $400 | $1,200 |
| Total Operating Expenses | $84,725 | $231,205 | $375,805 |
| Profit Before Interest and Taxes | ($4,392) | $40,391 | $76,846 |
| EBITDA | $4,893 | $49,676 | $86,131 |
| Interest Expense | $9,810 | $9,060 | $8,160 |
| Taxes Incurred | $0 | $9,399 | $0 |
| Net Profit | ($14,202) | $21,932 | $68,686 |
| Net Profit/Sales | -11.49% | 5.38% | 10.10% |
9.5 Projected Cash Flow
Our projected cash flow is outlined in the following chart and table.

| Pro Forma Cash Flow | |||
| Year 1 | Year 2 | Year 3 | |
| Cash Received | |||
| Cash from Operations | |||
| Cash Sales | $123,589 | $407,853 | $679,746 |
| Subtotal Cash from Operations | $123,589 | $407,853 | $679,746 |
| Additional Cash Received | |||
| Sales Tax, VAT, HST/GST Received | $4,944 | $16,314 | $27,190 |
| New Current Borrowing | $0 | $0 | $0 |
| New Other Liabilities (interest-free) | $0 | $0 | $0 |
| New Long-term Liabilities | $0 | $0 | $0 |
| Sales of Other Current Assets | $0 | $0 | $0 |
| Sales of Long-term Assets | $0 | $0 | $0 |
| New Investment Received | $0 | $60,000 | $60,000 |
| Subtotal Cash Received | $128,533 | $484,167 | $766,936 |
| Expenditures | Year 1 | Year 2 | Year 3 |
| Expenditures from Operations | |||
| Cash Spending | $34,040 | $102,120 | $162,220 |
| Bill Payments | $89,311 | $294,893 | $461,222 |
| Subtotal Spent on Operations | $123,351 | $397,013 | $623,442 |
| Additional Cash Spent | |||
| Sales Tax, VAT, HST/GST Paid Out | $4,466 | $16,314 | $27,190 |
| Principal Repayment of Current Borrowing | $0 | $0 | $0 |
| Other Liabilities Principal Repayment | $0 | $0 | $0 |
| Long-term Liabilities Principal Repayment | $12,000 | $14,000 | $16,000 |
| Purchase Other Current Assets | $0 | $0 | $0 |
| Purchase Long-term Assets | $65,000 | $30,000 | $30,000 |
| Dividends | $0 | $0 | $0 |
| Subtotal Cash Spent | $204,817 | $457,327 | $696,631 |
| Net Cash Flow | ($76,284) | $26,840 | $70,304 |
| Cash Balance | $41,716 | $68,556 | $138,861 |
9.6 Projected Balance Sheet
The following table explains the projected balance sheet.
| Pro Forma Balance Sheet | |||
| Year 1 | Year 2 | Year 3 | |
| Assets | |||
| Current Assets | |||
| Cash | $41,716 | $68,556 | $138,861 |
| Inventory | $16,744 | $52,744 | $87,906 |
| Other Current Assets | $0 | $0 | $0 |
| Total Current Assets | $58,460 | $121,300 | $226,767 |
| Long-term Assets | |||
| Long-term Assets | $130,000 | $160,000 | $190,000 |
| Accumulated Depreciation | $9,285 | $18,570 | $27,855 |
| Total Long-term Assets | $120,715 | $141,430 | $162,145 |
| Total Assets | $179,175 | $262,730 | $388,912 |
| Liabilities and Capital | Year 1 | Year 2 | Year 3 |
| Current Liabilities | |||
| Accounts Payable | $9,899 | $25,522 | $39,018 |
| Current Borrowing | $0 | $0 | $0 |
| Other Current Liabilities | $478 | $478 | $478 |
| Subtotal Current Liabilities | $10,376 | $26,000 | $39,496 |
| Long-term Liabilities | $158,000 | $144,000 | $128,000 |
| Total Liabilities | $168,376 | $170,000 | $167,496 |
| Paid-in Capital | $70,000 | $130,000 | $190,000 |
| Retained Earnings | ($45,000) | ($59,202) | ($37,270) |
| Earnings | ($14,202) | $21,932 | $68,686 |
| Total Capital | $10,798 | $92,730 | $221,416 |
| Total Liabilities and Capital | $179,175 | $262,730 | $388,912 |
| Net Worth | $10,798 | $92,730 | $221,416 |
9.7 Business Ratios
Projected business ratios are provided in the table below. The final column, Industry Profile, shows ratios for the Fast-Food Restaurant, Independent industry, as determined by the Standard Industry Classification (SIC) Index code 7999.
| Ratio Analysis | ||||
| Year 1 | Year 2 | Year 3 | Industry Profile | |
| Sales Growth | 0.00% | 230.01% | 66.66% | 8.67% |
| Percent of Total Assets | ||||
| Inventory | 9.35% | 20.08% | 22.60% | 3.24% |
| Other Current Assets | 0.00% | 0.00% | 0.00% | 37.31% |
| Total Current Assets | 32.63% | 46.17% | 58.31% | 45.97% |
| Long-term Assets | 67.37% | 53.83% | 41.69% | 54.03% |
| Total Assets | 100.00% | 100.00% | 100.00% | 100.00% |
| Current Liabilities | 5.79% | 9.90% | 10.16% | 17.94% |
| Long-term Liabilities | 88.18% | 54.81% | 32.91% | 22.26% |
| Total Liabilities | 93.97% | 64.71% | 43.07% | 40.20% |
| Net Worth | 6.03% | 35.29% | 56.93% | 59.80% |
| Percent of Sales | ||||
| Sales | 100.00% | 100.00% | 100.00% | 100.00% |
| Gross Margin | 65.00% | 66.59% | 66.59% | 59.05% |
| Selling, General & Administrative Expenses | 76.49% | 61.21% | 56.49% | 39.24% |
| Advertising Expenses | 7.51% | 0.00% | 0.00% | 1.96% |
| Profit Before Interest and Taxes | -3.55% | 9.90% | 11.31% | 1.92% |
| Main Ratios | ||||
| Current | 5.63 | 4.67 | 5.74 | 1.04 |
| Quick | 4.02 | 2.64 | 3.52 | 0.66 |
| Total Debt to Total Assets | 93.97% | 64.71% | 43.07% | 50.22% |
| Pre-tax Return on Net Worth | -131.51% | 33.79% | 31.02% | 6.90% |
| Pre-tax Return on Assets | -7.93% | 11.93% | 17.66% | 13.87% |
| Additional Ratios | Year 1 | Year 2 | Year 3 | |
| Net Profit Margin | -11.49% | 5.38% | 10.10% | n.a |
| Return on Equity | -131.51% | 23.65% | 31.02% | n.a |
| Activity Ratios | ||||
| Inventory Turnover | 2.78 | 3.92 | 3.23 | n.a |
| Accounts Payable Turnover | 10.02 | 12.17 | 12.17 | n.a |
| Payment Days | 27 | 21 | 25 | n.a |
| Total Asset Turnover | 0.69 | 1.55 | 1.75 | n.a |
| Debt Ratios | ||||
| Debt to Net Worth | 15.59 | 1.83 | 0.76 | n.a |
| Current Liab. to Liab. | 0.06 | 0.15 | 0.24 | n.a |
| Liquidity Ratios | ||||
| Net Working Capital | $48,083 | $95,300 | $187,271 | n.a |
| Interest Coverage | -0.45 | 4.46 | 9.42 | n.a |
| Additional Ratios | ||||
| Assets to Sales | 1.45 | 0.64 | 0.57 | n.a |
| Current Debt/Total Assets | 6% | 10% | 10% | n.a |
| Acid Test | 4.02 | 2.64 | 3.52 | n.a |
| Sales/Net Worth | 11.45 | 4.40 | 3.07 | n.a |
| Dividend Payout | 0.00 | 0.00 | 0.00 | n.a |
Risk Management
New restaurants and fast-food outlets often make one of two mistakes: they are either unprepared or under prepared for opening. Initial poor service or product quality discourages customers from returning. Many first businesses spend all of their efforts at opening and are unable to maintain the quality customers expect on return visits, decreasing word-of-mouth advertising and leading to poor revenues.
UPer Crust Pies will be as prepared as it can possibly be with back–up equipment, alternative suppliers and at least three month’s inventory of frozen product.
Initial costs will be planned accordingly and kept to a minimum. The company recognizes the importance of its image, first-time impressions and customer service and it will not sacrifice this in order to satisfy the bottom line.
It is anticipated that marketing costs will be significantly higher in the first three months of business. Marketing activities will be closely monitored and constantly analyzed to decide what marketing activities are successful and what are not. A marketing budget will be set for the first store and for each subsequent store.
UPer Crust Pies will establish a loyal and long-term relationship with our suppliers and always pay on time. We wish to establish fixed-product rates with our suppliers as a buffer to avoid fluctuating economic conditions that may affect our purchasing capabilities.
Changes in importation policies and health regulations will always affect UPer Crust Pies. We need to establish a strong working relationship with the relevant authorities to ensure all procedures are followed correctly and ensure that we have a steady supply of product.
Because our products are unknown to the general consumer, marketing activities are vitally important. We plan on implementing several marketing strategies as outlined in the marketing section of this business plan. To establish product and brand awareness, we will give-away small samples to encourage first timers to try our products. Although we have quality products, building a loyal customer base will take time. We realize that training and empowerment of our employees will be reflected in their customer service and that word-of-mouth advertising will be paramount to our success.
Appendix
| Sales Forecast | |||||||||||||
| Month 1 | Month 2 | Month 3 | Month 4 | Month 5 | Month 6 | Month 7 | Month 8 | Month 9 | Month 10 | Month 11 | Month 12 | ||
| Sales | |||||||||||||
| Pies & Pastry | 5% | $3,644 | $4,559 | $3,772 | $3,208 | $5,426 | $6,020 | $3,934 | $5,360 | $4,234 | $5,426 | $5,435 | $5,131 |
| Pies & Pastry (Frozen) | 5% | $2,208 | $2,100 | $2,976 | $2,685 | $3,024 | $3,930 | $3,114 | $3,168 | $3,546 | $3,103 | $3,258 | $3,421 |
| Desserts | 5% | $1,536 | $1,707 | $1,213 | $1,442 | $1,392 | $1,299 | $1,730 | $1,548 | $1,625 | $1,451 | $1,792 | $1,992 |
| Desserts (Frozen) | 5% | $504 | $396 | $331 | $347 | $397 | $551 | $514 | $422 | $443 | $465 | $489 | $585 |
| Salads | 5% | $413 | $360 | $370 | $292 | $235 | $206 | $188 | $232 | $230 | $322 | $321 | $418 |
| Cold Beverages | 5% | $263 | $212 | $198 | $208 | $254 | $196 | $246 | $253 | $279 | $279 | $365 | $399 |
| Total Sales | $8,568 | $9,334 | $8,859 | $8,183 | $10,729 | $12,201 | $9,726 | $10,983 | $10,356 | $11,046 | $11,659 | $11,946 | |
| Direct Cost of Sales | Month 1 | Month 2 | Month 3 | Month 4 | Month 5 | Month 6 | Month 7 | Month 8 | Month 9 | Month 10 | Month 11 | Month 12 | |
| Pies & Pastry | $1,638 | $1,638 | $1,638 | $1,638 | $1,638 | $1,638 | $1,638 | $1,638 | $1,638 | $1,638 | $1,638 | $1,638 | |
| Pies & Pastry (Frozen) | $1,066 | $1,066 | $1,066 | $1,066 | $1,066 | $1,066 | $1,066 | $1,066 | $1,066 | $1,066 | $1,066 | $1,066 | |
| Desserts | $546 | $546 | $546 | $546 | $546 | $546 | $546 | $546 | $546 | $546 | $546 | $546 | |
| Desserts (Frozen) | $159 | $159 | $159 | $159 | $159 | $159 | $159 | $159 | $159 | $159 | $159 | $159 | |
| Salads | $105 | $105 | $105 | $105 | $105 | $105 | $105 | $105 | $105 | $105 | $105 | $105 | |
| Cold Beverages | $92 | $92 | $92 | $92 | $92 | $92 | $92 | $92 | $92 | $92 | $92 | $92 | |
| Subtotal Direct Cost of Sales | $3,605 | $3,605 | $3,605 | $3,605 | $3,605 | $3,605 | $3,605 | $3,605 | $3,605 | $3,605 | $3,605 | $3,605 | |
| Personnel Plan | |||||||||||||
| Month 1 | Month 2 | Month 3 | Month 4 | Month 5 | Month 6 | Month 7 | Month 8 | Month 9 | Month 10 | Month 11 | Month 12 | ||
| Olie Mackinac-Gogebic | 0% | $2,253 | $2,253 | $2,253 | $2,253 | $2,253 | $2,253 | $2,253 | $2,253 | $2,253 | $2,253 | $2,253 | $2,253 |
| Misty Glade | 0% | $0 | $0 | $0 | $0 | $0 | $0 | $0 | $0 | $0 | $0 | $0 | $0 |
| Full-time Employee 1 | 0% | $0 | $0 | $0 | $0 | $0 | $0 | $0 | $0 | $0 | $0 | $0 | $0 |
| Lina Mackinac-Gogebic | 0% | $0 | $0 | $0 | $0 | $0 | $0 | $0 | $0 | $0 | $0 | $0 | $0 |
| Full-time Employee 2 | 0% | $0 | $0 | $0 | $0 | $0 | $0 | $0 | $0 | $0 | $0 | $0 | $0 |
| Full-time Employee 3 | 0% | $0 | $0 | $0 | $0 | $0 | $0 | $0 | $0 | $0 | $0 | $0 | $0 |
| Part-time Employee 1 | 0% | $583 | $583 | $583 | $583 | $583 | $583 | $583 | $583 | $583 | $583 | $583 | $583 |
| Part-time Employee 2 | 0% | $0 | $0 | $0 | $0 | $0 | $0 | $0 | $0 | $0 | $0 | $0 | $0 |
| Part-time Employee 3 | 0% | $0 | $0 | $0 | $0 | $0 | $0 | $0 | $0 | $0 | $0 | $0 | $0 |
| Name or Title or Group | 0% | $0 | $0 | $0 | $0 | $0 | $0 | $0 | $0 | $0 | $0 | $0 | $0 |
| Total People | 2 | 2 | 2 | 2 | 2 | 2 | 2 | 2 | 2 | 2 | 2 | 2 | |
| Total Payroll | $2,837 | $2,837 | $2,837 | $2,837 | $2,837 | $2,837 | $2,837 | $2,837 | $2,837 | $2,837 | $2,837 | $2,837 | |
| Pro Forma Profit and Loss | |||||||||||||
| Month 1 | Month 2 | Month 3 | Month 4 | Month 5 | Month 6 | Month 7 | Month 8 | Month 9 | Month 10 | Month 11 | Month 12 | ||
| Sales | $8,568 | $9,334 | $8,859 | $8,183 | $10,729 | $12,201 | $9,726 | $10,983 | $10,356 | $11,046 | $11,659 | $11,946 | |
| Direct Cost of Sales | $3,605 | $3,605 | $3,605 | $3,605 | $3,605 | $3,605 | $3,605 | $3,605 | $3,605 | $3,605 | $3,605 | $3,605 | |
| Other Costs of Sales | $0 | $0 | $0 | $0 | $0 | $0 | $0 | $0 | $0 | $0 | $0 | $0 | |
| Total Cost of Sales | $3,605 | $3,605 | $3,605 | $3,605 | $3,605 | $3,605 | $3,605 | $3,605 | $3,605 | $3,605 | $3,605 | $3,605 | |
| Gross Margin | $4,963 | $5,729 | $5,254 | $4,578 | $7,124 | $8,597 | $6,121 | $7,378 | $6,751 | $7,441 | $8,054 | $8,341 | |
| Gross Margin % | 57.93% | 61.38% | 59.31% | 55.95% | 66.40% | 70.46% | 62.94% | 67.18% | 65.19% | 67.37% | 69.08% | 69.82% | |
| Expenses | |||||||||||||
| Payroll | $2,837 | $2,837 | $2,837 | $2,837 | $2,837 | $2,837 | $2,837 | $2,837 | $2,837 | $2,837 | $2,837 | $2,837 | |
| Marketing/Promotion | $250 | $250 | $250 | $250 | $250 | $250 | $250 | $250 | $250 | $250 | $250 | $250 | |
| Depreciation | $774 | $774 | $774 | $774 | $774 | $774 | $774 | $774 | $774 | $774 | $774 | $774 | |
| Rent | $2,000 | $2,000 | $2,000 | $2,000 | $2,000 | $2,000 | $2,000 | $2,000 | $2,000 | $2,000 | $2,000 | $2,000 | |
| Utilities | $225 | $225 | $225 | $225 | $225 | $225 | $225 | $225 | $225 | $225 | $225 | $225 | |
| Liability insurance | $200 | $200 | $200 | $200 | $200 | $200 | $200 | $200 | $200 | $200 | $200 | $200 | |
| Payroll Taxes | 13% | $0 | $0 | $0 | $0 | $0 | $0 | $0 | $0 | $0 | $0 | $0 | $0 |
| Legal fees | $0 | $0 | $0 | $0 | $0 | $0 | $0 | $0 | $0 | $0 | $0 | $0 | |
| Accounting | $100 | $100 | $100 | $100 | $100 | $100 | $100 | $100 | $100 | $100 | $100 | $100 | |
| Bank Service Charges | $125 | $125 | $125 | $125 | $125 | $125 | $125 | $125 | $125 | $125 | $125 | $125 | |
| Telephone/Cell Phone | $75 | $75 | $75 | $75 | $75 | $75 | $75 | $75 | $75 | $75 | $75 | $75 | |
| License and Permits | $42 | $42 | $42 | $42 | $42 | $42 | $42 | $42 | $42 | $42 | $42 | $42 | |
| Cold Storage | $208 | $208 | $208 | $208 | $208 | $208 | $208 | $208 | $208 | $208 | $208 | $208 | |
| Office Supplies | $42 | $42 | $42 | $42 | $42 | $42 | $42 | $42 | $42 | $42 | $42 | $42 | |
| Repairs and Maintenance | $83 | $83 | $83 | $83 | $83 | $83 | $83 | $83 | $83 | $83 | $83 | $83 | |
| Gas/Auto Expenses | 15% | $83 | $83 | $83 | $83 | $83 | $83 | $83 | $83 | $83 | $83 | $83 | $83 |
| Postage | $17 | $17 | $17 | $17 | $17 | $17 | $17 | $17 | $17 | $17 | $17 | $17 | |
| Total Operating Expenses | $7,060 | $7,060 | $7,060 | $7,060 | $7,060 | $7,060 | $7,060 | $7,060 | $7,060 | $7,060 | $7,060 | $7,060 | |
| Profit Before Interest and Taxes | ($2,097) | ($1,331) | ($1,806) | ($2,482) | $64 | $1,536 | ($939) | $318 | ($309) | $381 | $994 | $1,281 | |
| EBITDA | ($1,323) | ($558) | ($1,032) | ($1,708) | $837 | $2,310 | ($165) | $1,092 | $465 | $1,155 | $1,768 | $2,054 | |
| Interest Expense | $845 | $840 | $835 | $830 | $825 | $820 | $815 | $810 | $805 | $800 | $795 | $790 | |
| Taxes Incurred | $0 | $0 | $0 | $0 | $0 | $0 | $0 | $0 | $0 | $0 | $0 | $0 | |
| Net Profit | ($2,942) | ($2,171) | ($2,641) | ($3,312) | ($761) | $716 | ($1,754) | ($492) | ($1,114) | ($419) | $199 | $491 | |
| Net Profit/Sales | -34.34% | -23.26% | -29.81% | -40.48% | -7.10% | 5.87% | -18.04% | -4.48% | -10.76% | -3.79% | 1.71% | 4.11% | |
| Pro Forma Cash Flow | |||||||||||||
| Month 1 | Month 2 | Month 3 | Month 4 | Month 5 | Month 6 | Month 7 | Month 8 | Month 9 | Month 10 | Month 11 | Month 12 | ||
| Cash Received | |||||||||||||
| Cash from Operations | |||||||||||||
| Cash Sales | $8,568 | $9,334 | $8,859 | $8,183 | $10,729 | $12,201 | $9,726 | $10,983 | $10,356 | $11,046 | $11,659 | $11,946 | |
| Subtotal Cash from Operations | $8,568 | $9,334 | $8,859 | $8,183 | $10,729 | $12,201 | $9,726 | $10,983 | $10,356 | $11,046 | $11,659 | $11,946 | |
| Additional Cash Received | |||||||||||||
| Sales Tax, VAT, HST/GST Received | 4.00% | $343 | $373 | $354 | $327 | $429 | $488 | $389 | $439 | $414 | $442 | $466 | $478 |
| New Current Borrowing | $0 | $0 | $0 | $0 | $0 | $0 | $0 | $0 | $0 | $0 | $0 | $0 | |
| New Other Liabilities (interest-free) | $0 | $0 | $0 | $0 | $0 | $0 | $0 | $0 | $0 | $0 | $0 | $0 | |
| New Long-term Liabilities | $0 | $0 | $0 | $0 | $0 | $0 | $0 | $0 | $0 | $0 | $0 | $0 | |
| Sales of Other Current Assets | $0 | $0 | $0 | $0 | $0 | $0 | $0 | $0 | $0 | $0 | $0 | $0 | |
| Sales of Long-term Assets | $0 | $0 | $0 | $0 | $0 | $0 | $0 | $0 | $0 | $0 | $0 | $0 | |
| New Investment Received | $0 | $0 | $0 | $0 | $0 | $0 | $0 | $0 | $0 | $0 | $0 | $0 | |
| Subtotal Cash Received | $8,911 | $9,707 | $9,214 | $8,510 | $11,158 | $12,689 | $10,115 | $11,422 | $10,770 | $11,488 | $12,125 | $12,424 | |
| Expenditures | Month 1 | Month 2 | Month 3 | Month 4 | Month 5 | Month 6 | Month 7 | Month 8 | Month 9 | Month 10 | Month 11 | Month 12 | |
| Expenditures from Operations | |||||||||||||
| Cash Spending | $2,837 | $2,837 | $2,837 | $2,837 | $2,837 | $2,837 | $2,837 | $2,837 | $2,837 | $2,837 | $2,837 | $2,837 | |
| Bill Payments | $343 | $10,295 | $10,090 | $4,485 | $10,280 | $10,075 | $4,470 | $10,065 | $4,460 | $10,255 | $10,050 | $4,445 | |
| Subtotal Spent on Operations | $3,180 | $13,131 | $12,926 | $7,321 | $13,116 | $12,911 | $7,306 | $12,901 | $7,296 | $13,091 | $12,886 | $7,281 | |
| Additional Cash Spent | |||||||||||||
| Sales Tax, VAT, HST/GST Paid Out | $0 | $343 | $373 | $354 | $327 | $429 | $488 | $389 | $439 | $414 | $442 | $466 | |
| Principal Repayment of Current Borrowing | $0 | $0 | $0 | $0 | $0 | $0 | $0 | $0 | $0 | $0 | $0 | $0 | |
| Other Liabilities Principal Repayment | $0 | $0 | $0 | $0 | $0 | $0 | $0 | $0 | $0 | $0 | $0 | $0 | |
| Long-term Liabilities Principal Repayment | $1,000 | $1,000 | $1,000 | $1,000 | $1,000 | $1,000 | $1,000 | $1,000 | $1,000 | $1,000 | $1,000 | $1,000 | |
| Purchase Other Current Assets | $0 | $0 | $0 | $0 | $0 | $0 | $0 | $0 | $0 | $0 | $0 | $0 | |
| Purchase Long-term Assets | $5,417 | $5,417 | $5,417 | $5,417 | $5,417 | $5,417 | $5,417 | $5,417 | $5,417 | $5,417 | $5,417 | $5,417 | |
| Dividends | $0 | $0 | $0 | $0 | $0 | $0 | $0 | $0 | $0 | $0 | $0 | $0 | |
| Subtotal Cash Spent | $9,597 | $19,891 | $19,717 | $14,093 | $19,860 | $19,757 | $14,211 | $19,707 | $14,152 | $19,922 | $19,745 | $14,165 | |
| Net Cash Flow | ($686) | ($10,184) | ($10,503) | ($5,582) | ($8,703) | ($7,068) | ($4,096) | ($8,285) | ($3,382) | ($8,434) | ($7,620) | ($1,741) | |
| Cash Balance | $117,314 | $107,130 | $96,627 | $91,045 | $82,342 | $75,274 | $71,178 | $62,893 | $59,511 | $51,076 | $43,457 | $41,716 | |
| Pro Forma Balance Sheet | |||||||||||||
| Month 1 | Month 2 | Month 3 | Month 4 | Month 5 | Month 6 | Month 7 | Month 8 | Month 9 | Month 10 | Month 11 | Month 12 | ||
| Assets | Starting Balances | ||||||||||||
| Current Assets | |||||||||||||
| Cash | $118,000 | $117,314 | $107,130 | $96,627 | $91,045 | $82,342 | $75,274 | $71,178 | $62,893 | $59,511 | $51,076 | $43,457 | $41,716 |
| Inventory | $12,000 | $14,395 | $16,791 | $13,186 | $15,581 | $17,977 | $14,372 | $16,767 | $13,163 | $15,558 | $17,953 | $14,349 | $16,744 |
| Other Current Assets | $0 | $0 | $0 | $0 | $0 | $0 | $0 | $0 | $0 | $0 | $0 | $0 | $0 |
| Total Current Assets | $130,000 | $131,710 | $123,921 | $109,813 | $106,626 | $100,319 | $89,646 | $87,945 | $76,056 | $75,069 | $69,030 | $57,806 | $58,460 |
| Long-term Assets | |||||||||||||
| Long-term Assets | $65,000 | $70,417 | $75,833 | $81,250 | $86,667 | $92,083 | $97,500 | $102,917 | $108,333 | $113,750 | $119,167 | $124,583 | $130,000 |
| Accumulated Depreciation | $0 | $774 | $1,548 | $2,321 | $3,095 | $3,869 | $4,643 | $5,416 | $6,190 | $6,964 | $7,738 | $8,511 | $9,285 |
| Total Long-term Assets | $65,000 | $69,643 | $74,286 | $78,929 | $83,572 | $88,215 | $92,858 | $97,500 | $102,143 | $106,786 | $111,429 | $116,072 | $120,715 |
| Total Assets | $195,000 | $201,352 | $198,207 | $188,742 | $190,198 | $188,534 | $182,504 | $185,446 | $178,199 | $181,855 | $180,459 | $173,878 | $179,175 |
| Liabilities and Capital | Month 1 | Month 2 | Month 3 | Month 4 | Month 5 | Month 6 | Month 7 | Month 8 | Month 9 | Month 10 | Month 11 | Month 12 | |
| Current Liabilities | |||||||||||||
| Accounts Payable | $0 | $9,952 | $9,947 | $4,142 | $9,937 | $9,932 | $4,128 | $9,923 | $4,118 | $9,913 | $9,908 | $4,103 | $9,899 |
| Current Borrowing | $0 | $0 | $0 | $0 | $0 | $0 | $0 | $0 | $0 | $0 | $0 | $0 | $0 |
| Other Current Liabilities | $0 | $343 | $373 | $354 | $327 | $429 | $488 | $389 | $439 | $414 | $442 | $466 | $478 |
| Subtotal Current Liabilities | $0 | $10,295 | $10,320 | $4,497 | $10,265 | $10,362 | $4,616 | $10,312 | $4,557 | $10,327 | $10,350 | $4,570 | $10,376 |
| Long-term Liabilities | $170,000 | $169,000 | $168,000 | $167,000 | $166,000 | $165,000 | $164,000 | $163,000 | $162,000 | $161,000 | $160,000 | $159,000 | $158,000 |
| Total Liabilities | $170,000 | $179,295 | $178,320 | $171,497 | $176,265 | $175,362 | $168,616 | $173,312 | $166,557 | $171,327 | $170,350 | $163,570 | $168,376 |
| Paid-in Capital | $70,000 | $70,000 | $70,000 | $70,000 | $70,000 | $70,000 | $70,000 | $70,000 | $70,000 | $70,000 | $70,000 | $70,000 | $70,000 |
| Retained Earnings | ($45,000) | ($45,000) | ($45,000) | ($45,000) | ($45,000) | ($45,000) | ($45,000) | ($45,000) | ($45,000) | ($45,000) | ($45,000) | ($45,000) | ($45,000) |
| Earnings | $0 | ($2,942) | ($5,113) | ($7,754) | ($11,067) | ($11,828) | ($11,112) | ($12,866) | ($13,358) | ($14,472) | ($14,891) | ($14,692) | ($14,202) |
| Total Capital | $25,000 | $22,058 | $19,887 | $17,246 | $13,933 | $13,172 | $13,888 | $12,134 | $11,642 | $10,528 | $10,109 | $10,308 | $10,798 |
| Total Liabilities and Capital | $195,000 | $201,352 | $198,207 | $188,742 | $190,198 | $188,534 | $182,504 | $185,446 | $178,199 | $181,855 | $180,459 | $173,878 | $179,175 |
| Net Worth | $25,000 | $22,058 | $19,887 | $17,246 | $13,933 | $13,172 | $13,888 | $12,134 | $11,642 | $10,528 | $10,109 | $10,308 | $10,798 |

