
Healing Touch Massage
Executive Summary
Healing Touch Massage is a sole proprietorship owned by Lavinia Watkins, LMT. Ms. Watkins has been a Licensed Massage Therapist in the State of Oregon since July 1984, and has run the business from a home-based location since then. The business has consistently been profitable since its inception.
We offer massage in a variety of styles – traditional Swedish Massage, Deep Tissue work, Sports Massage, Hot Stone Massage, Reflexology, and others.
This massage therapy business plan is being used to explore the cost effectiveness of expanding by moving the business into a downtown location. This would make the services more accessible to people who work full time, and also make the office more convenient for clients with medically-ordered massage therapy. Billing insurance companies for medically required massage is lucrative, but the nature of the therapy – usually 15 to 30 minute sessions, focused on a specific body area, with a short-term duration – makes it imperative that the clients can get in to see the therapist over their lunch hour or during their work day.
Mission
Our mission is to run a profitable business by providing therapeutic massage in a caring, professional environment. We offer massage in a variety of styles – traditional Swedish Massage, Deep Tissue work, Sports Massage, Hot Stone Massage, Reflexology, and others. Our goal is to tailor the client’s experience based on initial interview information, as well as in-the-minute feedback during the massage, to insure the client’s comfort and satisfaction, and to increase repeat business. We intend to offer massage that is effective, yet respectful of the client’s personal boundaries, so that the experience is relaxing and energizing for both the client and the provider. We are mindful of the overall experience – using quality oils and lotions, appropriate scents, and soothing music, nature sounds or silence – as the client prefers.
Objectives
- Increase number of day-time clients by 100% by moving to a downtown location.
- Increase new clients by 50% by advertising locally.
- Find other LMT or other personal service provider to sublet space in new location.

Keys to Success
- Professionalism: which includes everything from maintaining confidentiality, to keeping our LMT training up-to-date, to maintaining good boundaries between clients and therapist.
- Individual Attention: making that extra effort to customize each client’s experience to his or her preference.
- Repeat business/Recommendations: giving the kind of service that brings people back for regular treatments, and encourages clients to recommend us to friends, and other health professionals to recommend their clients.
Company Summary
Healing Touch Massage is a Sole Proprietorship owned by Lavinia Watkins, LMT. Ms. Watkins has been a Licensed Massage Therapist in the State of Oregon since July, 1984, and has run the business from a home-based location since then. In the years since first obtaining her license, Ms. Watkins has consistently taken more Continuing Education classes than required to continue her degree, and has studied a wide variety of massage and other therapeutic techniques, including: Shiatsu, Deep Tissue, Sports Massage, Reiki, Watsu, Acupressure, Reflexology, and Integrated Breathing. As a result, Ms. Watkins has is adept in a wide range of massage styles, and can tailor each massage to the client’s needs and preferences.
Company History
Lavinia Watkins, LMT, owner of Healing Touch Massage, has been licensed by the State of Oregon since July 1984. An initial (and expensive!) advertising blitz in the local paper helped Ms. Watkins establish an initial clientele, many of whom are still clients, some of whom she continues to offer in-home service. The bulk of her clients come to her home office, and her advertising has been primarily word of mouth for a number of years. Volunteering to work at local track and bicycle events in the late 80s established her reputation as a Sports Masseuse, and attracted another group of long-term repeat clients. In 1993, Ms. Watkins began to make contact among the local chiropractors, orthopedic surgeons, and other medical professionals in an effort to build her referrals of “medically-necessary” massage.
The increased in popularity of Section 125 and other “cafeteria plans” has given rise in recent years to clients who are able to afford regular massage by using these “pre-tax” dollar plans to increase their discretionary spending budgets for massage.
In 2000, Ms. Watkins became affiliated with the American Health Specialties Network, whose website is: http://www.ashn.com. This increased her exposure to clients with health insurance coverage that have Alternative Care coverage, and also greatly decreased the time lag and difficulties usually associated with filing insurance billing claims.
Ms Watkins is now looking at moving to a downtown location, to further increase her availability to short-term clients referred my medical professionals.
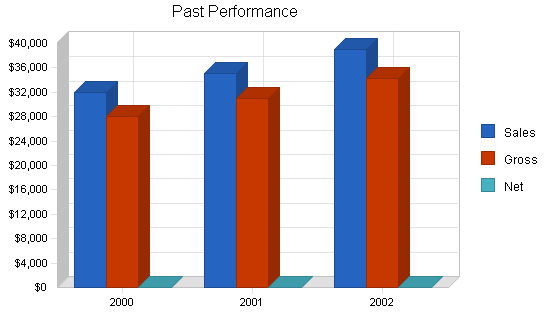
| Past Performance | |||
| 2000 | 2001 | 2002 | |
| Sales | $32,000 | $35,000 | $39,000 |
| Gross Margin | $28,000 | $31,058 | $34,320 |
| Gross Margin % | 87.50% | 88.74% | 88.00% |
| Operating Expenses | $6,500 | $6,800 | $7,000 |
| Collection Period (days) | 0 | 0 | 0 |
| Balance Sheet | |||
| 2000 | 2001 | 2002 | |
| Current Assets | |||
| Cash | $500 | $350 | $1,000 |
| Accounts Receivable | $200 | $350 | $500 |
| Other Current Assets | $50 | $50 | $50 |
| Total Current Assets | $750 | $750 | $1,550 |
| Long-term Assets | |||
| Long-term Assets | $1,200 | $1,500 | $2,000 |
| Accumulated Depreciation | $1,100 | $1,150 | $1,200 |
| Total Long-term Assets | $100 | $350 | $800 |
| Total Assets | $850 | $1,100 | $2,350 |
| Current Liabilities | |||
| Accounts Payable | $50 | $50 | $50 |
| Current Borrowing | $0 | $0 | $0 |
| Other Current Liabilities (interest free) | $0 | $0 | $0 |
| Total Current Liabilities | $50 | $50 | $50 |
| Long-term Liabilities | $0 | $0 | $0 |
| Total Liabilities | $50 | $50 | $50 |
| Paid-in Capital | $800 | $1,000 | $1,200 |
| Retained Earnings | $0 | $50 | $1,100 |
| Earnings | $0 | $0 | $0 |
| Total Capital | $800 | $1,050 | $2,300 |
| Total Capital and Liabilities | $850 | $1,100 | $2,350 |
| Other Inputs | |||
| Payment Days | 0 | 0 | 0 |
| Sales on Credit | $0 | $0 | $0 |
| Receivables Turnover | 0.00 | 0.00 | 0.00 |
Company Ownership
Healing Touch Massage is a Sole Proprietorship owned by Lavinia Watkins, LMT.
Services
Market Analysis Summary
The planned move to a downtown location will facilitate access by clients recovering from injuries. We have identified this as a lucrative target market because they usually are funded by insurance claims, and represent repeat visits for a duration of up to one year. Because this group very often needs multiple, short sessions for a series of weeks or months, a downtown location would make us convenient for mid-day appointments.
It is also quite probable that other clients who work during the day would be more likely to book a day-time massage when we are more conveniently located to their place of work. Since the number of day time slots far exceeds the number of evening slots, this is increased business we would be able to book in addition to our current clients.
Market Segmentation
Clients who come for massage fall into four basic groups:
- Clients recovering from injuries or accidents
- Often also seeing a chiropractor or physical therapist (more often referral from chiropractor)
- Frequently paid by insurance
- Usually insurance will pay for short-term therapy only, although clients will sometimes supplement out-of-pocket
- Clients pampering themselves
- High disposable income individuals
- Sometimes have chronic pain or old injury issues
- Massage 1 – 4 times a month for relaxation
- Clients who prefer alternative health care
- Use massage as preventative health care
- Use other alternative practices – e.g. acupuncture, Chiropractor, Naturopath, Herbalist, etc.
- Try to have massage as regularly as they can afford – usually once per month
- Serious Athletes
- Injury and workout recovery, also preventative
- Many serious runners/bicyclists in local area
- Massage for improved performance – great for word-of mouth referrals if they see results
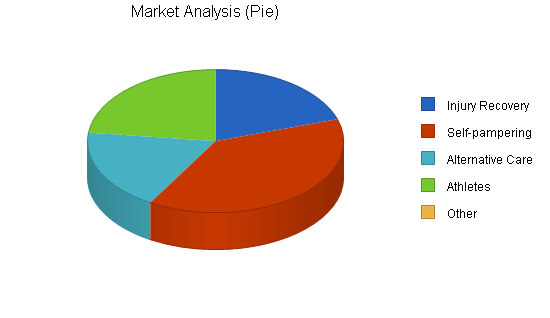
| Market Analysis | |||||||
| 2003 | 2004 | 2005 | 2006 | 2007 | |||
| Potential Customers | Growth | CAGR | |||||
| Injury Recovery | 3% | 156 | 161 | 166 | 171 | 176 | 3.06% |
| Self-pampering | 5% | 300 | 315 | 331 | 348 | 365 | 5.03% |
| Alternative Care | 5% | 144 | 151 | 159 | 167 | 175 | 5.00% |
| Athletes | 2% | 180 | 184 | 188 | 192 | 196 | 2.15% |
| Other | 0% | 0 | 0 | 0 | 0 | 0 | 0.00% |
| Total | 3.99% | 780 | 811 | 844 | 878 | 912 | 3.99% |
Target Market Segment Strategy
As individual as our clients are, they seem to fall into one of five general categories: Injury Recovery, Self-Pampering/Relaxation, Alternative Care Users, Athletes, and the inevitable Other. Besides the obvious differences in the style of massage each of these prefer, they also represent separate groups for marketing and retention purposes.

The Injury recovery group is usually referred by a Chiropractor, self-referred through our listing on the American Specialty Health Network site, or referred by another client who found massage helpful during an injury recovery. So the marketing to this audience is done indirectly, through the referring parties. While car insurance will typically pay for massage for only a limited time period (less than one year), many health insurance policies now have Alternative Care coverage with a renewable annual maximum. And Cafeteria Plans will reimburse for “medically necessary” massage – which is a bit ironic since few, if any, medical doctors will proactively recommend massage, but most will be willing to sign off on a recommendation, if specifically asked by their patients. The rapid turnover of this group is offset by the fact that they will pay top dollar per session. The key is to keep getting new referrals.
Clients who have the disposable income to indulge in massage for self-pampering or relaxation are the core of our long-term repeat customers. These clients will come once a week to once a month for years, and often refer other family and friends. The difficulty working with these clients comes from the ‘familiarity breeds contempt” factor – they can believe they deserve lower rates, cancellations of short or no notice, and can come to seem as friends, rather than clients. The challenge here is maintain a professional relationship, while encouraging the warmth and personal connection that is as much a part of their experience as the actual massage. This type of client can be difficult to find – an ad in the local alternative news weekly (especially with a coupon for $5 off ) or a donation to a charity auction may result in a one-time visit, or a long-term client. Another source of usually one-time visitors is the Gift Certificate – friends pampering friends for a birthday or other special occasion.
The third group are Alternative Care users. These are people who mistrust allopathic medicine, and prefer to use chiropractors, naturopaths, herbalists, acupuncturists. A local networking group of alternative care providers is a great way to get referrals, as well as placing posters on other practitioners offices, and ads in the local alternative newspaper. The problem with this group is that they can tend to have relatively small disposable incomes, so that a massage once every two months may be all they can afford. A relatively large pool of these clients will book only 20% of the available appointments in any given month.
The final group is another backbone of this business – the amateur athletes. There is a large population of runners and bicyclists in the local areas, as well as out-of-town participants who return for annual events, and book massages during those times. This business tends to be slightly seasonal – as most amateur athletes will only train, or gear-up their training during the Spring and Summer months. However, they are a very loyal group, and will readily give word-of-mouth recommendations, especially if they see massage as having given them a specific boost to their performance. This group will cross over from the Injury group, and become long-term clients after the specific initial injury has healed. They also tend to have chronic injuries or pain, especially as they age, which can help them become repeat clients.
Service Business Analysis
The massage industry consists of several dozens of individual therapists working out of home or private offices, in addition to LMTs working in chiropractors’ offices, gyms, beauty salons, and other venues.
Additional massage services are offered by graduates of specialty schools; Rolfers, Breath Managers, Hakomi Therapists, as well as Physical Therapists.
Fortunately, massage is a very personal service, and different clients are attracted to different techniques and personalities. Healing Touch Massage offers the unique services of Lavinia Watkins, LMT, which cannot be duplicated by any other practitioner.
This business is becoming increasingly easy to “break into,” since obtaining the training necessary for licensing is not all that arduous, nor difficult to maintain. But while getting the credentials and equipment necessary to start a new massage business is easy, establishing a clientele is not, so our established practice of over 20 years duration helps us compete with the ever-available flow of LMTs graduating from local schools.
Competition and Buying Patterns
The key element in purchase decisions made by potential massage clients is trust in the professional reputation, and ultimately, in the skill and knowledge of the provider as experienced in the initial massage. For this reason, a discount coupon or donation to a charity auction can be an effective way to troll the waters for new clients. Recommendations from other clients and alternative health service providers is also critical.
While there is a range of prices charged for massage service in the area, there is some price sensitivity among the long-term clientele. Since the variable cost of each massage is nominal, the best bet has seemed to be to charge less than the market will bear. The one exception is when billing insurance companies, where there is no penalty for charging the full Reasonable and Customary Rates for the area.
Clients rarely compare massage therapists directly, although they may try a second LMT if they are not entirely happy with their first experience. Usually they follow word-of-mouth recommendations, and return for repeat sessions as often as their budget allows.
Strategy and Implementation Summary
If, as it has been said, the top three items which determine success in business are location, location, and location, then the planned move to a downtown location represents our top marketing strategy. By being more available to working clients, and by making the other health professionals who will refer those clients to us aware of our new location, we literally make ourselves accessible to more business.
Once a client experiences the level of personalized care that we offer, we are confident that we will have a return client, for as long as their funding holds out. And since we have seen many clients who began as insurance-paid injury-recovery cases turn into regular self-paying clients, we believe this will serve our long-term goal of increasing business also.
Competitive Edge
This is another section where mission and passion create the same results as “Marketing.” Our “competitive edge” is our ability to give intuitive massage – to sense in the client’s musculature, posture and presence what work is needed – where the pain is, where the tension is. There is a way that years of study of technique combine with a deep knowledge of kinesiology and anatomy, that is then synthesized with an acute sense of empathy and ability to “read” people that enables us to provide a massage experience that is exactly what each client needs at that given moment.
We have repeatedly heard of word-of-mouth recommendations bringing in new clients with words like “magic hands” and “a higher sense of healing.”
Quite apart from this gift, or talent, however, is a sense of what it take to run a business: How to pace appointments to conserve personal energy; how to use networking – whether local or the ASHN – to reach prospective clients; how to maintain that fine balance between personal service and professional boundaries.
The change to having an outside-the-home office in a downtown location is both exhilarating and a bit scary. It will definitely make Healing Touch Massage accessible to more clients – and hopefully, the top-end, insurance-paid clients. But can we also retain the long-term clients who feel ‘at home” in our home office after all these years? We believe so.
Marketing Strategy
Critical to the success of the move to a new location with be the maintenance of referral – creating contacts with other health care providers, especially chiropractors. Also, researching the possibility of becoming a Preferred Provider with other health insurance companies that offer Alternative Care to their members will be critical. Any opportunity to convince allopathic physicians – MDs – to see massage as having long-term healing benefits for their patients will also be taken, since they hold to key to having massage paid for as “medically necessary.”
Sales Strategy
It can be difficult to think of offering the best possible massage service as a sales strategy, since that is also the mission and personal passion of the owner of Healing Touch Massage. Each client comes with a specific personal agenda, both emotional and physical, and the goal is to “read” that client, and provide the pain relief, relaxation, and feeling of increased well-being that will allow that client to leave feeling satisfied.
This is one business where the service IS the sales technique. It is impossible NOT to offer completely customized services, since each client will present a unique body to be worked on. Of course, the total environment in which the service is offered – smells, lighting, sounds, feel of the linens and oils, emotional presence of the therapist – all combine with the techniques of actual tissue manipulation and knowledge of the musculo-skeletal systems to create the client’s experience.
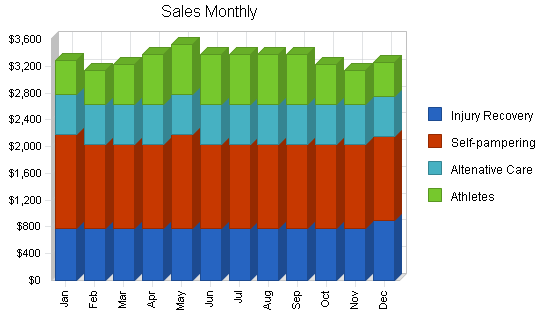
Sales Forecast
The following table and charts give a run-down on forecasted sales. We expect sales to remain fairly stable, as the practice is relatively “full” for the present. We anticipate moving into the new downtown location in 2004. This move to a location more convenient for mid-day appointments should increase our injury/insurance billing by 50%, and our self-pampering group by at least 5%.
There is also a bit of seasonality – athletes tend to get more massage during the Spring and Summer “performance” months. Also, we have regularly experienced a slight increase in late December, January, and May due to Gift Certificates purchased for the holidays and Mothers Day.

| Sales Forecast | |||
| 2003 | 2004 | 2005 | |
| Sales | |||
| Injury Recovery | $9,480 | $14,220 | $21,330 |
| Self-pampering | $15,300 | $16,065 | $16,868 |
| Altenative Care | $7,200 | $7,200 | $7,200 |
| Athletes | $7,700 | $7,700 | $7,700 |
| Total Sales | $39,680 | $45,185 | $53,098 |
| Direct Cost of Sales | 2003 | 2004 | 2005 |
| Linens | $1,500 | $1,650 | $1,815 |
| Oils & Lotions | $200 | $220 | $242 |
| Insurance Billing | $480 | $528 | $581 |
| Subtotal Direct Cost of Sales | $2,180 | $2,398 | $2,638 |
Management Summary
Healing Touch Massage is a sole proprietorship owned by Lavinia Watkins, LMT. Ms. Watkins has been a Licensed Massage Therapist in the State of Oregon since July 1984. Ms. Watkins has consistently taken more Continuing Education classes than required to continue her degree, and has studied a wide variety of massage and other therapeutic techniques, including: Shiatsu, Deep Tissue, Sports Massage, Reiki, Watsu, Acupressure, Reflexology, and Integrated Breathing.
Ms. Watkins currently holds certificates of completion of the Advanced level training from the prestigious Boulder School of Sports Massage, a Second Level Reiki Degree, and 30 hours of Watsu training. She is also an avid practitioner of Ki Akido, and a member of the Eugene Zendo. She hold a BA degree from University of California, Riverside in Urban Studies, with a minor in Business. She is a member of the Oregon Association of Alternative Practitioners, and of the American Massage Therapy Association.
| Personnel Plan | |||
| 2003 | 2004 | 2005 | |
| Owner Draw | $30,000 | $30,000 | $33,500 |
| Other | $0 | $0 | $0 |
| Total People | 0 | 0 | 0 |
| Total Payroll | $30,000 | $30,000 | $33,500 |
Financial Plan
The following Financial Plan represents a continuation of actual business revenues and expenses for the remainder of 2003, and then a planned increase in both revenues and expenses as a result of a location change.
Another scenario for maintaining income to match the increased expenses of the new downtown location would be to sublet part of the space to another LMT or complementary health care provider. A third scenario would be to try out a downtown location by subletting office space from a chiropractor or in an existing LMT office. Since these last two scenarios are mutually exclusive to the first, preferred plan, they are not reflected in financial plans presented here.
Important Assumptions
The financial plan depends on important assumptions, most of which are shown in the following table as annual assumptions.
The collection days are for insurance billings only, and not a factor we can influence easily. Interest rates, tax rates, and personnel burden are based on conservative assumptions.
Two of the more important underlying assumptions are:
- We assume a strong economy, without major recession.
- We assume, of course, that there are no changes to the Medical/insurance Industry, such as the nationalization of health care.
| General Assumptions | |||
| 2003 | 2004 | 2005 | |
| Plan Month | 1 | 2 | 3 |
| Current Interest Rate | 5.00% | 5.00% | 5.00% |
| Long-term Interest Rate | 5.65% | 5.65% | 5.65% |
| Tax Rate | 28.17% | 28.00% | 28.17% |
| Other | 0 | 0 | 0 |
Break-even Analysis
The following chart and table summarize our break-even analysis. Because this business has been run from a home office, the fixed costs for rent and utilities have been moderate. As we move the business into a downtown location, the fixed costs will rise substantially.
The break-even assumes minimal variable costs: linens and massage oil. If having a downtown office increases the number of clients paid for by insurance, there will be additional costs per client for claims processing.

| Break-even Analysis | |
| Monthly Revenue Break-even | $3,101 |
| Assumptions: | |
| Average Percent Variable Cost | 5% |
| Estimated Monthly Fixed Cost | $2,931 |
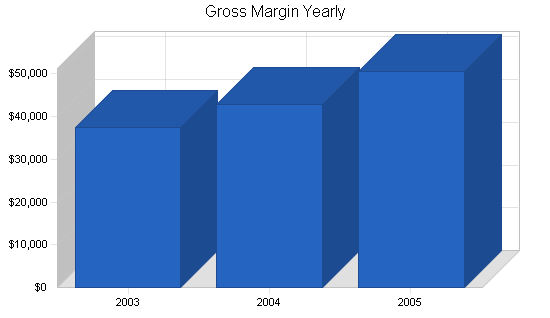
Projected Profit and Loss
Sales and expenses for 2003 are projected from YTD actuals, and seasonal variations noted over the last few years. The big change comes in 2004 and 2005, with the addition of a downtown office, which will increase the rent dramatically. As noted in the Sales Forecast, the expectation is that the number of Insurance Billing clients will rise as the business becomes more convenient for short, mid-day appointments.
There is no personnel cost other than the owner’s draw, as the company is a sole proprietorship. Payroll taxes are calculated at 15%, however, as Self Employment Taxes (FICA) must also be paid. Estimated taxes will be paid quarterly, although they are calculated monthly on this table.
Not included on this table is the scenario where the Insurance Billing clients do not increase sufficiently quickly to cover the increased cost of rent. At some point, the decision could be made to rent out part of the office space, or rent the entire space to another massage therapist for set times during the week, which would offset the same costs. If a lease needs to be signed, which is most likely for the 2004 year, it will be for one year only, to minimize the risk if the anticipated increase in Insurance Billing clients does not occur.


| Pro Forma Profit and Loss | |||
| 2003 | 2004 | 2005 | |
| Sales | $39,680 | $45,185 | $53,098 |
| Direct Cost of Sales | $2,180 | $2,398 | $2,638 |
| Other Costs of Sales | $0 | $0 | $0 |
| Total Cost of Sales | $2,180 | $2,398 | $2,638 |
| Gross Margin | $37,500 | $42,787 | $50,460 |
| Gross Margin % | 94.51% | 94.69% | 95.03% |
| Expenses | |||
| Payroll | $30,000 | $30,000 | $33,500 |
| Sales and Marketing and Other Expenses | $550 | $600 | $600 |
| Depreciation | $50 | $50 | $50 |
| Rent (inc Utilities) | $2,400 | $9,600 | $9,900 |
| Insurance | $636 | $800 | $1,000 |
| Payroll Taxes | $335 | $30 | $429 |
| Other | $1,200 | $1,500 | $2,000 |
| Total Operating Expenses | $35,171 | $42,580 | $47,479 |
| Profit Before Interest and Taxes | $2,329 | $207 | $2,981 |
| EBITDA | $2,379 | $257 | $3,031 |
| Interest Expense | $0 | $0 | $0 |
| Taxes Incurred | $656 | $58 | $840 |
| Net Profit | $1,673 | $149 | $2,141 |
| Net Profit/Sales | 4.22% | 0.33% | 4.03% |
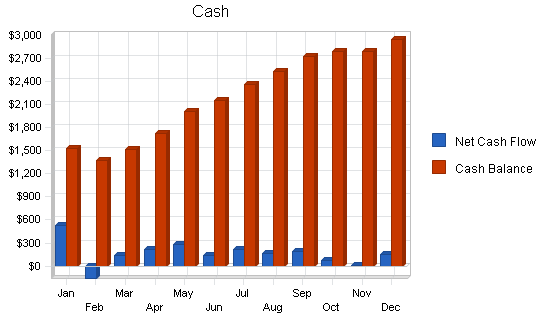
Projected Cash Flow
The following Cash Flow table shows us with a consistent positive Cash Flow throughout the transition. Because the business is a sole proprietorship, the amounts listed as “payroll” are, in fact, owner’s draw, so they are obviously the area of cash flow where adjustments are, and will be, made if the Cash Flow becomes tight.
We do list a marked increase in outflow of Cash for the purchase of Fixed Assets in 2004. These would be for fixtures and lease improvement to whatever new space we rent for our new downtown location. Since all of the equipment we currently use is portable, this additional cost is fairly moderate, since it mostly represents cosmetic improvements. There is a possibility that the landlord would do many of the improvements before we moved in, in exchange for an increase in the monthly rent, which would flatten out the cash outflow a bit.
| Pro Forma Cash Flow | |||
| 2003 | 2004 | 2005 | |
| Cash Received | |||
| Cash from Operations | |||
| Cash Sales | $34,522 | $39,311 | $46,195 |
| Cash from Receivables | $4,843 | $5,761 | $6,740 |
| Subtotal Cash from Operations | $39,364 | $45,072 | $52,936 |
| Additional Cash Received | |||
| Sales Tax, VAT, HST/GST Received | $0 | $0 | $0 |
| New Current Borrowing | $0 | $0 | $0 |
| New Other Liabilities (interest-free) | $0 | $0 | $0 |
| New Long-term Liabilities | $0 | $0 | $0 |
| Sales of Other Current Assets | $0 | $0 | $0 |
| Sales of Long-term Assets | $0 | $0 | $0 |
| New Investment Received | $0 | $0 | $0 |
| Subtotal Cash Received | $39,364 | $45,072 | $52,936 |
| Expenditures | 2003 | 2004 | 2005 |
| Expenditures from Operations | |||
| Cash Spending | $30,000 | $30,000 | $33,500 |
| Bill Payments | $7,411 | $14,350 | $17,208 |
| Subtotal Spent on Operations | $37,411 | $44,350 | $50,708 |
| Additional Cash Spent | |||
| Sales Tax, VAT, HST/GST Paid Out | $0 | $0 | $0 |
| Principal Repayment of Current Borrowing | $0 | $0 | $0 |
| Other Liabilities Principal Repayment | $0 | $0 | $0 |
| Long-term Liabilities Principal Repayment | $0 | $0 | $0 |
| Purchase Other Current Assets | $0 | $0 | $0 |
| Purchase Long-term Assets | $0 | $2,000 | $2,000 |
| Dividends | $0 | $0 | $0 |
| Subtotal Cash Spent | $37,411 | $46,350 | $52,708 |
| Net Cash Flow | $1,953 | ($1,279) | $228 |
| Cash Balance | $2,953 | $1,675 | $1,903 |
Projected Balance Sheet
The only Accounts Receivable carried is any Insurance Billings that are not paid during the month. It is rare for insurance companies to take more than 6 weeks to pay, and some pay as quickly as 10 working days, so these numbers assume that they will pay in 30 days.
The Accounts Payable is for linens (paid monthly) and lotions/supplies (usually purchased quarterly).
We assume that there will be some additional expenses, in the form of long-term assets purchased, when we move to the new office in 2004.
| Pro Forma Balance Sheet | |||
| 2003 | 2004 | 2005 | |
| Assets | |||
| Current Assets | |||
| Cash | $2,953 | $1,675 | $1,903 |
| Accounts Receivable | $816 | $929 | $1,092 |
| Other Current Assets | $50 | $50 | $50 |
| Total Current Assets | $3,819 | $2,654 | $3,044 |
| Long-term Assets | |||
| Long-term Assets | $2,000 | $4,000 | $6,000 |
| Accumulated Depreciation | $1,250 | $1,300 | $1,350 |
| Total Long-term Assets | $750 | $2,700 | $4,650 |
| Total Assets | $4,569 | $5,354 | $7,694 |
| Liabilities and Capital | 2003 | 2004 | 2005 |
| Current Liabilities | |||
| Accounts Payable | $596 | $1,232 | $1,431 |
| Current Borrowing | $0 | $0 | $0 |
| Other Current Liabilities | $0 | $0 | $0 |
| Subtotal Current Liabilities | $596 | $1,232 | $1,431 |
| Long-term Liabilities | $0 | $0 | $0 |
| Total Liabilities | $596 | $1,232 | $1,431 |
| Paid-in Capital | $1,200 | $1,200 | $1,200 |
| Retained Earnings | $1,100 | $2,773 | $2,922 |
| Earnings | $1,673 | $149 | $2,141 |
| Total Capital | $3,973 | $4,122 | $6,264 |
| Total Liabilities and Capital | $4,569 | $5,354 | $7,694 |
| Net Worth | $3,973 | $4,122 | $6,264 |
Business Ratios
The following table shows the projected businesses ratios. We expect to maintain healthy ratios for profitability, risk, and return. The ratios for the initial year of growth are, of course, not as favorable as the second year. And if we cannot maintain healthy ratios during that growth phase, a return to the lesser level of expenses we have historically had in a home-based business can be returned to. Industry profile ratios based on the Standard Industrial Classification (SIC) code 8049.02, Physical therapists, are shown for comparison.
| Ratio Analysis | ||||
| 2003 | 2004 | 2005 | Industry Profile | |
| Sales Growth | 1.74% | 13.87% | 17.51% | 5.93% |
| Percent of Total Assets | ||||
| Accounts Receivable | 17.85% | 17.35% | 14.19% | 26.64% |
| Other Current Assets | 1.09% | 0.93% | 0.65% | 42.05% |
| Total Current Assets | 83.59% | 49.57% | 39.57% | 73.17% |
| Long-term Assets | 16.41% | 50.43% | 60.43% | 26.83% |
| Total Assets | 100.00% | 100.00% | 100.00% | 100.00% |
| Current Liabilities | 13.05% | 23.01% | 18.59% | 29.42% |
| Long-term Liabilities | 0.00% | 0.00% | 0.00% | 19.99% |
| Total Liabilities | 13.05% | 23.01% | 18.59% | 49.41% |
| Net Worth | 86.95% | 76.99% | 81.41% | 50.59% |
| Percent of Sales | ||||
| Sales | 100.00% | 100.00% | 100.00% | 100.00% |
| Gross Margin | 94.51% | 94.69% | 95.03% | 100.00% |
| Selling, General & Administrative Expenses | 90.28% | 94.36% | 90.99% | 79.27% |
| Advertising Expenses | 0.00% | 0.00% | 0.00% | 0.46% |
| Profit Before Interest and Taxes | 5.87% | 0.46% | 5.61% | 3.28% |
| Main Ratios | ||||
| Current | 6.40 | 2.15 | 2.13 | 1.95 |
| Quick | 6.40 | 2.15 | 2.13 | 1.55 |
| Total Debt to Total Assets | 13.05% | 23.01% | 18.59% | 5.28% |
| Pre-tax Return on Net Worth | 58.61% | 5.03% | 47.60% | 60.60% |
| Pre-tax Return on Assets | 50.96% | 3.87% | 38.75% | 13.40% |
| Additional Ratios | 2003 | 2004 | 2005 | |
| Net Profit Margin | 4.22% | 0.33% | 4.03% | n.a |
| Return on Equity | 42.11% | 3.62% | 34.19% | n.a |
| Activity Ratios | ||||
| Accounts Receivable Turnover | 6.32 | 6.32 | 6.32 | n.a |
| Collection Days | 59 | 54 | 53 | n.a |
| Accounts Payable Turnover | 13.34 | 12.17 | 12.17 | n.a |
| Payment Days | 27 | 22 | 28 | n.a |
| Total Asset Turnover | 8.68 | 8.44 | 6.90 | n.a |
| Debt Ratios | ||||
| Debt to Net Worth | 0.15 | 0.30 | 0.23 | n.a |
| Current Liab. to Liab. | 1.00 | 1.00 | 1.00 | n.a |
| Liquidity Ratios | ||||
| Net Working Capital | $3,223 | $1,422 | $1,614 | n.a |
| Interest Coverage | 0.00 | 0.00 | 0.00 | n.a |
| Additional Ratios | ||||
| Assets to Sales | 0.12 | 0.12 | 0.14 | n.a |
| Current Debt/Total Assets | 13% | 23% | 19% | n.a |
| Acid Test | 5.04 | 1.40 | 1.36 | n.a |
| Sales/Net Worth | 9.99 | 10.96 | 8.48 | n.a |
| Dividend Payout | 0.00 | 0.00 | 0.00 | n.a |
Appendix
| Sales Forecast | |||||||||||||
| Jan | Feb | Mar | Apr | May | Jun | Jul | Aug | Sep | Oct | Nov | Dec | ||
| Sales | |||||||||||||
| Injury Recovery | 0% | $780 | $780 | $780 | $780 | $780 | $780 | $780 | $780 | $780 | $780 | $780 | $900 |
| Self-pampering | 0% | $1,400 | $1,250 | $1,250 | $1,250 | $1,400 | $1,250 | $1,250 | $1,250 | $1,250 | $1,250 | $1,250 | $1,250 |
| Altenative Care | 0% | $600 | $600 | $600 | $600 | $600 | $600 | $600 | $600 | $600 | $600 | $600 | $600 |
| Athletes | 0% | $500 | $500 | $600 | $750 | $750 | $750 | $750 | $750 | $750 | $600 | $500 | $500 |
| Total Sales | $3,280 | $3,130 | $3,230 | $3,380 | $3,530 | $3,380 | $3,380 | $3,380 | $3,380 | $3,230 | $3,130 | $3,250 | |
| Direct Cost of Sales | Jan | Feb | Mar | Apr | May | Jun | Jul | Aug | Sep | Oct | Nov | Dec | |
| Linens | $125 | $125 | $125 | $125 | $125 | $125 | $125 | $125 | $125 | $125 | $125 | $125 | |
| Oils & Lotions | $50 | $0 | $0 | $50 | $0 | $0 | $50 | $0 | $0 | $50 | $0 | $0 | |
| Insurance Billing | $40 | $40 | $40 | $40 | $40 | $40 | $40 | $40 | $40 | $40 | $40 | $40 | |
| Subtotal Direct Cost of Sales | $215 | $165 | $165 | $215 | $165 | $165 | $215 | $165 | $165 | $215 | $165 | $165 | |
| Personnel Plan | |||||||||||||
| Jan | Feb | Mar | Apr | May | Jun | Jul | Aug | Sep | Oct | Nov | Dec | ||
| Owner Draw | 0% | $2,500 | $2,500 | $2,500 | $2,500 | $2,500 | $2,500 | $2,500 | $2,500 | $2,500 | $2,500 | $2,500 | $2,500 |
| Other | 0% | $0 | $0 | $0 | $0 | $0 | $0 | $0 | $0 | $0 | $0 | $0 | $0 |
| Total People | 0 | 0 | 0 | 0 | 0 | 0 | 0 | 0 | 0 | 0 | 0 | 0 | |
| Total Payroll | $2,500 | $2,500 | $2,500 | $2,500 | $2,500 | $2,500 | $2,500 | $2,500 | $2,500 | $2,500 | $2,500 | $2,500 | |
| General Assumptions | |||||||||||||
| Jan | Feb | Mar | Apr | May | Jun | Jul | Aug | Sep | Oct | Nov | Dec | ||
| Plan Month | 1 | 2 | 3 | 4 | 5 | 6 | 7 | 8 | 9 | 10 | 11 | 12 | |
| Current Interest Rate | 5.00% | 5.00% | 5.00% | 5.00% | 5.00% | 5.00% | 5.00% | 5.00% | 5.00% | 5.00% | 5.00% | 5.00% | |
| Long-term Interest Rate | 5.65% | 5.65% | 5.65% | 5.65% | 5.65% | 5.65% | 5.65% | 5.65% | 5.65% | 5.65% | 5.65% | 5.65% | |
| Tax Rate | 30.00% | 28.00% | 28.00% | 28.00% | 28.00% | 28.00% | 28.00% | 28.00% | 28.00% | 28.00% | 28.00% | 28.00% | |
| Other | 0 | 0 | 0 | 0 | 0 | 0 | 0 | 0 | 0 | 0 | 0 | 0 | |
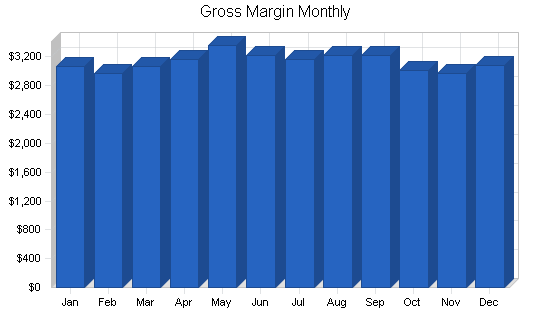
| Pro Forma Profit and Loss | |||||||||||||
| Jan | Feb | Mar | Apr | May | Jun | Jul | Aug | Sep | Oct | Nov | Dec | ||
| Sales | $3,280 | $3,130 | $3,230 | $3,380 | $3,530 | $3,380 | $3,380 | $3,380 | $3,380 | $3,230 | $3,130 | $3,250 | |
| Direct Cost of Sales | $215 | $165 | $165 | $215 | $165 | $165 | $215 | $165 | $165 | $215 | $165 | $165 | |
| Other Costs of Sales | $0 | $0 | $0 | $0 | $0 | $0 | $0 | $0 | $0 | $0 | $0 | $0 | |
| Total Cost of Sales | $215 | $165 | $165 | $215 | $165 | $165 | $215 | $165 | $165 | $215 | $165 | $165 | |
| Gross Margin | $3,065 | $2,965 | $3,065 | $3,165 | $3,365 | $3,215 | $3,165 | $3,215 | $3,215 | $3,015 | $2,965 | $3,085 | |
| Gross Margin % | 93.45% | 94.73% | 94.89% | 93.64% | 95.33% | 95.12% | 93.64% | 95.12% | 95.12% | 93.34% | 94.73% | 94.92% | |
| Expenses | |||||||||||||
| Payroll | $2,500 | $2,500 | $2,500 | $2,500 | $2,500 | $2,500 | $2,500 | $2,500 | $2,500 | $2,500 | $2,500 | $2,500 | |
| Sales and Marketing and Other Expenses | $0 | $50 | $50 | $50 | $50 | $50 | $50 | $50 | $50 | $50 | $50 | $50 | |
| Depreciation | $0 | $0 | $0 | $0 | $0 | $0 | $0 | $0 | $0 | $0 | $0 | $50 | |
| Rent (inc Utilities) | $200 | $200 | $200 | $200 | $200 | $200 | $200 | $200 | $200 | $200 | $200 | $200 | |
| Insurance | $53 | $53 | $53 | $53 | $53 | $53 | $53 | $53 | $53 | $53 | $53 | $53 | |
| Payroll Taxes | 20% | $27 | $8 | $20 | $33 | $58 | $39 | $33 | $39 | $39 | $14 | $8 | $17 |
| Other | $100 | $100 | $100 | $100 | $100 | $100 | $100 | $100 | $100 | $100 | $100 | $100 | |
| Total Operating Expenses | $2,880 | $2,911 | $2,923 | $2,936 | $2,961 | $2,942 | $2,936 | $2,942 | $2,942 | $2,917 | $2,911 | $2,970 | |
| Profit Before Interest and Taxes | $185 | $54 | $142 | $229 | $404 | $273 | $229 | $273 | $273 | $98 | $54 | $115 | |
| EBITDA | $185 | $54 | $142 | $229 | $404 | $273 | $229 | $273 | $273 | $98 | $54 | $165 | |
| Interest Expense | $0 | $0 | $0 | $0 | $0 | $0 | $0 | $0 | $0 | $0 | $0 | $0 | |
| Taxes Incurred | $56 | $15 | $40 | $64 | $113 | $76 | $64 | $76 | $76 | $27 | $15 | $32 | |
| Net Profit | $130 | $39 | $102 | $165 | $291 | $196 | $165 | $196 | $196 | $70 | $39 | $83 | |
| Net Profit/Sales | 3.95% | 1.25% | 3.16% | 4.88% | 8.24% | 5.81% | 4.88% | 5.81% | 5.81% | 2.18% | 1.25% | 2.56% | |
| Pro Forma Cash Flow | |||||||||||||
| Jan | Feb | Mar | Apr | May | Jun | Jul | Aug | Sep | Oct | Nov | Dec | ||
| Cash Received | |||||||||||||
| Cash from Operations | |||||||||||||
| Cash Sales | $2,854 | $2,723 | $2,810 | $2,941 | $3,071 | $2,941 | $2,941 | $2,941 | $2,941 | $2,810 | $2,723 | $2,828 | |
| Cash from Receivables | $250 | $264 | $426 | $407 | $421 | $440 | $458 | $439 | $439 | $439 | $439 | $419 | |
| Subtotal Cash from Operations | $3,104 | $2,987 | $3,236 | $3,348 | $3,492 | $3,381 | $3,399 | $3,380 | $3,380 | $3,250 | $3,162 | $3,247 | |
| Additional Cash Received | |||||||||||||
| Sales Tax, VAT, HST/GST Received | 0.00% | $0 | $0 | $0 | $0 | $0 | $0 | $0 | $0 | $0 | $0 | $0 | $0 |
| New Current Borrowing | $0 | $0 | $0 | $0 | $0 | $0 | $0 | $0 | $0 | $0 | $0 | $0 | |
| New Other Liabilities (interest-free) | $0 | $0 | $0 | $0 | $0 | $0 | $0 | $0 | $0 | $0 | $0 | $0 | |
| New Long-term Liabilities | $0 | $0 | $0 | $0 | $0 | $0 | $0 | $0 | $0 | $0 | $0 | $0 | |
| Sales of Other Current Assets | $0 | $0 | $0 | $0 | $0 | $0 | $0 | $0 | $0 | $0 | $0 | $0 | |
| Sales of Long-term Assets | $0 | $0 | $0 | $0 | $0 | $0 | $0 | $0 | $0 | $0 | $0 | $0 | |
| New Investment Received | $0 | $0 | $0 | $0 | $0 | $0 | $0 | $0 | $0 | $0 | $0 | $0 | |
| Subtotal Cash Received | $3,104 | $2,987 | $3,236 | $3,348 | $3,492 | $3,381 | $3,399 | $3,380 | $3,380 | $3,250 | $3,162 | $3,247 | |
| Expenditures | Jan | Feb | Mar | Apr | May | Jun | Jul | Aug | Sep | Oct | Nov | Dec | |
| Expenditures from Operations | |||||||||||||
| Cash Spending | $2,500 | $2,500 | $2,500 | $2,500 | $2,500 | $2,500 | $2,500 | $2,500 | $2,500 | $2,500 | $2,500 | $2,500 | |
| Bill Payments | $72 | $648 | $592 | $631 | $716 | $737 | $685 | $714 | $684 | $683 | $657 | $592 | |
| Subtotal Spent on Operations | $2,572 | $3,148 | $3,092 | $3,131 | $3,216 | $3,237 | $3,185 | $3,214 | $3,184 | $3,183 | $3,157 | $3,092 | |
| Additional Cash Spent | |||||||||||||
| Sales Tax, VAT, HST/GST Paid Out | $0 | $0 | $0 | $0 | $0 | $0 | $0 | $0 | $0 | $0 | $0 | $0 | |
| Principal Repayment of Current Borrowing | $0 | $0 | $0 | $0 | $0 | $0 | $0 | $0 | $0 | $0 | $0 | $0 | |
| Other Liabilities Principal Repayment | $0 | $0 | $0 | $0 | $0 | $0 | $0 | $0 | $0 | $0 | $0 | $0 | |
| Long-term Liabilities Principal Repayment | $0 | $0 | $0 | $0 | $0 | $0 | $0 | $0 | $0 | $0 | $0 | $0 | |
| Purchase Other Current Assets | $0 | $0 | $0 | $0 | $0 | $0 | $0 | $0 | $0 | $0 | $0 | $0 | |
| Purchase Long-term Assets | $0 | $0 | $0 | $0 | $0 | $0 | $0 | $0 | $0 | $0 | $0 | $0 | |
| Dividends | $0 | $0 | $0 | $0 | $0 | $0 | $0 | $0 | $0 | $0 | $0 | $0 | |
| Subtotal Cash Spent | $2,572 | $3,148 | $3,092 | $3,131 | $3,216 | $3,237 | $3,185 | $3,214 | $3,184 | $3,183 | $3,157 | $3,092 | |
| Net Cash Flow | $532 | ($161) | $144 | $217 | $276 | $143 | $214 | $166 | $196 | $67 | $5 | $155 | |
| Cash Balance | $1,532 | $1,371 | $1,515 | $1,732 | $2,007 | $2,151 | $2,365 | $2,531 | $2,727 | $2,794 | $2,798 | $2,953 | |
| Pro Forma Balance Sheet | |||||||||||||
| Jan | Feb | Mar | Apr | May | Jun | Jul | Aug | Sep | Oct | Nov | Dec | ||
| Assets | Starting Balances | ||||||||||||
| Current Assets | |||||||||||||
| Cash | $1,000 | $1,532 | $1,371 | $1,515 | $1,732 | $2,007 | $2,151 | $2,365 | $2,531 | $2,727 | $2,794 | $2,798 | $2,953 |
| Accounts Receivable | $500 | $676 | $819 | $813 | $845 | $884 | $883 | $864 | $864 | $864 | $845 | $813 | $816 |
| Other Current Assets | $50 | $50 | $50 | $50 | $50 | $50 | $50 | $50 | $50 | $50 | $50 | $50 | $50 |
| Total Current Assets | $1,550 | $2,258 | $2,240 | $2,378 | $2,627 | $2,941 | $3,084 | $3,279 | $3,445 | $3,641 | $3,688 | $3,661 | $3,819 |
| Long-term Assets | |||||||||||||
| Long-term Assets | $2,000 | $2,000 | $2,000 | $2,000 | $2,000 | $2,000 | $2,000 | $2,000 | $2,000 | $2,000 | $2,000 | $2,000 | $2,000 |
| Accumulated Depreciation | $1,200 | $1,200 | $1,200 | $1,200 | $1,200 | $1,200 | $1,200 | $1,200 | $1,200 | $1,200 | $1,200 | $1,200 | $1,250 |
| Total Long-term Assets | $800 | $800 | $800 | $800 | $800 | $800 | $800 | $800 | $800 | $800 | $800 | $800 | $750 |
| Total Assets | $2,350 | $3,058 | $3,040 | $3,178 | $3,427 | $3,741 | $3,884 | $4,079 | $4,245 | $4,441 | $4,488 | $4,461 | $4,569 |
| Liabilities and Capital | Jan | Feb | Mar | Apr | May | Jun | Jul | Aug | Sep | Oct | Nov | Dec | |
| Current Liabilities | |||||||||||||
| Accounts Payable | $50 | $629 | $571 | $607 | $691 | $715 | $661 | $691 | $661 | $661 | $638 | $571 | $596 |
| Current Borrowing | $0 | $0 | $0 | $0 | $0 | $0 | $0 | $0 | $0 | $0 | $0 | $0 | $0 |
| Other Current Liabilities | $0 | $0 | $0 | $0 | $0 | $0 | $0 | $0 | $0 | $0 | $0 | $0 | $0 |
| Subtotal Current Liabilities | $50 | $629 | $571 | $607 | $691 | $715 | $661 | $691 | $661 | $661 | $638 | $571 | $596 |
| Long-term Liabilities | $0 | $0 | $0 | $0 | $0 | $0 | $0 | $0 | $0 | $0 | $0 | $0 | $0 |
| Total Liabilities | $50 | $629 | $571 | $607 | $691 | $715 | $661 | $691 | $661 | $661 | $638 | $571 | $596 |
| Paid-in Capital | $1,200 | $1,200 | $1,200 | $1,200 | $1,200 | $1,200 | $1,200 | $1,200 | $1,200 | $1,200 | $1,200 | $1,200 | $1,200 |
| Retained Earnings | $1,100 | $1,100 | $1,100 | $1,100 | $1,100 | $1,100 | $1,100 | $1,100 | $1,100 | $1,100 | $1,100 | $1,100 | $1,100 |
| Earnings | $0 | $130 | $169 | $271 | $436 | $726 | $923 | $1,088 | $1,284 | $1,480 | $1,551 | $1,590 | $1,673 |
| Total Capital | $2,300 | $2,430 | $2,469 | $2,571 | $2,736 | $3,026 | $3,223 | $3,388 | $3,584 | $3,780 | $3,851 | $3,890 | $3,973 |
| Total Liabilities and Capital | $2,350 | $3,058 | $3,040 | $3,178 | $3,427 | $3,741 | $3,884 | $4,079 | $4,245 | $4,441 | $4,488 | $4,461 | $4,569 |
| Net Worth | $2,300 | $2,430 | $2,469 | $2,571 | $2,736 | $3,026 | $3,223 | $3,388 | $3,584 | $3,780 | $3,851 | $3,890 | $3,973 |


