
Tall Drink of Water
Executive Summary
Tonya McClendon has developed a new* elevated pet feeder component, designed several elevated feeder models around the component and built several prototypes. She plans to invest a minimum of $22,000 through a combination of personal savings and loans and is seeking additional funding to protect her feeder component and design ideas and to bring the products to market. She plans to incorporate Tall Drink of Water as a New York-based subchapter S holding corporation to shield her from personal liability and double taxation.
Ms. McClendon intends to establish her product as a brand leader in the $34 billion pet products industry, which is experiencing steady growth, but it is fragmented with no clear brand leaders producing elevated feeders.
Ms. McClendon has managerial, operational and technical experience in business, including financial services, management consulting, food service, architecture and landscape architecture, and Olympic planning. She has a strong customer service and sales foundation and is comfortable working in environments ranging from small family businesses to Fortune 500 corporations. She has a broad range of skills and experience to draw from to launch the company from start-up to stellar.
Based on her research, she is confident that a start-up pet products business that designs and sells innovative, contemporary elevated pet feeders to design professionals, pet care professionals, government agencies and individual consumers will be successful in the United States, where more than half of all American households have at least one pet dog or cat.
Sales forecasts for the first three years are modest based on the performance of competing and complementary products. First year sales are projected to total $143,800 and to increase at a rate of 10% over the following two years, reaching $248,748 by the end of Year 3. Sales are expected to improve dramatically once the brand is established.
* Based on preliminary patent searches on the U.S. Patent and Trademark Office website.

1.1 Objectives
- To be a leader in the pet feeder product market with a measurable share of the market by the end of the second year of operation, based on the design and development of:
- Innovative, functional and beautiful elevated pet feeders
- Accessories and complementary pet products
- Products that are environmentally and socially responsible
- To increase sales by at least 10% for the first three years of operation.
- To reach sales of $250,000 by the third year of operation.
1.2 Mission
Tall Drink of Water designs, develops, and markets innovative, functional and beautiful elevated pet feeders and related pet products using methods and materials that are socially and environmentally responsible. It provides a rewarding and respectful work environment with competitive compensation and benefits.
1.3 Keys to Success
Tall Drink of Water, will:
- Design and develop innovative, functional, reliable and beautiful products
- Provide a competitive guarantee for our products
- Provide exceptional customer service
- Participate in design and pet industry communities
- Support pet associations that rescue, train and promote the humane treatment of animals
- Use profits for new product development
- Promote pet safety and health
Company Summary
Tall Drink of Water is a New York-based start-up company that is developing elevated pet feeder technology and designs that are unique in the pet products market in both form and function. Its elevated pet feeder products will be marketed to design professionals, pet care professionals, government agencies and individual consumers.
2.1 Company Ownership
Tall Drink of Water is privately owned by Tonya McClendon and will file for S-Corporation status.
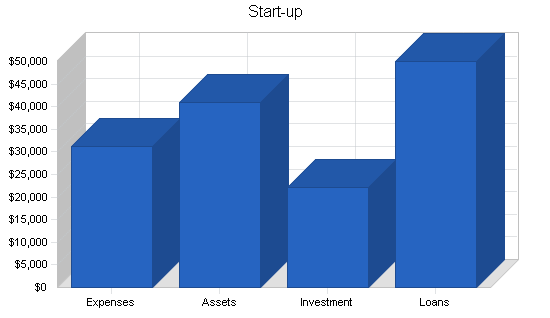
2.2 Start-up Summary
Start-up expenses for the company total $31,200 and will be distributed as follows:
- 52% – Product research and development: design fees, patent fees and prototyping.
- 19% – Corporate brand development: website design, marketing materials and advertising.
- 10% – Administrative costs: legal fees, licensing and other general administrative costs.
- 19% – Home office: interior improvements, office equipment, software and miscellaneous purchases.
We will also need a small amount for start-up inventory ($1,000), and a $40,000 cash reserve on opening to cover operating costs for the first few months.
Start-up costs will be financed using a combination of owner investment and a 2-year Small Business Administration (SBA) loan.
| Start-up Funding | |
| Start-up Expenses to Fund | $31,200 |
| Start-up Assets to Fund | $41,000 |
| Total Funding Required | $72,200 |
| Assets | |
| Non-cash Assets from Start-up | $1,000 |
| Cash Requirements from Start-up | $40,000 |
| Additional Cash Raised | $0 |
| Cash Balance on Starting Date | $40,000 |
| Total Assets | $41,000 |
| Liabilities and Capital | |
| Liabilities | |
| Current Borrowing | $50,000 |
| Long-term Liabilities | $0 |
| Accounts Payable (Outstanding Bills) | $0 |
| Other Current Liabilities (interest-free) | $0 |
| Total Liabilities | $50,000 |
| Capital | |
| Planned Investment | |
| Tonya McLendon | $22,200 |
| Other | $0 |
| Additional Investment Requirement | $0 |
| Total Planned Investment | $22,200 |
| Loss at Start-up (Start-up Expenses) | ($31,200) |
| Total Capital | ($9,000) |
| Total Capital and Liabilities | $41,000 |
| Total Funding | $72,200 |
| Start-up | |
| Requirements | |
| Start-up Expenses | |
| Product Design | $5,000 |
| Prototyping | $6,300 |
| Patent Fees | $5,000 |
| Website Design | $1,000 |
| Marketing Materials: Brochures, Banners, Signs, Trade Show Materials | $4,000 |
| Advertising | $1,000 |
| Fees: Legal, Licensing, Insurance | $2,700 |
| Stationery | $300 |
| Home Office Interior Improvements | $1,000 |
| Home Office Equipment | $1,000 |
| Software | $500 |
| Miscellaneous purchases | $500 |
| Rent | $1,700 |
| Expensed Equipment | $1,200 |
| Total Start-up Expenses | $31,200 |
| Start-up Assets | |
| Cash Required | $40,000 |
| Start-up Inventory | $1,000 |
| Other Current Assets | $0 |
| Long-term Assets | $0 |
| Total Assets | $41,000 |
| Total Requirements | $72,200 |
Products
Tall Drink of Water designs, develops and markets innovative, functional, luxury elevated pet feeders to design professionals, pet care professionals, government agencies and individual pet owners.
The products are divided into two categories, basic models and deluxe models. The basic models are off-the-shelf solutions that have the following features:
- Four standard heights: small (3″), medium (9″), large (15″) and extra large (21″).
- Three standard colors: clear, pearl (frosted) and smoke.
- One material: acrylic.
Basic models have one feeding platform that includes a water dish and food dish and a base. The small basic model is intended for small dogs and cats, while the medium through extra large sizes are intended for larger dogs. While these products cannot be customized, they can be personalized with pets’ names, pet’s photos or breed likeness.
Deluxe models can be fully customized – the options are limited only by the buyer’s (and their design professional’s) imagination. Some examples of customized options include sizes tailored for individual pets rather than based on average sizes like the basic model. Owners can add multiple platform heights to one unit or multiple water and food dishes in one unit. If purchased through a design professional, the materials, colors and design choices are limitless.
Over the next five years, the company plans to expand the pet feeder line, introduce incremental improvements to existing products and introduce complementary products, based on customer feedback.
All products will be manufactured by vendors using just-in-time (JIT) methods, unless experience determines that it is more efficient to maintain an inventory of basic models.
Market Analysis Summary
According an April 2004 American Pet Products Manufacturers Association, Inc. (APPMA) news release, pet owners are projected to spend “$2.2 billion for other [pet] services” in 2004. That’s a small portion of the more than $34 billion they will spend on all classes of pet care and product spending in 2004. The same APPMA news release reports that consumer spending on pet products has doubled from $17 billion to a projected $34 billion since 1994 when the APPMA first began tracking pet industry statistics.
One market research company, Mindbranch, states that “inadequate marketing has resulted in annual sales returns well below the level this market should deliver,” which indicates that growth in this market could be much stronger if marketing efforts were more sophisticated than they are in the current fragmented market.

Based on our industry research, we think we have opportunities to attract customers from the following market groups:
- Design professionals
- Pet care professionals
- Government agencies
- Individual consumers
The first three groups were selected because they offer growth outside of the “usual” pet products consumer; their favorable opinion of the product may help establish product reliability, brand credibility and influence individual consumer purchases.
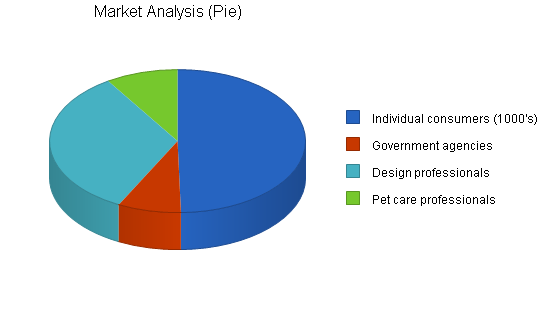
4.1 Market Segmentation
The four target market segments selected for this product are design professionals, pet care professionals, government agencies and individual consumers. Each segment is described below and illustrated in following market analysis pie chart.
Design Professionals
Interior designers, architects, and landscape architects, were selected as a target market for this product because the deluxe models are intended to be customized to meet pets’ and owners’ needs. Designers who have clients with pets will have access to a solution that is integral to their designs, not an afterthought. The 2000 U.S. Census Occupations report shows 1,926,689 people in architecture and engineering fields, but for the purposes of this plan, we used the numbers reported by professional organizations rather than Census data, because it is more specific and representative of the populations we would have access to:
- Interior designers (American Society of Interior Designers): 20,000
- Architects (American Institute of Architects): 70,000
- Landscape architects (American Society of Landscape Architects): 14,200
Pet Care Professionals
Veterinarians, breeders, kennels and pet day care centers also need access to a customized solution that works best for their clients. Veterinarians recognize the health benefits of elevated feeders for pet digestive health, as well as for the the joint, muscle and skeletal health of older pets. They also recognize the benefits and pet preference for flowing rather than stagnant water and can offer these products to clients to address those health needs. Breeders, kennels and pet day care centers all may have multiple pet facilities. Some of these facilities cater to high-end clients who want assurance that their existing or future pets are well cared for. Our customized multiple pet units can meet the pet care professionals’ needs for feeding and watering pets and the pet owners’ need to know that their pets are receiving high-quality care.
We used data from the American Veterinary Medical Association and the 2000 U.S. Census for market data for this segment:
- Veterinarians (American Veterinary Medical Association): 69,000
- Pet care except veterinary services (2000 US Census): 28,320.
Government Agencies
Police departments and fire departments use dogs as service animals. They may benefit from a customized, multiple-pet solution. Parks and recreation departments that build and maintain dog runs or dog parks may also benefit from a customized solution. In our research, we have found that New York City area dog runs often have one water dish used by hundreds of dogs throughout the day. We can offer another way for parks and recreation departments to address the need to offer hydration for pets in these locations: multiple height, water-dish-only units.
Market data for this segment was obtained from the 2002 US Government Census report that shows parks and recreation and fire protection departments as special district governments totaling 1,314 and 5,743 respectively, while state and local police agencies in 2000 totalled 17,784. Further research may indicate that this market should be further segmented to focus on New York City agencies to start.
Individual Consumers
The largest number of potential buyers for these products are individual consumers. Industry experts estimate that more than 55% of U.S. households own at least one pet cat or dog; many own multiple pets. The 2000 Census reported a total population of 281,421,960; 55% of that number represents our potential individual consumer market, 154,782,078.
We project that the individual consumer segment will grow at a rate of 10% per year, while the commercial market segment, design professionals, pet care professionals and government agencies, is forecasted to grow at a rate of 5% annually.
| Market Analysis | |||||||
| Year 1 | Year 2 | Year 3 | Year 4 | Year 5 | |||
| Potential Customers | Growth | CAGR | |||||
| Individual consumers (1000’s) | 10% | 154,782 | 170,260 | 187,286 | 206,014 | 226,616 | 10.00% |
| Government agencies | 5% | 24,841 | 26,083 | 27,387 | 28,756 | 30,194 | 5.00% |
| Design professionals | 5% | 104,200 | 109,410 | 114,881 | 120,625 | 126,656 | 5.00% |
| Pet care professionals | 5% | 28,320 | 29,736 | 31,223 | 32,784 | 34,423 | 5.00% |
| Total | 7.57% | 312,143 | 335,489 | 360,777 | 388,179 | 417,889 | 7.57% |
4.2 Target Market Segment Strategy
The initial market focus will be on the commercial market segments: design professionals, pet care professionals and government agencies. Design professionals were selected because they can recommend customized product solutions to existing pet owners as an added value to their new or remodeled home. Pet care professionals can inform, assure and influence pet owners regarding the health benefits of the products for their pets. Government agencies can offer the product as value added to attract visitors to dog runs and dog parks by demonstrating an interest in the health and well-being to pets that visit them. Other government agencies, police and fire departments that use service dogs can benefit from improved feeding and watering for the larger breed dogs typically employed for this kind of service. Together, these market segments were selected to establish product reliability, brand credibility and brand recognition.
Once the products are established in the commercial market segments, the company will introduce them to individual consumers who think of their pets as family, and are style and status conscious.
To support this strategy, we will attend industry trade shows and enter design competitions. This strategy will allow us to form partnerships with people and organizations that can help the company establish the highest level of product performance and customer service.
4.3 Industry Analysis
In an April 2003 news release, the American Pet Products Manufacturers Association (APPMA) forecasted that pet owners would spend $31 billion for the care, feeding, spoiling and pampering of their pets. According to their April 2004 news release, actual spending on pet products in 2003 was $32.4 billion, $1.4 billion more than projected. Industry researchers estimate that the industry will grow between 5% and 15% annually through 2008.
Industry experts also report that the pet products industry is competitive and highly fragmented with no clear brand leadership, and under utilized marketing opportunities. There are opportunities for successful entry to it that we intend to use to our advantage.
4.3.1 Competition and Buying Patterns
We have many competitors in the pet products industry. Direct competitors are designers and manufacturers of elevated pet feeders and complementary products such as pet fountains. In our research, we identified one direct competitor that is publicly traded, OurPet’s Company. Other competitors include, but are not limited to, private companies:
- Doskocil Manufacturing Company (LeBistro feeders and waterers)
- Veterinary Ventures, Inc. (Drinkwell fountains)
- A Charmed Life (Elevated feeders)
Indirect competitors for pet-related purchases include, but are not limited to, large public pet products corporations:
- Nestle Purina PetCare
- PETsMART
- PETCO
Large bricks and clicks retailers:
- Wal-Mart
- K-Mart
- Target
Online and catalog retailers:
- Drs. Foster & Smith
- Watson’s Pet Company
- TrendyPet.com
- Orvis
Current consumer buying habits for elevated pet feeders are driven primarily by the products’ functionality, elevating pets’ food and water dishes to a level that is healthier for them or providing flowing water, which pets not only prefer, but is also healthier for them, encouraging hydration and reducing microorganism growth that occurs in stagnant water.
Some consumers, dissatisfied by current market offerings for elevated pet feeders are building their own elevated feeders or asking friends or relatives to build them to suit their unique space, aesthetic tastes or pet needs. Others, like me, are starting companies of their own to offer products to address consumers needs for functional products that also suit the owners’ needs for products that fit their lifestyles.
Strategy and Implementation Summary
Tall Drink of Water’s strategy is to provide high-quality, functional and beautiful products that are environmentally and socially responsible. We want our products to be the standard by which similar products will be measured.
Strategic Assumptions:
- Our individual customers think of their pets as family and care about the health and well-being of their family pets.
- Many of our end-users have high quality and style expectations.
- Products adopted by the commercial market, design and pet care professionals and government agencies, will lead to brand establishment, acceptance and recognition
- Individual consumers will more readily use products used by government facilities and pet care professionals.
Profits will be used for new product development and incremental improvements for existing products, and to expand our marketing and sales efforts to foreign markets.
5.1 Competitive Edge
Our patented designs and technology will be our competitive edge. There are many elevated pet feeders in the market, but ours will be the first* to market with an integrated, elevated fountain and contemporary designs. With patent protection of the elevated feeder with an integrated fountain, we can potentially capture a large share of the market for that class of products. As patent holders of the technology, we could also license it to other manufacturers to increase revenue and have the branding benefit of being “the original” elevated feeder and integrated fountain product.
Another competitive advantage is that our products provide an off-the-shelf solution for owners of large breed dogs like Mastiffs, Newfoundlands and Great Danes that are, on average, about five inches taller than the existing large model elevated feeders on the market. Our products also address the needs of pet owners who live in small, urban apartments and appreciate contemporary design.
* Based on preliminary patent searches on the US Patent and Trademark Office web site.
5.2 Marketing Strategy
In the first year of operation, our marketing strategy will be focused on design professionals, pet care professionals and government agencies. Marketing efforts will include trade show participation, design contest entries, and advertising in industry and lifestyle magazines.
In subsequent years, we will expand our marketing efforts to include individual consumers who may be reached through advertising in lifestyle magazines and on cable television, sponsoring dog shows and competitions, and participation in regional pet events.
5.3 Sales Strategy
The company intends to focus its initial sales efforts on commercial clients, design professionals, pet care professionals and government agencies, to establish product reliability and brand recognition for the company without incurring exorbitant advertising costs. This strategy will generate fewer sales, but sales of higher priced items. The owner will identify and work with these prospects directly. Because of the potential complexity of these orders, delivery times will vary, but the consumer will be provided with an estimated delivery time and regular progress updates by e-mail or fax.
Sales to individual consumers will be completed through the company’s website, by phone or fax, through catalogues and third party websites. The owner will work with manufacturers to determine the appropriate delivery schedule for these items, but anticipates being able to offer consumers 5 – 10 business day delivery terms. FedEx will be the preferred shipping vendor.
The company does not have immediate plans to offer products for sale in retail stores, but this decision will be re-evaluated based on consumer feedback and demand.
Order processing, manufacturing, delivery and shipping will be managed using electronic data interchange (EDI) methods to minimize order processing times, facilitate order tracking and optimize customer and vendor information management.
Products will be manufactured by an independent plastics moulder with whom we have contracted. After the prototypes, they will manufacture the standard feeders in batches of 2,000, and coordinate with us to ship directly to consumers to reduce delivery time. Custom orders will require more lead- and manufacturing time, and will be coordinated with their custom-solutions department.
To ensure that we are meeting (and hopefully exceeding) customers’ expectations, consumers will be asked to complete a satisfaction survey regarding the level of service received from the beginning of the sales process to delivery and installation (where applicable), including follow-up and future service needs.
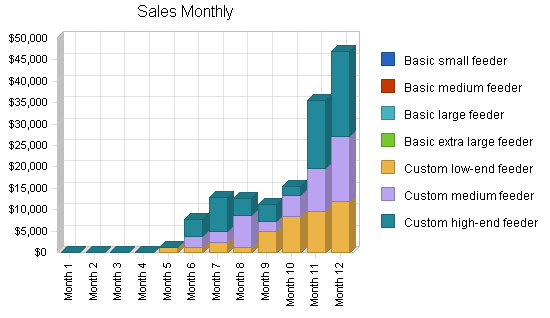
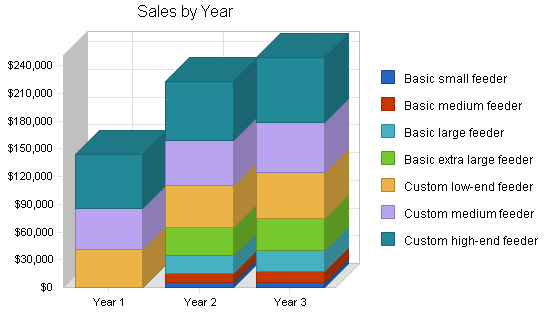
5.3.1 Sales Forecast
The sales forecast table shows a worst case scenario of forecasted sales for the first three years of operation. During the first year, our focus will be on sales to commercial consumers, design and pet care professionals and government agencies to establish product reliability and brand credibility. Sales may fluctuate seasonally for design and pet care professionals, and based on budgetary cycles for government agencies.
In the second and third years, we will expand our sales strategy to include individual consumers. The basic, off-the-shelf models, developed for high- and moderate-income consumers will be sold on the company’s website, by phone and fax, through catalogs and third party websites. Individual consumer sales may also fluctuate seasonally, but we are estimating flat monthly sales for all market segments with annual sales growth of 10% for 2006 and 2007 based on an average of the low and high end industry expert sales forecasts.
This time table is flexible and can be accelerated based on demand.
Based on current economic indicators, we set the direct cost of sales to increase at a rate of 5% for the first three years of operation. This too is flexible and can be adjusted based on changes in the economy. Cost of sales below includes manufacturing and delivery costs.
| Sales Forecast | |||
| Year 1 | Year 2 | Year 3 | |
| Sales | |||
| Basic small feeder | $0 | $5,000 | $5,750 |
| Basic medium feeder | $0 | $10,000 | $11,500 |
| Basic large feeder | $0 | $20,000 | $23,000 |
| Basic extra large feeder | $0 | $30,000 | $34,500 |
| Custom low-end feeder | $40,800 | $44,880 | $49,368 |
| Custom medium feeder | $45,000 | $49,500 | $54,450 |
| Custom high-end feeder | $58,000 | $63,800 | $70,180 |
| Total Sales | $143,800 | $223,180 | $248,748 |
| Direct Cost of Sales | Year 1 | Year 2 | Year 3 |
| Basic small feeder | $0 | $2,050 | $2,358 |
| Basic medium feeder | $0 | $4,100 | $4,715 |
| Basic large feeder | $0 | $8,200 | $9,430 |
| Basic extra large feeder | $0 | $12,300 | $14,145 |
| Custom low-end feeder | $17,000 | $17,325 | $18,191 |
| Custom medium feeder | $11,400 | $11,970 | $12,569 |
| Custom high-end feeder | $11,200 | $11,200 | $11,200 |
| Subtotal Direct Cost of Sales | $39,600 | $67,145 | $72,607 |
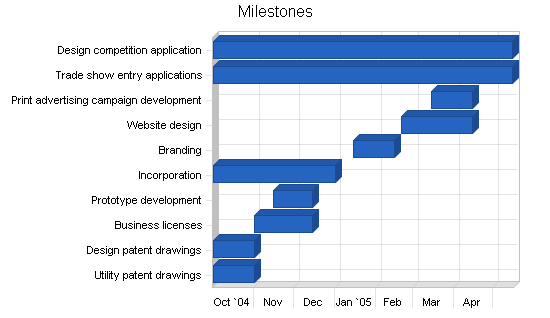
5.4 Milestones
The accompanying table lists milestones for our start up goals and budgets for each. Tonya McClendon will be the manager in charge of each milestone, consultants will be used for many functions. The milestone schedule shows our emphasis on planning for design, development and market introduction.
Additional milestone tables will be created for future marketing and sales planning.
| Milestones | |||||
| Milestone | Start Date | End Date | Budget | Manager | Department |
| Utility patent drawings | 10/1/2004 | 11/1/2004 | $2,500 | TLM | Consultant |
| Design patent drawings | 10/1/2004 | 11/1/2004 | $2,500 | TLM | Consultant |
| Business licenses | 11/1/2004 | 12/15/2004 | $250 | TLM | Admin |
| Prototype development | 11/15/2004 | 12/15/2004 | $6,300 | TLM | Consultant |
| Incorporation | 10/1/2004 | 1/1/2005 | $250 | TLM | Admin |
| Branding | 1/15/2005 | 2/15/2005 | $4,000 | TLM | Consultant |
| Website design | 2/20/2005 | 4/15/2005 | $1,000 | TLM | Consultant |
| Print advertising campaign development | 3/15/2005 | 4/15/2005 | $1,000 | TLM | Consultant |
| Trade show entry applications | 10/1/2004 | 5/15/2005 | $750 | TLM | Marketing |
| Design competition application | 10/1/2004 | 5/15/2005 | $750 | TLM | Marketing |
| Totals | $19,300 | ||||
Web Plan Summary
Tall Drink of Water’s website will be the virtual storefront for consumers interested in:
- Company information
- Contacting the company
- Buying products
- Product and services information
- Product demonstrations
- Locating design professionals
- Customer testimonials
- Pet health and wellness information
Tall Drink of Water plans a well-designed and sophisticated website. The key to the website strategy will be combining great design on the front end, with a powerful back end capable of managing customer information, monitoring customer orders and delivery status; as well as managing vendor information.
Initially, the website will provide information and direct commercial customers to phone and mail purchasing options. In years two and three we will add e-commerce capabilities to serve our individual consumers.
6.1 Website Marketing Strategy
Marketing an Internet retail business depends on brand recognition and the consumer’s ability to find the business easily. Our strategy includes:
- Positioning the website as a featured link on major search engines and on complementary sites
- Including the website address on corporate press releases and marketing materials
- Including the website address on all products
- Word-of-mouth.
6.2 Development Requirements
Tall Drink of Water’s website will be developed and maintained by consultants with the ability to measure, analyze and report site activity as well as make recommendations for improvements. website usability testing will be conducted throughout the design process to ensure that the site is both useful and usable to consumers.
The site will be hosted by an Internet Service Provider (ISP) that is reliable, has the ability to grow with our business and that supports electronic data interchange (EDI). It will be imperative for our website to function as consumers expect to reinforce the brand’s credibility and reliability.
Management Summary
Tonya McClendon will be the principal owner and operator of Tall Drink of Water Ms. McClendon has managerial, operational and technical experience in financial services, management consulting, food service, architecture and landscape architecture, and Olympic planning. She has a strong customer service and sales foundation and is comfortable working in environments ranging from small family businesses to Fortune 500 corporations. She has a Bachelor of Arts in Psychology, is studying to become a Certified Usability Analyst (CUA) and is working toward an MBA in Global Management.
Ms. McClendon has a passion for pets, architecture, interior and industrial design. She is looking forward to offering beautiful products of exceptional quality to pets and the people who love them.
7.1 Personnel Plan
Tall Drink of Water will initially have one full-time employee, the owner, Tonya McClendon. In the first seven months, Tonya will be responsible for all aspects of the business, from design, to coordinating with the contracted manufacturer, to taking orders and performing customer service. As part of our initial marketing campaign, Tonya will spend a great deal of time in the first few months demonstrating the feeders at pet care trade shows and liaising with government officials and design professionals.
Once sales begin to climb, we will hire a second person to take over inventory and office management. This person will coordinate orders and deliveries, pay bills, and provide back-up customer service coverage. In the second and third years we plan to hire a part-time sales representative to expand our commercial sales nationally.
The personnel plan will be evaluated regularly and, as growth requires it, a detailed personnel plan will be developed based on business needs with guidance from the Occupational Outlook Handbook and staffing agencies.
Our website, marketing and trade show activities are being undertaken under the advice of independently contracted consultants familiar with the pet-care industry.
| Personnel Plan | |||
| Year 1 | Year 2 | Year 3 | |
| TL McClendon | $28,800 | $32,000 | $37,000 |
| Part-time Sales Rep | $0 | $10,000 | $13,000 |
| Inventory/Office Mgmt. | $10,425 | $28,000 | $30,000 |
| Total People | 2 | 3 | 3 |
| Total Payroll | $39,225 | $70,000 | $80,000 |
Financial Plan
We expect sales growth will be slow to moderate, and that cash flows will be steady with annual sales projected to equal $143,800, $223,180 and $248,748 for the years 2005 – 2007.
Once the company reaches a sufficient level of profitability and accumulates a cash reserve, it plans to invest 50% of profits in research and development of new products, existing product and operational improvements, and to expand marketing and sales efforts to foreign markets. 38% of profits will be invested in low risk financial instruments. 10% of profits will be used for employee bonuses. 1% of profits will be used to support non-profit organizations that support the health and welfare of women in the United States. The remaining 1% will be used to support non-profit organizations that promote the health and welfare of pets in the United States. These expenses will be itemized in the later years of the business plans.
In the event that the company does not earn a profit, additional funds will be sought to finance research and development (R&D) activities. 100% of funding obtained during break-even or loss periods will be used for R&D, while the investment in financial instruments, employee bonuses and charitable giving activities will be foregone.
8.1 General Assumptions
The general assumptions for this plan are shown in the following table.
| General Assumptions | |||
| Year 1 | Year 2 | Year 3 | |
| Plan Month | 1 | 2 | 3 |
| Current Interest Rate | 10.00% | 10.00% | 10.00% |
| Long-term Interest Rate | 10.00% | 10.00% | 10.00% |
| Tax Rate | 30.00% | 30.00% | 30.00% |
| Other | 0 | 0 | 0 |
8.2 Break-even Analysis
The following break-even analysis table and chart show that with average estimated monthly fixed cost of $7,325 and a 28% variable cost, the company needs to generate approximately $10,000 in sales to break even.

| Break-even Analysis | |
| Monthly Revenue Break-even | $9,438 |
| Assumptions: | |
| Average Percent Variable Cost | 28% |
| Estimated Monthly Fixed Cost | $6,839 |
8.3 Projected Profit and Loss
We will operate at a profit beginning in the first year based on our worst case sales forecasts. Though we project that we will operate at a loss for the first six months, we will make up for the losses in the second half of 2005 to break even for the year. We also anticipate earning a profit in subsequent years. These projections are conservatively based on solid market research and initial responses from local pet care professionals.


| Pro Forma Profit and Loss | |||
| Year 1 | Year 2 | Year 3 | |
| Sales | $143,800 | $223,180 | $248,748 |
| Direct Cost of Sales | $39,600 | $67,145 | $72,607 |
| Other Costs of Goods | $0 | $0 | $0 |
| Total Cost of Sales | $39,600 | $67,145 | $72,607 |
| Gross Margin | $104,200 | $156,035 | $176,141 |
| Gross Margin % | 72.46% | 69.91% | 70.81% |
| Expenses | |||
| Payroll | $39,225 | $70,000 | $80,000 |
| Sales and Marketing and Other Expenses | $5,000 | $5,000 | $5,000 |
| Depreciation | $0 | $0 | $0 |
| Rent | $20,400 | $20,400 | $20,400 |
| Utilities | $2,400 | $2,400 | $2,400 |
| Insurance | $238 | $238 | $238 |
| Payroll Taxes | $0 | $0 | $0 |
| Web site management | $6,400 | $12,000 | $15,000 |
| Business travel | $6,000 | $8,000 | $10,000 |
| Miscellaneous | $2,400 | $3,000 | $5,000 |
| Total Operating Expenses | $82,063 | $121,038 | $138,038 |
| Profit Before Interest and Taxes | $22,137 | $34,997 | $38,103 |
| EBITDA | $22,137 | $34,997 | $38,103 |
| Interest Expense | $4,461 | $3,506 | $2,510 |
| Taxes Incurred | $5,303 | $9,447 | $10,678 |
| Net Profit | $12,374 | $22,044 | $24,915 |
| Net Profit/Sales | 8.60% | 9.88% | 10.02% |
8.4 Projected Cash Flow
The cash flow table shows that cash flow for our worst case sales scenario (i.e., slow sales for the first three years) provides steady cash balance increases. Once the loan is fully repaid, the cash balance should provide a cushion for future expenses.
The cash flow chart shows monthly projections for 2005.

| Pro Forma Cash Flow | |||
| Year 1 | Year 2 | Year 3 | |
| Cash Received | |||
| Cash from Operations | |||
| Cash Sales | $35,950 | $55,795 | $62,187 |
| Cash from Receivables | $46,790 | $133,679 | $175,704 |
| Subtotal Cash from Operations | $82,740 | $189,474 | $237,891 |
| Additional Cash Received | |||
| Sales Tax, VAT, HST/GST Received | $0 | $0 | $0 |
| New Current Borrowing | $0 | $0 | $0 |
| New Other Liabilities (interest-free) | $0 | $0 | $0 |
| New Long-term Liabilities | $0 | $0 | $0 |
| Sales of Other Current Assets | $0 | $0 | $0 |
| Sales of Long-term Assets | $0 | $0 | $0 |
| New Investment Received | $75,000 | $0 | $0 |
| Subtotal Cash Received | $157,740 | $189,474 | $237,891 |
| Expenditures | Year 1 | Year 2 | Year 3 |
| Expenditures from Operations | |||
| Cash Spending | $39,225 | $70,000 | $80,000 |
| Bill Payments | $78,089 | $155,278 | $145,235 |
| Subtotal Spent on Operations | $117,314 | $225,278 | $225,235 |
| Additional Cash Spent | |||
| Sales Tax, VAT, HST/GST Paid Out | $0 | $0 | $0 |
| Principal Repayment of Current Borrowing | $9,960 | $9,960 | $9,960 |
| Other Liabilities Principal Repayment | $0 | $0 | $0 |
| Long-term Liabilities Principal Repayment | $0 | $0 | $0 |
| Purchase Other Current Assets | $0 | $0 | $0 |
| Purchase Long-term Assets | $0 | $0 | $0 |
| Dividends | $0 | $0 | $0 |
| Subtotal Cash Spent | $127,274 | $235,238 | $235,195 |
| Net Cash Flow | $30,466 | ($45,764) | $2,696 |
| Cash Balance | $70,466 | $24,702 | $27,398 |
8.5 Projected Balance Sheet
Our projected balance sheet is shown in the following table. Monthly projections are shown in the appendix. The Balance Sheet, even with these conservative forecasts, shows a steadily increasing net worth.
| Pro Forma Balance Sheet | |||
| Year 1 | Year 2 | Year 3 | |
| Assets | |||
| Current Assets | |||
| Cash | $70,466 | $24,702 | $27,398 |
| Accounts Receivable | $61,060 | $94,766 | $105,623 |
| Inventory | $13,310 | $22,568 | $24,404 |
| Other Current Assets | $0 | $0 | $0 |
| Total Current Assets | $144,836 | $142,037 | $157,425 |
| Long-term Assets | |||
| Long-term Assets | $0 | $0 | $0 |
| Accumulated Depreciation | $0 | $0 | $0 |
| Total Long-term Assets | $0 | $0 | $0 |
| Total Assets | $144,836 | $142,037 | $157,425 |
| Liabilities and Capital | Year 1 | Year 2 | Year 3 |
| Current Liabilities | |||
| Accounts Payable | $26,422 | $11,539 | $11,973 |
| Current Borrowing | $40,040 | $30,080 | $20,120 |
| Other Current Liabilities | $0 | $0 | $0 |
| Subtotal Current Liabilities | $66,462 | $41,619 | $32,093 |
| Long-term Liabilities | $0 | $0 | $0 |
| Total Liabilities | $66,462 | $41,619 | $32,093 |
| Paid-in Capital | $97,200 | $97,200 | $97,200 |
| Retained Earnings | ($31,200) | ($18,826) | $3,217 |
| Earnings | $12,374 | $22,044 | $24,915 |
| Total Capital | $78,374 | $100,417 | $125,332 |
| Total Liabilities and Capital | $144,836 | $142,037 | $157,425 |
| Net Worth | $78,374 | $100,417 | $125,332 |
8.6 Business Ratios
The following table outlines some of the more important ratios from the Pet Supplies industry. The final column, Industry Profile, details specific ratios based on the industry as it is classified by the Standard Industry Classification (SIC) code, 5999.1103.
Our asset ratios differ from the industry standard for two reasons:
- Because we are operating initially as a home office with outsourced manufacturing, we do not require any long-term assets at this stage.
- Because our first sales approaches are to other professionals and the government, rather than to individual consumers, we have a higher percentage of assets as accounts receivable.
| Ratio Analysis | ||||
| Year 1 | Year 2 | Year 3 | Industry Profile | |
| Sales Growth | 0.00% | 55.20% | 11.46% | 1.08% |
| Percent of Total Assets | ||||
| Accounts Receivable | 42.16% | 66.72% | 67.09% | 22.01% |
| Inventory | 9.19% | 15.89% | 15.50% | 18.65% |
| Other Current Assets | 0.00% | 0.00% | 0.00% | 36.34% |
| Total Current Assets | 100.00% | 100.00% | 100.00% | 77.00% |
| Long-term Assets | 0.00% | 0.00% | 0.00% | 23.00% |
| Total Assets | 100.00% | 100.00% | 100.00% | 100.00% |
| Current Liabilities | 45.89% | 29.30% | 20.39% | 27.21% |
| Long-term Liabilities | 0.00% | 0.00% | 0.00% | 18.98% |
| Total Liabilities | 45.89% | 29.30% | 20.39% | 46.19% |
| Net Worth | 54.11% | 70.70% | 79.61% | 53.81% |
| Percent of Sales | ||||
| Sales | 100.00% | 100.00% | 100.00% | 100.00% |
| Gross Margin | 72.46% | 69.91% | 70.81% | 38.34% |
| Selling, General & Administrative Expenses | 49.91% | 49.23% | 49.60% | 15.66% |
| Advertising Expenses | 0.00% | 0.00% | 0.00% | 1.52% |
| Profit Before Interest and Taxes | 15.39% | 15.68% | 15.32% | 3.70% |
| Main Ratios | ||||
| Current | 2.18 | 3.41 | 4.91 | 1.83 |
| Quick | 1.98 | 2.87 | 4.14 | 1.01 |
| Total Debt to Total Assets | 45.89% | 29.30% | 20.39% | 58.09% |
| Pre-tax Return on Net Worth | 22.55% | 31.36% | 28.40% | 3.95% |
| Pre-tax Return on Assets | 12.20% | 22.17% | 22.61% | 9.42% |
| Additional Ratios | Year 1 | Year 2 | Year 3 | |
| Net Profit Margin | 8.60% | 9.88% | 10.02% | n.a |
| Return on Equity | 15.79% | 21.95% | 19.88% | n.a |
| Activity Ratios | ||||
| Accounts Receivable Turnover | 1.77 | 1.77 | 1.77 | n.a |
| Collection Days | 50 | 170 | 196 | n.a |
| Inventory Turnover | 8.74 | 3.74 | 3.09 | n.a |
| Accounts Payable Turnover | 3.96 | 12.17 | 12.17 | n.a |
| Payment Days | 27 | 49 | 29 | n.a |
| Total Asset Turnover | 0.99 | 1.57 | 1.58 | n.a |
| Debt Ratios | ||||
| Debt to Net Worth | 0.85 | 0.41 | 0.26 | n.a |
| Current Liab. to Liab. | 1.00 | 1.00 | 1.00 | n.a |
| Liquidity Ratios | ||||
| Net Working Capital | $78,374 | $100,417 | $125,332 | n.a |
| Interest Coverage | 4.96 | 9.98 | 15.18 | n.a |
| Additional Ratios | ||||
| Assets to Sales | 1.01 | 0.64 | 0.63 | n.a |
| Current Debt/Total Assets | 46% | 29% | 20% | n.a |
| Acid Test | 1.06 | 0.59 | 0.85 | n.a |
| Sales/Net Worth | 1.83 | 2.22 | 1.98 | n.a |
| Dividend Payout | 0.00 | 0.00 | 0.00 | n.a |
Appendix
| Sales Forecast | |||||||||||||
| Month 1 | Month 2 | Month 3 | Month 4 | Month 5 | Month 6 | Month 7 | Month 8 | Month 9 | Month 10 | Month 11 | Month 12 | ||
| Sales | |||||||||||||
| Basic small feeder | 0% | $0 | $0 | $0 | $0 | $0 | $0 | $0 | $0 | $0 | $0 | $0 | $0 |
| Basic medium feeder | 0% | $0 | $0 | $0 | $0 | $0 | $0 | $0 | $0 | $0 | $0 | $0 | $0 |
| Basic large feeder | 0% | $0 | $0 | $0 | $0 | $0 | $0 | $0 | $0 | $0 | $0 | $0 | $0 |
| Basic extra large feeder | 0% | $0 | $0 | $0 | $0 | $0 | $0 | $0 | $0 | $0 | $0 | $0 | $0 |
| Custom low-end feeder | 0% | $0 | $0 | $0 | $0 | $1,200 | $1,200 | $2,400 | $1,200 | $4,800 | $8,400 | $9,600 | $12,000 |
| Custom medium feeder | 0% | $0 | $0 | $0 | $0 | $0 | $2,500 | $2,500 | $7,500 | $2,500 | $5,000 | $10,000 | $15,000 |
| Custom high-end feeder | 0% | $0 | $0 | $0 | $0 | $0 | $4,000 | $8,000 | $4,000 | $4,000 | $2,000 | $16,000 | $20,000 |
| Total Sales | $0 | $0 | $0 | $0 | $1,200 | $7,700 | $12,900 | $12,700 | $11,300 | $15,400 | $35,600 | $47,000 | |
| Direct Cost of Sales | Month 1 | Month 2 | Month 3 | Month 4 | Month 5 | Month 6 | Month 7 | Month 8 | Month 9 | Month 10 | Month 11 | Month 12 | |
| Basic small feeder | $0 | $0 | $0 | $0 | $0 | $0 | $0 | $0 | $0 | $0 | $0 | $0 | |
| Basic medium feeder | $0 | $0 | $0 | $0 | $0 | $0 | $0 | $0 | $0 | $0 | $0 | $0 | |
| Basic large feeder | $0 | $0 | $0 | $0 | $0 | $0 | $0 | $0 | $0 | $0 | $0 | $0 | |
| Basic extra large feeder | $0 | $0 | $0 | $0 | $0 | $0 | $0 | $0 | $0 | $0 | $0 | $0 | |
| Custom low-end feeder | $0 | $0 | $0 | $0 | $500 | $500 | $1,000 | $500 | $2,000 | $3,500 | $4,000 | $5,000 | |
| Custom medium feeder | $0 | $0 | $0 | $0 | $0 | $600 | $1,200 | $1,800 | $600 | $1,200 | $2,400 | $3,600 | |
| Custom high-end feeder | $0 | $0 | $0 | $0 | $0 | $700 | $1,400 | $700 | $700 | $1,400 | $2,800 | $3,500 | |
| Subtotal Direct Cost of Sales | $0 | $0 | $0 | $0 | $500 | $1,800 | $3,600 | $3,000 | $3,300 | $6,100 | $9,200 | $12,100 | |
| Personnel Plan | |||||||||||||
| Month 1 | Month 2 | Month 3 | Month 4 | Month 5 | Month 6 | Month 7 | Month 8 | Month 9 | Month 10 | Month 11 | Month 12 | ||
| TL McClendon | 0% | $2,400 | $2,400 | $2,400 | $2,400 | $2,400 | $2,400 | $2,400 | $2,400 | $2,400 | $2,400 | $2,400 | $2,400 |
| Part-time Sales Rep | 0% | $0 | $0 | $0 | $0 | $0 | $0 | $0 | $0 | $0 | $0 | $0 | $0 |
| Inventory/Office Mgmt. | 0% | $0 | $0 | $0 | $0 | $0 | $0 | $0 | $2,085 | $2,085 | $2,085 | $2,085 | $2,085 |
| Total People | 1 | 1 | 1 | 1 | 1 | 1 | 1 | 2 | 2 | 2 | 2 | 2 | |
| Total Payroll | $2,400 | $2,400 | $2,400 | $2,400 | $2,400 | $2,400 | $2,400 | $4,485 | $4,485 | $4,485 | $4,485 | $4,485 | |
| General Assumptions | |||||||||||||
| Month 1 | Month 2 | Month 3 | Month 4 | Month 5 | Month 6 | Month 7 | Month 8 | Month 9 | Month 10 | Month 11 | Month 12 | ||
| Plan Month | 1 | 2 | 3 | 4 | 5 | 6 | 7 | 8 | 9 | 10 | 11 | 12 | |
| Current Interest Rate | 10.00% | 10.00% | 10.00% | 10.00% | 10.00% | 10.00% | 10.00% | 10.00% | 10.00% | 10.00% | 10.00% | 10.00% | |
| Long-term Interest Rate | 10.00% | 10.00% | 10.00% | 10.00% | 10.00% | 10.00% | 10.00% | 10.00% | 10.00% | 10.00% | 10.00% | 10.00% | |
| Tax Rate | 30.00% | 30.00% | 30.00% | 30.00% | 30.00% | 30.00% | 30.00% | 30.00% | 30.00% | 30.00% | 30.00% | 30.00% | |
| Other | 0 | 0 | 0 | 0 | 0 | 0 | 0 | 0 | 0 | 0 | 0 | 0 | |
| Pro Forma Profit and Loss | |||||||||||||
| Month 1 | Month 2 | Month 3 | Month 4 | Month 5 | Month 6 | Month 7 | Month 8 | Month 9 | Month 10 | Month 11 | Month 12 | ||
| Sales | $0 | $0 | $0 | $0 | $1,200 | $7,700 | $12,900 | $12,700 | $11,300 | $15,400 | $35,600 | $47,000 | |
| Direct Cost of Sales | $0 | $0 | $0 | $0 | $500 | $1,800 | $3,600 | $3,000 | $3,300 | $6,100 | $9,200 | $12,100 | |
| Other Costs of Goods | $0 | $0 | $0 | $0 | $0 | $0 | $0 | $0 | $0 | $0 | $0 | $0 | |
| Total Cost of Sales | $0 | $0 | $0 | $0 | $500 | $1,800 | $3,600 | $3,000 | $3,300 | $6,100 | $9,200 | $12,100 | |
| Gross Margin | $0 | $0 | $0 | $0 | $700 | $5,900 | $9,300 | $9,700 | $8,000 | $9,300 | $26,400 | $34,900 | |
| Gross Margin % | 0.00% | 0.00% | 0.00% | 0.00% | 58.33% | 76.62% | 72.09% | 76.38% | 70.80% | 60.39% | 74.16% | 74.26% | |
| Expenses | |||||||||||||
| Payroll | $2,400 | $2,400 | $2,400 | $2,400 | $2,400 | $2,400 | $2,400 | $4,485 | $4,485 | $4,485 | $4,485 | $4,485 | |
| Sales and Marketing and Other Expenses | $417 | $417 | $417 | $417 | $417 | $417 | $417 | $417 | $417 | $417 | $417 | $417 | |
| Depreciation | $0 | $0 | $0 | $0 | $0 | $0 | $0 | $0 | $0 | $0 | $0 | $0 | |
| Rent | $1,700 | $1,700 | $1,700 | $1,700 | $1,700 | $1,700 | $1,700 | $1,700 | $1,700 | $1,700 | $1,700 | $1,700 | |
| Utilities | $200 | $200 | $200 | $200 | $200 | $200 | $200 | $200 | $200 | $200 | $200 | $200 | |
| Insurance | $20 | $20 | $20 | $20 | $20 | $20 | $20 | $20 | $20 | $20 | $20 | $20 | |
| Payroll Taxes | 15% | $0 | $0 | $0 | $0 | $0 | $0 | $0 | $0 | $0 | $0 | $0 | $0 |
| Web site management | $0 | $0 | $0 | $0 | $800 | $800 | $800 | $800 | $800 | $800 | $800 | $800 | |
| Business travel | 15% | $500 | $500 | $500 | $500 | $500 | $500 | $500 | $500 | $500 | $500 | $500 | $500 |
| Miscellaneous | $200 | $200 | $200 | $200 | $200 | $200 | $200 | $200 | $200 | $200 | $200 | $200 | |
| Total Operating Expenses | $5,437 | $5,437 | $5,437 | $5,437 | $6,237 | $6,237 | $6,237 | $8,322 | $8,322 | $8,322 | $8,322 | $8,322 | |
| Profit Before Interest and Taxes | ($5,437) | ($5,437) | ($5,437) | ($5,437) | ($5,537) | ($337) | $3,064 | $1,379 | ($322) | $979 | $18,079 | $26,579 | |
| EBITDA | ($5,437) | ($5,437) | ($5,437) | ($5,437) | ($5,537) | ($337) | $3,064 | $1,379 | ($322) | $979 | $18,079 | $26,579 | |
| Interest Expense | $410 | $403 | $396 | $389 | $382 | $375 | $368 | $361 | $354 | $348 | $341 | $334 | |
| Taxes Incurred | ($1,754) | ($1,752) | ($1,750) | ($1,748) | ($1,776) | ($214) | $809 | $305 | ($203) | $189 | $5,321 | $7,873 | |
| Net Profit | ($4,092) | ($4,088) | ($4,083) | ($4,078) | ($4,143) | ($498) | $1,887 | $712 | ($473) | $442 | $12,417 | $18,371 | |
| Net Profit/Sales | 0.00% | 0.00% | 0.00% | 0.00% | -345.25% | -6.47% | 14.63% | 5.61% | -4.19% | 2.87% | 34.88% | 39.09% | |
| Pro Forma Cash Flow | |||||||||||||
| Month 1 | Month 2 | Month 3 | Month 4 | Month 5 | Month 6 | Month 7 | Month 8 | Month 9 | Month 10 | Month 11 | Month 12 | ||
| Cash Received | |||||||||||||
| Cash from Operations | |||||||||||||
| Cash Sales | $0 | $0 | $0 | $0 | $300 | $1,925 | $3,225 | $3,175 | $2,825 | $3,850 | $8,900 | $11,750 | |
| Cash from Receivables | $0 | $0 | $0 | $0 | $0 | $30 | $1,063 | $5,905 | $9,670 | $9,490 | $8,578 | $12,055 | |
| Subtotal Cash from Operations | $0 | $0 | $0 | $0 | $300 | $1,955 | $4,288 | $9,080 | $12,495 | $13,340 | $17,478 | $23,805 | |
| Additional Cash Received | |||||||||||||
| Sales Tax, VAT, HST/GST Received | 0.00% | $0 | $0 | $0 | $0 | $0 | $0 | $0 | $0 | $0 | $0 | $0 | $0 |
| New Current Borrowing | $0 | $0 | $0 | $0 | $0 | $0 | $0 | $0 | $0 | $0 | $0 | $0 | |
| New Other Liabilities (interest-free) | $0 | $0 | $0 | $0 | $0 | $0 | $0 | $0 | $0 | $0 | $0 | $0 | |
| New Long-term Liabilities | $0 | $0 | $0 | $0 | $0 | $0 | $0 | $0 | $0 | $0 | $0 | $0 | |
| Sales of Other Current Assets | $0 | $0 | $0 | $0 | $0 | $0 | $0 | $0 | $0 | $0 | $0 | $0 | |
| Sales of Long-term Assets | $0 | $0 | $0 | $0 | $0 | $0 | $0 | $0 | $0 | $0 | $0 | $0 | |
| New Investment Received | $0 | $0 | $0 | $0 | $50,000 | $0 | $0 | $0 | $25,000 | $0 | $0 | $0 | |
| Subtotal Cash Received | $0 | $0 | $0 | $0 | $50,300 | $1,955 | $4,288 | $9,080 | $37,495 | $13,340 | $17,478 | $23,805 | |
| Expenditures | Month 1 | Month 2 | Month 3 | Month 4 | Month 5 | Month 6 | Month 7 | Month 8 | Month 9 | Month 10 | Month 11 | Month 12 | |
| Expenditures from Operations | |||||||||||||
| Cash Spending | $2,400 | $2,400 | $2,400 | $2,400 | $2,400 | $2,400 | $2,400 | $4,485 | $4,485 | $4,485 | $4,485 | $4,485 | |
| Bill Payments | $56 | $1,692 | $1,687 | $1,683 | $1,803 | $5,495 | $7,032 | $7,996 | $7,486 | $7,201 | $13,674 | $22,283 | |
| Subtotal Spent on Operations | $2,456 | $4,092 | $4,087 | $4,083 | $4,203 | $7,895 | $9,432 | $12,481 | $11,971 | $11,686 | $18,159 | $26,768 | |
| Additional Cash Spent | |||||||||||||
| Sales Tax, VAT, HST/GST Paid Out | $0 | $0 | $0 | $0 | $0 | $0 | $0 | $0 | $0 | $0 | $0 | $0 | |
| Principal Repayment of Current Borrowing | $830 | $830 | $830 | $830 | $830 | $830 | $830 | $830 | $830 | $830 | $830 | $830 | |
| Other Liabilities Principal Repayment | $0 | $0 | $0 | $0 | $0 | $0 | $0 | $0 | $0 | $0 | $0 | $0 | |
| Long-term Liabilities Principal Repayment | $0 | $0 | $0 | $0 | $0 | $0 | $0 | $0 | $0 | $0 | $0 | $0 | |
| Purchase Other Current Assets | $0 | $0 | $0 | $0 | $0 | $0 | $0 | $0 | $0 | $0 | $0 | $0 | |
| Purchase Long-term Assets | $0 | $0 | $0 | $0 | $0 | $0 | $0 | $0 | $0 | $0 | $0 | $0 | |
| Dividends | $0 | $0 | $0 | $0 | $0 | $0 | $0 | $0 | $0 | $0 | $0 | $0 | |
| Subtotal Cash Spent | $3,286 | $4,922 | $4,917 | $4,913 | $5,033 | $8,725 | $10,262 | $13,311 | $12,801 | $12,516 | $18,989 | $27,598 | |
| Net Cash Flow | ($3,286) | ($4,922) | ($4,917) | ($4,913) | $45,267 | ($6,770) | ($5,975) | ($4,231) | $24,694 | $824 | ($1,512) | ($3,793) | |
| Cash Balance | $36,714 | $31,791 | $26,874 | $21,961 | $67,228 | $60,458 | $54,484 | $50,252 | $74,947 | $75,770 | $74,259 | $70,466 | |
| Pro Forma Balance Sheet | |||||||||||||
| Month 1 | Month 2 | Month 3 | Month 4 | Month 5 | Month 6 | Month 7 | Month 8 | Month 9 | Month 10 | Month 11 | Month 12 | ||
| Assets | Starting Balances | ||||||||||||
| Current Assets | |||||||||||||
| Cash | $40,000 | $36,714 | $31,791 | $26,874 | $21,961 | $67,228 | $60,458 | $54,484 | $50,252 | $74,947 | $75,770 | $74,259 | $70,466 |
| Accounts Receivable | $0 | $0 | $0 | $0 | $0 | $900 | $6,645 | $15,258 | $18,878 | $17,683 | $19,743 | $37,865 | $61,060 |
| Inventory | $1,000 | $1,000 | $1,000 | $1,000 | $1,000 | $3,500 | $4,700 | $4,100 | $4,100 | $3,800 | $6,710 | $10,120 | $13,310 |
| Other Current Assets | $0 | $0 | $0 | $0 | $0 | $0 | $0 | $0 | $0 | $0 | $0 | $0 | $0 |
| Total Current Assets | $41,000 | $37,714 | $32,791 | $27,874 | $22,961 | $71,628 | $71,803 | $73,841 | $73,230 | $96,429 | $102,223 | $122,244 | $144,836 |
| Long-term Assets | |||||||||||||
| Long-term Assets | $0 | $0 | $0 | $0 | $0 | $0 | $0 | $0 | $0 | $0 | $0 | $0 | $0 |
| Accumulated Depreciation | $0 | $0 | $0 | $0 | $0 | $0 | $0 | $0 | $0 | $0 | $0 | $0 | $0 |
| Total Long-term Assets | $0 | $0 | $0 | $0 | $0 | $0 | $0 | $0 | $0 | $0 | $0 | $0 | $0 |
| Total Assets | $41,000 | $37,714 | $32,791 | $27,874 | $22,961 | $71,628 | $71,803 | $73,841 | $73,230 | $96,429 | $102,223 | $122,244 | $144,836 |
| Liabilities and Capital | Month 1 | Month 2 | Month 3 | Month 4 | Month 5 | Month 6 | Month 7 | Month 8 | Month 9 | Month 10 | Month 11 | Month 12 | |
| Current Liabilities | |||||||||||||
| Accounts Payable | $0 | $1,636 | $1,631 | $1,627 | $1,622 | $5,262 | $6,765 | $7,746 | $7,253 | $6,755 | $12,937 | $21,372 | $26,422 |
| Current Borrowing | $50,000 | $49,170 | $48,340 | $47,510 | $46,680 | $45,850 | $45,020 | $44,190 | $43,360 | $42,530 | $41,700 | $40,870 | $40,040 |
| Other Current Liabilities | $0 | $0 | $0 | $0 | $0 | $0 | $0 | $0 | $0 | $0 | $0 | $0 | $0 |
| Subtotal Current Liabilities | $50,000 | $50,806 | $49,971 | $49,137 | $48,302 | $51,112 | $51,785 | $51,936 | $50,613 | $49,285 | $54,637 | $62,242 | $66,462 |
| Long-term Liabilities | $0 | $0 | $0 | $0 | $0 | $0 | $0 | $0 | $0 | $0 | $0 | $0 | $0 |
| Total Liabilities | $50,000 | $50,806 | $49,971 | $49,137 | $48,302 | $51,112 | $51,785 | $51,936 | $50,613 | $49,285 | $54,637 | $62,242 | $66,462 |
| Paid-in Capital | $22,200 | $22,200 | $22,200 | $22,200 | $22,200 | $72,200 | $72,200 | $72,200 | $72,200 | $97,200 | $97,200 | $97,200 | $97,200 |
| Retained Earnings | ($31,200) | ($31,200) | ($31,200) | ($31,200) | ($31,200) | ($31,200) | ($31,200) | ($31,200) | ($31,200) | ($31,200) | ($31,200) | ($31,200) | ($31,200) |
| Earnings | $0 | ($4,092) | ($8,180) | ($12,263) | ($16,340) | ($20,483) | ($20,982) | ($19,095) | ($18,383) | ($18,856) | ($18,414) | ($5,998) | $12,374 |
| Total Capital | ($9,000) | ($13,092) | ($17,180) | ($21,263) | ($25,340) | $20,517 | $20,018 | $21,905 | $22,617 | $47,144 | $47,586 | $60,002 | $78,374 |
| Total Liabilities and Capital | $41,000 | $37,714 | $32,791 | $27,874 | $22,961 | $71,628 | $71,803 | $73,841 | $73,230 | $96,429 | $102,223 | $122,244 | $144,836 |
| Net Worth | ($9,000) | ($13,092) | ($17,180) | ($21,263) | ($25,340) | $20,517 | $20,018 | $21,905 | $22,617 | $47,144 | $47,586 | $60,002 | $78,374 |


