
Wishbone Pet Products
Executive Summary
Company
Wishbone Pet Products, Inc. is a start-up company that will design and market innovative pet products. This business plan has been developed to present Wishbone Pet Products, Inc. to prospective investors and assist in raising $120,000 of capital needed to begin production and launch our first product.
Market
The pet product industry is a large and expanding market. The most rapidly growing market segment is pet products and supplies, which represents 5.5% of the market. This segment is projected to increase from $5.2 billion to $6.9 billion in the next five years, according to the Business Communications Company Pet Industry study. The reason for this tremendous growth in pet products and supplies is the growing number of pet owners and pets.
According to a recent survey conducted by the American Animal Hospital Association, there were approximately 235 million households which owned pets. These households represent about 60% of all U.S. households, and 40% of these households own more than one pet, according to an American Pet Product Manufacturers Association (APPMA) study. Of these pet owners and pets, there are approximately 43 million dog owners who owned 62 million dogs. Another recent study found that the average household with pets spent about $350 on their pets. The average American household spends more on pet food than it does on wine, over-the-counter drugs, candy, or television sets. It spends more on veterinary services than it does on coffee, books, video rentals, or computer software.
Need
Recently dog owners have been criticized for leaving their dogs droppings in public places and on private property. Failure to retrieve dog waste is a matter of considerable concern due to public health risks, not to mention the inconvenience to the public. As a result, many communities have passed legislation requiring dog owners not only to clean up after their pet but also to carry a device for performing this task.
According to a Ralston Purina pet owner study, dog owners cite cleaning up after their dog as one of the primary challenges of owning a dog. Unfortunately, currently available dog waste clean-up products are crudely designed and cumbersome to operate, leaving many dog owners frustrated and less inclined to clean up after their dog. To address the needs of dog owners and their communities, a simple, clean, effective means of accomplishing this task is needed.
Solution
Fetch™ is a unique dog waste clean up product designed so that the user’s hands never contact the dog waste in any way. With a simple one-handed operation, Fetch™ encloses the dog waste in a bag inside of a sealed plastic case. Upon closing, the bag is automatically sealed. When Fetch™ is opened again, the liner bag and its contents are automatically discharged into a waste receptacle. Standard plastic liner bags can be deposited into an appropriate waste receptacle for disposal. Biodegradable liner bags can be deposited into a toilet for disposal. Its compact size makes it ideal for use when walking and the liner bag keeps the device from being contaminated.
Advantage
Wishbone Pet Products is positioned to address this market need with an innovative, patented product and a management team with extensive product design and marketing experience. We have spent ample time on the development and research of Fetch™ to ensure that it will satisfy the market demand for a simpler and more effective dog waste clean-up product.
Financials
Research and development work to date has been self-funded by the principal. Based on detailed financial projections, if the company receives sufficient funding to launch Fetch™, it will operate profitably within the first year with a net profit.
1.1 Objectives
- Develop a sustainable pet product business that designs, manufactures, and markets innovative pet products.
- Successfully bring Fetch™ to market by April Year 1.
- Achieve sales volume targets:
- Year 1: 25,000 scoops, 40,000 boxes of bags (25 bags/box)
- Year 2: 50,000 scoops, 175,000 boxes of bags (25 bags/box)
- Year 3: 100,000 scoops, 420,000 boxes of bags (25 bags/box)
- Reach break-even point within 12 months.
1.2 Mission
Wishbone Pet Products mission is to help people enjoy their pets by developing innovative products that address pet owners needs.
1.3 Keys to Success
Quality Products
Product sales are the primary income source for Wishbone Pet Products. To achieve sales goals, innovative products based on world-class industrial design, engineering, and manufacturing are essential.
Strategic Niche Marketing
Wishbone Pet Products will market a small number of innovative products. Consumers in our targeted niche markets must be educated about their benefits in order for them to gain market acceptance and penetration. The marketing strategy must reflect this reality.
Strategic Partnerships
Wishbone Pet Products will rely on assistance from strategic partners to manufacture, deliver, and market products. The establishment and maintenance of these partnerships is crucial.
Company Summary
Wishbone Pet Products, Inc. develops, manufactures, and markets pet products. Our mission is to develop products that help people enjoy their pets more. We combine intensive market research with world-class industrial design and engineering to create innovative products that address identified needs in the pet product market.
Currently, we are developing a product that makes it easier for dog owners to clean up dog waste. Fetch™, is a dog waste clean-up device that provides a simple, sanitary, and dignified way to accomplish this task. Fetch™ addresses the frustrations of dog owners, due to the shortcomings of existing dog waste clean-up products, with an innovative (patent pending) solution to this decidedly unpleasant task. Fetch™ automatically collects, bags, and disposes of dog waste, a capability not available in the market today.
2.1 Sustainable Competitive Advantage
Form and Function
The pet product market is filled with crudely designed and manufactured products. The form and function of our products sets them apart from the competition. Our focus on industrial design and engineering results in products that look better and work better than their competitors and are, therefore, more likely to be purchased.
Marketing
We will work with our advertising and marketing partners to develop clear marketing strategies for our products. This effort will set our products apart from a field of competitors that seems to lack a coherent marketing strategy. Marketing and advertising by competitors, even in trade magazines, is virtually nonexistent. Our competitors seem content to merely get their products in a store and then hope that the customer selects their product over the other choices available.
Operations
Wishbone Pet Products operations strategy leverages limited resources by utilizing external resources for product development assistance, manufacturing, fulfillment, and marketing. With this operations strategy, we can quickly and efficiently develop new products, initiate manufacturing activities and distribute our product with minimal upfront and fixed costs, resulting in significant profits.
2.2 Start-up Summary
Wishbone Pet Products total start-up costs include expenses incurred before the start of the plan include legal counsel (patent, trademark, and business), consultants (marketing, advertising), and research and development. Assets required at the start of the plan include manufacturing tooling and initial product inventory. Additional funds are required to launch a marketing campaign, finance daily/monthly operations, and have cash available for contingencies. A portion of the start-up costs has been financed by direct owner investment. The remainder of the start-up capital required will be provided by a combination of investment, SBA guaranteed loans, and lines of credit.

| Start-up | |
| Requirements | |
| Start-up Expenses | |
| Legal – patent, trademark, and counsel | $6,000 |
| Consultants – marketing | $6,500 |
| Corporate/Product Identity | $5,000 |
| Research and Development | $2,500 |
| Total Start-up Expenses | $20,000 |
| Start-up Assets | |
| Cash Required | $100,000 |
| Start-up Inventory | $0 |
| Other Current Assets | $15,000 |
| Long-term Assets | $0 |
| Total Assets | $115,000 |
| Total Requirements | $135,000 |

| Start-up Funding | |
| Start-up Expenses to Fund | $20,000 |
| Start-up Assets to Fund | $115,000 |
| Total Funding Required | $135,000 |
| Assets | |
| Non-cash Assets from Start-up | $15,000 |
| Cash Requirements from Start-up | $100,000 |
| Additional Cash Raised | $0 |
| Cash Balance on Starting Date | $100,000 |
| Total Assets | $115,000 |
| Liabilities and Capital | |
| Liabilities | |
| Current Borrowing | $0 |
| Long-term Liabilities | $85,000 |
| Accounts Payable (Outstanding Bills) | $0 |
| Other Current Liabilities (interest-free) | $0 |
| Total Liabilities | $85,000 |
| Capital | |
| Planned Investment | |
| Owners Investment | $10,000 |
| Needed Investment | $25,000 |
| Additional Investment Requirement | $15,000 |
| Total Planned Investment | $50,000 |
| Loss at Start-up (Start-up Expenses) | ($20,000) |
| Total Capital | $30,000 |
| Total Capital and Liabilities | $115,000 |
| Total Funding | $135,000 |
2.3 Company Ownership
Wishbone Pet Products is being founded by Kent Chase. Mr. Chase, a devoted dog owner, has over ten years of product design experience as a mechanical engineer and project manager. As a product design consultant, he has taken dozens of products from concept to production. Wishbone Pet Products will be incorporated as an S-corporation with headquarters located in Madison, Wisconsin.
Products
Fetch™ is an innovative (patent pending) dog waste clean-up and disposal device marketed to dog owners. While many products are available to assist owners in cleaning up after their dogs, they are at best cumbersome and at worst ineffective. Many of these products require the user to touch, see, and smell dog waste during and after use and are also unsuitable for use when walking. Fetch™ offers the following benefits:
- Ease of use – simple one-handed operation.
- Ease of disposal – contents are automatically deposited into a waste receptacle for disposal.
- Compact – its size makes it ideal for use when walking.
- Clean – the liner bag keeps the device from being contaminated.
- Environmentally friendly – biodegradable liner bags can be disposed of in a toilet.
3.1 Competitive Comparison
There are four distinct types of dog-waste disposal products currently available.
Type 1 – Mechanisms With Bag
Products in this group use a mechanism in conjunction with a bag to collect, carry, and dispose of dog waste. Most of these products utilize a long handle. The handle, while intended to allow the user to operate the product at a distance from the waste, makes operation difficult. Products with long handles are also cumbersome to carry. All of these products require the user to seal the bag by hand and many require the user to manually dispose of the bag. In practice these products are difficult to manipulate effectively and the manner of operation results in incomplete retrieval of the waste and/or unintended smearing of waste on the device. These operations are distasteful to many people and discourage the use of such products.
Type 2 – Mechanisms Without Bag
Products in this group use some type of mechanism to collect, carry, and dispose of dog waste. While these products suffer the same disadvantages as the products in the first group, the primary disadvantage of these products is that they must be carefully cleaned of the residue of the collected waste before they are stored or it will result in offensive odors and dirt being brought inside from outdoors. This group also includes rakes and shovels.
Type 3 – Modified Bags
Products in this group include paper or plastic bags that have features added (e.g., cardboard, stiff plastic) to keep the users hand from directly touching the dog waste and make it less distasteful to pick up dog waste. These products are often bulky and awkward, making transport and handling quite difficult. Moreover, these products present difficult cleaning problems and, accordingly, products of this type are objectionable from an aesthetic as well as functional standpoint. In addition, these bags are not biodegradable and cannot be disposed of in a toilet.
Type 4 – Bags
This group consists of ordinary plastic bags, which are slightly modified or not modified at all. Modified bags include: scented bags, biodegradable bags, and bags with built-in ties. While use of a plastic bag is arguably the most commonly employed means for cleaning up dog waste, it is also one of the most objectionable. The user must come into direct tactile and olfactory contact with the dog waste, a most unpleasant prospect. In addition, the bag requires careful handling until a suitable waste receptacle is located.
3.2 Product Description
Fetch™ is unique in a number of ways. Fetch™ is designed so that the user’s hands never contact the dog waste in any way. With a simple one-handed operation, Fetch™ encloses the dog waste in a bag inside of a sealed plastic case. Upon closing, the bag is automatically sealed. When Fetch™ is opened again, the liner bag and its contents are automatically discharged into a waste receptacle. Standard plastic liner bags can be deposited into an appropriate waste receptacle for disposal. Biodegradable liner bags can be deposited into a toilet for disposal. Its compact size makes it ideal for use when walking and the liner bag keeps the device from being contaminated.
The elastic-edge liner bag is the key to Fetch’s™ simple operation. When Fetch™ is closed the liner bag is automatically closed with the contents inside. Two different types of liner bags are available:
- Standard bags are made of 1 mil polyethylene film with an elastic edge. These bags should be disposed of in an appropriate waste receptacle.
- Biodegradable bags are made of 1 mil water-soluble film with an elastic edge. These bags can be disposed of in any toilet or appropriate waste receptacle.
3.3 Sourcing
In accordance with the operations strategy, product manufacturing and fulfillment will be outsourced. Price quotes and invoicing terms have been obtained from these vendors. This information has been incorporated into the financial projections where appropriate.
3.4 Competition and Buying Patterns
Due to the healthy expanding economy of the 1990s, American pet owners have been able to “lavish unprecedented spending on their pets”. Since these owners often consider companion animals, such as dogs and cats as members of their family, pet food companies have cashed in on this emotional bond. For instance, Funda Alp, a spokesperson for the American Pet Products Association stated that “love does translate into dollars.” A study by Sloan Trends & Solutions in 1998 found that the average household with pets spent about $350 on their pets in 1998. These expenditures are expected to grow at an average rate of 4.4%/yr during the next 5 yr period. The average American household spends more on pet food than it does on wine, over-the-counter drugs, candy, or television sets. It spends more on veterinary services than it does on coffee, books, video rentals, or computer software.
Market Analysis Summary
The primary market for Wishbone Pet Products is dog owners. A study sponsored by the Pet Food Institute (PFI) confirmed that the number of pet dogs and cats in the U.S. has reached an all-time high. In 2000, there were 59 million pet dogs. The percentage of households owning dogs remained constant at approximately 37%. PFI began tracking the population of pet dogs and cats in the U.S. in 1981. Since that time, the number of pet dogs has grown by more than 5 million. Spending on pet products is also increasing, from $5.2 billion in 2000 to a projected $6.9 billion in 2005, according to the Business Communications Company Pet Industry study.
4.1 Market Segmentation
The pet product market is most easily segmented by age, as spending on pet products varies significantly with age. Older householders are the biggest spenders on pets. Married couples without children at home, most of them empty nesters, spend 30 percent more than the average household on pets. The best customers of the pet industry (the households that spend the most on pet products and services) are married couples with adult children at home. These “crowded” nesters spend 45 percent more than the average household on pets. Those aged 55 to 64 spend 26 percent more than average. Spending on pets is below average among householders aged 65 or older and also among those under age 35. Married couples with preschoolers spend less than the average household on pets, as do single parents and people who live alone. The following tables provide a demographic profile of dog owners and growth projections for this market.
Demographic Profile of Dog Owners:
| Gender | % | Marital Status | % | Region | % |
| Male | 34 | Married | 62 | Northeast | 15 |
| Female | 66 | Unmarried couple | 3 | Midwest | 26 |
| Single, never married | 17 | South | 37 | ||
| Age | % | Divorced/separated | 9 | West | 23 |
| 18 – 24 | 9 | Widowed | 6 | ||
| 25 – 29 | 8 | Refused | 3 | Education | % |
| 30 – 34 | 11 | 8th grade or less | 2 | ||
| 35 – 39 | 12 | Children Under | % | Some high school | 5 |
| 40 – 49 | 26 | 18 in Household | High school graduate | 33 | |
| 50 – 64 | 20 | Yes | 39 | Some college | 27 |
| 65 or older | 13 | No | 60 | College graduate | 23 |
| Refused | 1 | Refused | 1 | Graduate study | 8 |
| Refused | 2 | ||||
| Race | % | Total Family Income | % | ||
| White | 85 | Less than $20,000 | 10 | Use the Internet | % |
| Black | 6 | $20,000 – $34,999 | 14 | Yes | 55 |
| Asian | 1 | $35,000 – $49,999 | 21 | No | 43 |
| Hispanic | 5 | $50,000 – $74,999 | 19 | Refused | 2 |
| Other | 1 | $75,000 – $99,999 | 8 | ||
| Refused | 2 | $100,000 + | 7 | Internet Usage | % |
| Refused | 21 | Once a day or more | 62 | ||
| Hispanic Origin | % | Mean (000’s_ | 53.4 | At least once per week | 28 |
| Yes | 7 | Median (000’s) | 46.6 | At least once per month | 7 |
| No | 91 | Less than once per month | 3 | ||
| Refused | 2 | Varies too much to say | 0 | ||
| Don’t know/Refused | 0 |
| Market Analysis | |||||||
| Year 1 | Year 2 | Year 3 | Year 4 | Year 5 | |||
| Potential Customers | Growth | CAGR | |||||
| Age 34 and under | 0% | 6,581,339 | 6,583,569 | 6,585,066 | 6,637,228 | 6,726,652 | 0.55% |
| Age 35 – 44 | 0% | 6,853,963 | 6,768,024 | 6,684,963 | 6,561,209 | 6,419,631 | -1.62% |
| Age 45 – 54 | 0% | 7,026,073 | 7,177,077 | 7,318,521 | 7,432,621 | 7,518,721 | 1.71% |
| Age 55 – 64 | 0% | 4,992,798 | 5,199,186 | 5,406,877 | 5,616,124 | 5,776,934 | 3.71% |
| Age 65 and older | 0% | 6,847,697 | 6,917,743 | 6,999,165 | 7,101,496 | 7,266,916 | 1.50% |
| Total | 1.07% | 32,301,870 | 32,645,598 | 32,994,591 | 33,348,678 | 33,708,854 | 1.07% |
4.2 Target Market Segment Strategy
While Fetch™ is affordable and useful for all dog owners, our focus will be on middle-aged female baby boomers. This group represents the largest and most affluent segment of the pet product market in general and of dog owners in particular. This focus will primarily manifest itself in the type of marketing and advertising techniques we employ.
Market Trends
The market for pet products has been growing rapidly with demographics driving the demand for pet supplies. Aging baby boomers are filling their empty nests with pets, while the number of households with children from 5 to 15, the core pet market, keeps climbing. A large category of current pet owners can be considered “pet enthusiasts,” as characterized by the leading wholesaler PetSmart. PetSmart CEO Philip Francis calls pets “an affordable luxury,” sales of which have not been dented by weakening consumer confidence. These consumers are “passionately committed to their pets” and regard their pet like “a family member.” The strong commitment of these owners for their pets is shown by some of the 1998 statistics provided by the American Pet Association. These statistics show how millions of owners treat their pets much like their own children or other family members by buying them gifts, celebrating their birthdays or displaying their pictures. This commitment is especially strong for dog owners. More than half of all U.S. dog owners say they are more attached to their pets than to at least one other human being, and from 4-13 million say they are as attached to their dogs as they are to their best friend (13 million), children (6 million), or spouse (4 million).
Market Needs
Dog owners consider cleaning up after their dog a major challenge. Unfortunately, currently available products offer dog owners little help as they are generally cumbersome to carry, crudely designed and manufactured, difficult to operate, and difficult to keep clean. Dog owners will welcome a product that can effectively address these problems.
Market Growth
Demographic trends are positive for the pet industry. With many older couples turning to pets for companionship, and with the older population expanding with baby boomers, spending on pets is likely to rise. According to the U.S. Census, in 2000, baby boomers accounted for 35% of the dog owning population. By 2008 they will account for 40% of the dog owning population.
4.3 Industry Analysis
According to the APPMA, the market for pet products and services was $23 billion in 1998, $27 billion in 2000, and $29 billion in 2001. By 2005, the industry is expected to grow even more to $33.5 billion, according to a study by Business Communications Company on The Pet Industry. Significantly, the most rapidly growing market segment is pet supplies, which represents 5.5% of the market. These supplies include dog and cat toys, collars and leashes, pet waste clean-up products, cages and habitats, and books. The pet product market, while massive, is highly fragmented at both the retail and wholesale level. This fragmentation provides an opportunity for new companies and products to compete and thrive.
Industry Participants
While the superstores and discount stores account for over 50% of U.S. pet supply sales volume, many other retailers sell pet supplies. Among these other retailers are supermarkets, discount stores, other mass merchandisers, specialty pet stores, direct mail houses, Internet retailers, and veterinarians. In addition to being fragmented, pet product retailers cater to different demographics. Nationwide outlets such as Three Dog Bakery tend to carry “high end” products while supermarket-style stores like Pet Supplies Plus tend to carry lower price products. This differentiation makes it difficult for a single manufacturer to dominate the market and leaves niche markets open.
Distribution Patterns
The pet product supply chain is as fragmented as the retail market. There are hundreds of pet product distributors with both regional and national coverage. While many pet stores buy primarily from these distributors, others buy directly from manufacturers. In addition, catalog sales and Internet sales comprise a significant portion of the market.
Buying Patterns
Due to the healthy expanding economy of the 1990s, American pet owners have been able to “lavish unprecedented spending on their pets.” Since these owners often consider companion animals such as dogs and cats as members of their family, companies have capitalized on this emotional bond. For instance, Funda Alp, a spokesperson for the American Pet Products Association stated that “love does translate into dollars.” A study by Sloan Trends & Solutions in 1998 found that the average household with pets spent about $350 on their pets in 1998. These expenditures are expected to grow at an average rate of 4.4%/year during the next five year period.
Web Plan Summary
Fusion Design
The Fusion Design website will be the virtual business card and portfolio for the company. It will highlight the product line and provide links to websites for each of the products. The graphic design of the website will correspond to the corporate identity graphic design.
Fetch
This website is part of the overall marketing mix. It will provide product information and service. It will have a commerce section to allow customers to purchase Fetch or replacement liner bags. The website needs to be simple and well-designed, and in keeping with the latest trends in user interface design. The graphic design of the website will correspond to the product identity graphic design.
Fetch
Because the target market for Fetch uses the Internet on a regular basis the website is an important part of the marketing plan. The website will have a commerce section to allow sales of scoops and replacement bags. Because this product requires replacement liner bags it is especially important that these be readily available. Advertising on the internet has not yet proven to be very effective and will not be aggressively pursued initially. Website awareness will be accomplished via more traditional forms of advertising and product purchases.
5.1 Website Marketing Strategy
The target market for Fetch™ uses the Internet on a regular basis. As such, the website is an important part of the marketing plan. It’s primary purpose is to provide users a convenient source for replacement bags. Fetch™ can also be purchased via the website. In addition, it will provide product information and service. The website will be simple, well-designed, and in keeping with the latest trends in user interface design. The graphic design of the website will correspond to the corporate/product identity graphic design.
Website Marketing Strategy
Advertising on the Internet has not yet proven to be very effective and will not be aggressively pursued initially. Website awareness will be accomplished via more traditional forms of advertising and product purchases.
Development Requirements
Development of these websites will be outsourced. We will work closely with the selected website developer to develop a simple and well-designed site that satisfies the needs of Fetch’s™ target groups. Site hosting and e-commerce transactions will be handled by the order fulfillment provider.
5.2 Development Requirements
Development of these websites will be outsourced. Fusion Design will work closely with the selected website developer to develop a simple and well-designed site that satisfies the needs of Fetch’s target groups. Hosting and e-commerce transactions will be handled by the order fulfillment provider.
Strategy and Implementation Summary
Fetch™ is positioned very carefully: this is an innovative product that addresses a major complaint of dog-owners better than any of the competitors. Our marketing strategy is primarily based on making this information available to our target market, visually via point-of-purchase displays and graphically via creative ad copy and graphics. This basic strategy should allow this product to stand out in a field of competitors that appear to employ no clear marketing strategy.
6.1 Value Proposition
The value proposition for Fetch™ lies with the dog owner. With Fetch™, the dog owner will have a simple, sanitary, and dignified means of cleaning up after their dog. Because dog owners identify this task as one of the most challenging aspects of owning a dog and because the target market has substantial disposable income, they will be willing to pay a premium price to acquire this superior product.
6.2 Competitive Advantage
None of the dog waste clean-up products currently available can do what Fetch™ does. Fetch™ fills a need as it provides an aesthetically pleasing, easily operated device which eliminates contact with the dog waste by the user and the reusable portion of the device while collecting and packaging the waste in a sealed container for convenient disposal.
The competitive advantages for Fetch™ are function and form. Quite simply, Fetch™ works better and is easier to use than any of its competitors. Careful attention was also paid to the aesthetic and ergonomic form of Fetch™. Nearly all of the competitive products are crudely designed and crudely manufactured. The following table provides a feature comparison between Fetch™ and currently available products. The product types are discussed in detail in the Competitive Comparison section. The priority column lists the level of importance consumers place on each feature.
Competitive Comparison:
| Features | Fetch™ | Type 1 | Type 2 | Type 3 | Type 4 | Priority |
| Easy to use | X | – | X | X | X | High |
| Automatically closes bag | X | – | – | – | – | High |
| Automatic disposal | X | – | – | – | – | High |
| One-hand operation | X | – | X | – | – | Moderate |
| Easy to carry before use | X | – | – | X | X | High |
| Easy to carry after use | X | – | – | – | – | High |
| Product remains clean | X | – | – | – | – | High |
| Biodegradable bags available | X | – | – | – | X | Moderate |
| Price | High | High | Moderate | Moderate | Low | – |
6.3 Marketing Strategy
The primary goal of our sales and marketing strategy is to simply and succinctly explain our product to our target market. An explanation of this innovative product is best accomplished by means of a visual demonstration. Focus group research within the target market shows that, while there is a significant amount of interest in this product based on a verbal description, this interest is greatly magnified by a visual demonstration. Retail product demonstrations will be accomplished with point-of-purchase displays that allow customers to try the product for themselves. In addition, the product itself is packaged in such a way that consumers can operate it and see for themselves how it works. The product website will also be used to visually demonstrate the product. Presentations on cable television home shopping channels are also being considered. These alternatives provide an ideal forum for demonstrating the product and reach a wide audience.
Creative application of print media will provide a product description for catalog and ad copy. We will be working with our advertising and marketing partner to develop ads for selected magazines. This effort alone should be sufficient to set this product apart from a field of competitors that appears to lack any type of marketing strategy. We are also planning a series of press releases timed to coincide with the product launch.
6.3.1 Distribution Patterns
Product distribution will be accomplished by pet product distributors and the order fulfillment provider. The primary distribution channel for pet products is through regional and national pet product distributors. We are actively pursuing agreements with regional distributors and will be attending major industry trade shows to develop contacts with distributors in other regions of the country. The secondary distribution channel is through direct retail sales, specialty catalog sales, and website sales. We are also actively pursuing agreements with retailers and specialty catalogs. Once these agreements are in place, our order fulfillment provider will fill these orders.
6.3.2 Positioning Statement
For affluent, suburban, middle-aged female baby boomers whose children have left home (“empty nesters”) who lavish attention on their dog and who consider cleaning up after their dog an unpleasant and undignified task, Fetch™ provides a much-needed solution. Fetch™ addresses this need better than the competitors because it provides an aesthetically pleasing, easily operated device which eliminates contact with the dog waste by the user and the reusable portion of the device, while collecting and packaging the waste in a sealed container for convenient disposal.
6.3.3 Pricing Strategy
The manufacturers suggested retail price (MSRP) for Fetch™ is $30. The MSRP for the bags is $6.75 for a box of 25. These prices are based on a skimming strategy, which sets the initial price high to establish high perceived value. High perceived value is important, as the target market has substantial disposable income and is willing to pay for style and functionality. These MSRP’s are based on a careful survey of competitive products prices. While these MSRP’s are high for this product category, they are not the highest nor is this the only high-priced product in its category. There are several competitive products with similar prices.
Although the MSRP is intentionally set high, based on manufacturing costs for the scoop and the bags, these retail prices can be dropped substantially and still leave a reasonable margin. This allows for price flexibility and pricing strategy modification based on the response of the market.
6.4 Sales Strategy
Our initial sales strategy will focus on regional retail sales, specialty direct mail catalogs (e.g., Drs. Foster and Smith, Sharper Image, Brookstone), and e-commerce. This initial strategy is intended to control growth and keep sales in line with projections. As sales increase and more working capital becomes available we will begin to focus on national retail sales. Although ‘big-box’ retailers (e.g., Petco, Petsmart, Wal-mart) are key targets, most products enter these retailers via distributors. To get our product into these stores we will pursue agreements with distributors that already have relationships with these stores.
6.4.1 Revenue Streams
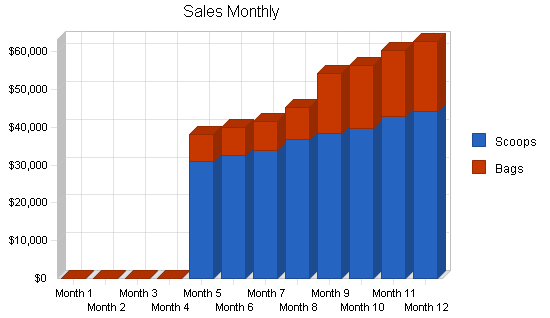
Because Fetch™ requires the use of a consumable item, two revenue streams are generated. The Sales Forecast graph illustrates the advantage of having a product that includes a consumable component. Although customers will only need to purchase Fetch™ once, they will need to continue to purchase liner bags to continue to using the product. By year three, bag sales are nearly equal to scoop sales. Eventually, bag sales will eclipse scoop sales. This will allow for more price flexibility as the scoop could then be sold primarily as a means of generating sales of the consumable. While there are some disadvantages to products that require replacement components (e.g., replacement components may not be available when required, retailers may be sold out) the advantages are clear. In order to minimize customer concerns about replacement bags, the primary focus of the website will be to provide online purchasing of replacement bags.
6.4.2 Sales Forecast
The sales forecast includes sales of scoops and liner bags to wholesalers/distributors (75%) and retailers (25%). To keep the sales projections conservative, direct sales to customers via the website were not included in this forecast. Bag sales forecasts assume that for each scoop purchased, the liner bags will be used twice per week. This corresponds to one box of 25 bags being used every three months.

| Sales Forecast | |||
| Year 1 | Year 2 | Year 3 | |
| Sales | |||
| Scoops | $299,425 | $755,200 | $1,401,250 |
| Bags | $99,225 | $527,513 | $1,315,575 |
| Total Sales | $398,650 | $1,282,713 | $2,716,825 |
| Direct Cost of Sales | Year 1 | Year 2 | Year 3 |
| Scoops | $121,800 | $307,200 | $570,000 |
| Bags | $44,100 | $234,450 | $584,700 |
| Subtotal Direct Cost of Sales | $165,900 | $541,650 | $1,154,700 |
6.5 Milestones
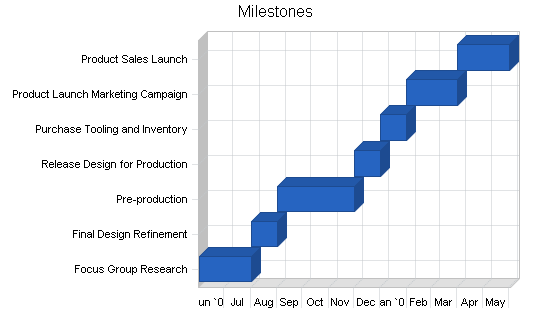
The following chart and table shows key milestones for start up and the first quarter of operations:
| Milestones | |||||
| Milestone | Start Date | End Date | Budget | Manager | Department |
| Focus Group Research | 6/1/2003 | 8/1/2003 | $0 | KBC | Engineering |
| Final Design Refinement | 8/1/2003 | 9/1/2003 | $0 | KBC | Engineering |
| Pre-production | 9/1/2003 | 12/1/2003 | $0 | KBC | Engineering |
| Release Design for Production | 12/1/2003 | 1/1/2004 | $0 | KBC | Engineering |
| Purchase Tooling and Inventory | 1/1/2004 | 2/1/2004 | $15,000 | KBC | Purchasing |
| Product Launch Marketing Campaign | 2/1/2004 | 4/1/2004 | $60,000 | KBC | Purchasing |
| Product Sales Launch | 4/1/2004 | 6/1/2004 | $0 | KBC | Purchasing |
| Totals | $75,000 | ||||
Management Summary
To remain consistent with our overall strategy of minimizing fixed costs, Wishbone Pet Products does not intend to develop a large employee or operations infrastructure. Some of the product design activities and all of the manufacturing and distribution activities will be outsourced. This dramatically reduces the in-house requirements for manpower.
Wishbone Pet Products is a pet product innovator and marketing company based on a lean and agile operations strategy. We will leverage limited resources by utilizing external resources for product development assistance, manufacturing, fulfillment, and marketing. We may also finance accounts receivable with a factor in order to minimize administrative work and guarantee a positive cash flow. With this operations strategy, we can quickly and efficiently develop new products, initiate manufacturing activities, and distribute our product with minimal upfront and fixed costs. This strategy allows us to remain lean, by leveraging the expertise that each external resource possesses and agile with respect to changing customer needs.
7.1 Management Team
In keeping with our operations strategy, we have assembled a team of consultants to provide expertise and direction in key areas. We have also assembled an Advisory Board consisting of key individuals that will provide expert advice to our company when making strategic decisions. This board consists of individuals with particular expertise in engineering and new product development, entrepreneurship, and small business planning.
Kent Chase: Mr. Chase has a mechanical engineering background and has a special interest in new product development and entrepreneurship. He has been engaged in product design for the past six years, working on projects in the medical, commercial appliance, automobile, furniture, and consumer product industry. For the past five years, he has worked as a mechanical engineer and project manager for one of the largest product development companies in the United States. The new product development experience has developed his competence in taking product designs from concept through engineering and into manufacturing. The project management experience has increased his ability to manage people, budgets, and timelines. Prior to this experience, Mr. Chase spent four years in the machine design industry. He holds a Bachelor of Science and a Master of Science in mechanical engineering from the University of Wisconsin – Madison.
7.2 Personnel Plan
Wishbone Pet Products has adopted a relatively flat organizational structure. Mr. Chase will serve primarily as the general manager, providing direction and coordination for outside resources. Since development of the initial product line is nearly complete, Mr. Chase will focus on marketing and advertising strategy, coordinate the necessary outside resources to promote the product and handle administrative tasks. Prior to the product launch we will need one individual devoted to sales activities and another individual responsible for the continued monitoring of our production activities, coordinating the required manufacturing resources and monitoring fulfillment of orders.
Financial Plan
Product sales generate the primary revenue stream for Wishbone Pet Products. As such, the financial projections are closely tied to the sales forecast. While we believe that the sales forecast presented is conservative and reflects a clear understanding of the market, we have considered scenarios in which sales lag or lead our projections.
Lagging Sales
Rather than purchasing inventory in large lots we will purchase inventory approximately every three months on an as-needed basis. If actual sales volumes are less than projected, we can respond by reducing inventory purchases to reduce variable costs and maintain a positive cash balance. Our operations strategy is also an asset in this scenario as our fixed costs are very low with respect to our variable costs. If necessary we can further reduce our fixed costs by reducing personnel, as payroll constitutes the majority of our fixed costs.
Leading Sales
If actual sales volumes exceed our projections we will respond by increasing inventory purchases. Our suppliers capacity greatly exceeds the estimates in our current sales projections. While we should be able to finance the increased inventory purchases with revenue generated from the increased sales, this scenario may require additional infusions of cash. We may also consider financing accounts receivable with a factor to make cash for inventory purchases readily available.
The following subtopics highlight the financial plan for Wishbone Pet Products.
8.1 Assumptions
The table below presents the assumptions used in the financial calculations of this business plan.
| General Assumptions | |||
| Year 1 | Year 2 | Year 3 | |
| Plan Month | 1 | 2 | 3 |
| Current Interest Rate | 10.00% | 10.00% | 10.00% |
| Long-term Interest Rate | 10.00% | 6.00% | 6.00% |
| Tax Rate | 30.00% | 30.00% | 30.00% |
| Unit Sales – scoops | 20,300 | 3,000 | 20,300 |
| Unit Sales – bags (boxes of 25) | 29,400 | 5,500 | 29,400 |
8.2 Break-even Analysis
Wishbone Pet Products revenues are generated from unit sales of Fetch™ (a one-time expense) and replacement liner bag sales (a recurring expense). The monthly break-even volume was determined using the sales forecast as a guide, and based on estimates for fixed costs and average revenue for Fetch™ and the replacement liner bags. We anticipate breaking even within the first year of operation.
Notes:
- One scoop and one box of liners constitute one unit.
- Average Per-Unit Revenue assumes only wholesale sales of one scoop and one box of bags.
- Direct sales to retailers and catalogs will increase average per-unit revenue.

| Break-even Analysis | |
| Monthly Revenue Break-even | $20,996 |
| Assumptions: | |
| Average Percent Variable Cost | 42% |
| Estimated Monthly Fixed Cost | $12,258 |
8.3 Projected Profit and Loss
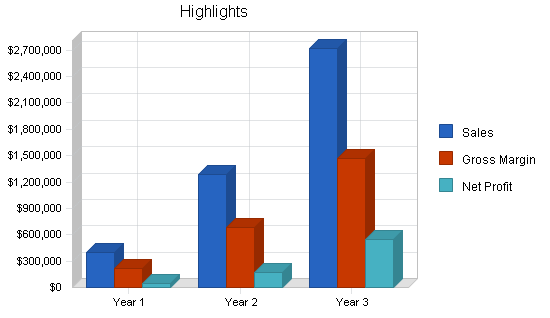
Based on the sales projections and our low fixed cost operations strategy, Wishbone Pet Products will achieve profitability within one year. Profits in subsequent years will accelerate with an increase in anticipated sales volume, yielding approximately tripling of net profit in Year 2 and Year 3.


| Pro Forma Profit and Loss | |||
| Year 1 | Year 2 | Year 3 | |
| Sales | $398,650 | $1,282,713 | $2,716,825 |
| Direct Cost of Sales | $165,900 | $541,650 | $1,154,700 |
| Shipping and Handling – scoops | $8,398 | $25,971 | $35,027 |
| Shipping and Handling – bags | $7,970 | $28,781 | $64,279 |
| Total Cost of Sales | $182,268 | $596,402 | $1,254,006 |
| Gross Margin | $216,382 | $686,311 | $1,462,819 |
| Gross Margin % | 54.28% | 53.50% | 53.84% |
| Expenses | |||
| Payroll | $66,000 | $198,000 | $228,000 |
| Sales and Marketing and Other Expenses | $59,798 | $192,407 | $407,524 |
| Depreciation | $0 | $0 | $0 |
| Rent | $6,000 | $6,500 | $7,000 |
| Utilities | $1,200 | $1,500 | $1,750 |
| Insurance – liability | $4,200 | $4,200 | $4,200 |
| Payroll Taxes | $9,900 | $29,700 | $34,200 |
| Other | $0 | $0 | $0 |
| Total Operating Expenses | $147,098 | $432,307 | $682,674 |
| Profit Before Interest and Taxes | $69,284 | $254,004 | $780,146 |
| EBITDA | $69,284 | $254,004 | $780,146 |
| Interest Expense | $4,638 | $3,576 | $2,376 |
| Taxes Incurred | $19,394 | $75,128 | $233,331 |
| Net Profit | $45,252 | $175,299 | $544,439 |
| Net Profit/Sales | 11.35% | 13.67% | 20.04% |
8.4 Projected Cash Flow
We expect to manage cash flow with an initial investment and expect be profitable by the end of Year 1, with occasional negative cash flows corresponding to inventory purchases. Owner invests additional $10,000 in Year 2 as a hedge against Accounts Payable/Accounts Receivable flows.

| Pro Forma Cash Flow | |||
| Year 1 | Year 2 | Year 3 | |
| Cash Received | |||
| Cash from Operations | |||
| Cash Sales | $99,663 | $320,678 | $679,206 |
| Cash from Receivables | $208,143 | $760,573 | $1,710,811 |
| Subtotal Cash from Operations | $307,805 | $1,081,251 | $2,390,017 |
| Additional Cash Received | |||
| Sales Tax, VAT, HST/GST Received | $0 | $0 | $0 |
| New Current Borrowing | $0 | $0 | $0 |
| New Other Liabilities (interest-free) | $0 | $0 | $0 |
| New Long-term Liabilities | $0 | $0 | $0 |
| Sales of Other Current Assets | $0 | $0 | $0 |
| Sales of Long-term Assets | $0 | $0 | $0 |
| New Investment Received | $0 | $10,000 | $0 |
| Subtotal Cash Received | $307,805 | $1,091,251 | $2,390,017 |
| Expenditures | Year 1 | Year 2 | Year 3 |
| Expenditures from Operations | |||
| Cash Spending | $66,000 | $198,000 | $228,000 |
| Bill Payments | $249,698 | $921,205 | $1,918,396 |
| Subtotal Spent on Operations | $315,698 | $1,119,205 | $2,146,396 |
| Additional Cash Spent | |||
| Sales Tax, VAT, HST/GST Paid Out | $0 | $0 | $0 |
| Principal Repayment of Current Borrowing | $0 | $0 | $0 |
| Other Liabilities Principal Repayment | $0 | $0 | $0 |
| Long-term Liabilities Principal Repayment | $15,400 | $20,000 | $20,000 |
| Purchase Other Current Assets | $0 | $0 | $0 |
| Purchase Long-term Assets | $0 | $0 | $0 |
| Dividends | $0 | $5,000 | $7,500 |
| Subtotal Cash Spent | $331,098 | $1,144,205 | $2,173,896 |
| Net Cash Flow | ($23,293) | ($52,954) | $216,121 |
| Cash Balance | $76,707 | $23,753 | $239,873 |
8.5 Projected Balance Sheet
As shown on the balance sheet in the following table, we expect a healthy growth in net worth by the end of the plan period. The monthly projections for Year 1 are in the appendix.
| Pro Forma Balance Sheet | |||
| Year 1 | Year 2 | Year 3 | |
| Assets | |||
| Current Assets | |||
| Cash | $76,707 | $23,753 | $239,873 |
| Accounts Receivable | $90,845 | $292,307 | $619,114 |
| Inventory | $28,875 | $94,275 | $200,976 |
| Other Current Assets | $15,000 | $15,000 | $15,000 |
| Total Current Assets | $211,427 | $425,334 | $1,074,964 |
| Long-term Assets | |||
| Long-term Assets | $0 | $0 | $0 |
| Accumulated Depreciation | $0 | $0 | $0 |
| Total Long-term Assets | $0 | $0 | $0 |
| Total Assets | $211,427 | $425,334 | $1,074,964 |
| Liabilities and Capital | Year 1 | Year 2 | Year 3 |
| Current Liabilities | |||
| Accounts Payable | $66,575 | $120,182 | $252,874 |
| Current Borrowing | $0 | $0 | $0 |
| Other Current Liabilities | $0 | $0 | $0 |
| Subtotal Current Liabilities | $66,575 | $120,182 | $252,874 |
| Long-term Liabilities | $69,600 | $49,600 | $29,600 |
| Total Liabilities | $136,175 | $169,782 | $282,474 |
| Paid-in Capital | $50,000 | $60,000 | $60,000 |
| Retained Earnings | ($20,000) | $20,252 | $188,051 |
| Earnings | $45,252 | $175,299 | $544,439 |
| Total Capital | $75,252 | $255,551 | $792,490 |
| Total Liabilities and Capital | $211,427 | $425,334 | $1,074,964 |
| Net Worth | $75,252 | $255,551 | $792,490 |
8.6 Business Ratios
The following table presents common business ratios for reference. Wishbone Pet Products NAICS classification is 339999 (SIC, 3999) – Manufacturing Industries, NEC (Not Elsewhere Classified).
| Ratio Analysis | ||||
| Year 1 | Year 2 | Year 3 | Industry Profile | |
| Sales Growth | 0.00% | 221.76% | 111.80% | -3.08% |
| Percent of Total Assets | ||||
| Accounts Receivable | 42.97% | 68.72% | 57.59% | 23.87% |
| Inventory | 13.66% | 22.16% | 18.70% | 22.83% |
| Other Current Assets | 7.09% | 3.53% | 1.40% | 27.81% |
| Total Current Assets | 100.00% | 100.00% | 100.00% | 74.51% |
| Long-term Assets | 0.00% | 0.00% | 0.00% | 25.49% |
| Total Assets | 100.00% | 100.00% | 100.00% | 100.00% |
| Current Liabilities | 31.49% | 28.26% | 23.52% | 24.61% |
| Long-term Liabilities | 32.92% | 11.66% | 2.75% | 21.74% |
| Total Liabilities | 64.41% | 39.92% | 26.28% | 46.35% |
| Net Worth | 35.59% | 60.08% | 73.72% | 53.65% |
| Percent of Sales | ||||
| Sales | 100.00% | 100.00% | 100.00% | 100.00% |
| Gross Margin | 54.28% | 53.50% | 53.84% | 37.64% |
| Selling, General & Administrative Expenses | 40.11% | 36.61% | 30.46% | 20.59% |
| Advertising Expenses | 0.00% | 0.00% | 0.00% | 1.38% |
| Profit Before Interest and Taxes | 17.38% | 19.80% | 28.72% | 4.79% |
| Main Ratios | ||||
| Current | 3.18 | 3.54 | 4.25 | 2.48 |
| Quick | 2.74 | 2.75 | 3.46 | 1.35 |
| Total Debt to Total Assets | 64.41% | 39.92% | 26.28% | 6.29% |
| Pre-tax Return on Net Worth | 85.91% | 98.00% | 98.14% | 50.32% |
| Pre-tax Return on Assets | 30.58% | 58.88% | 72.35% | 12.65% |
| Additional Ratios | Year 1 | Year 2 | Year 3 | |
| Net Profit Margin | 11.35% | 13.67% | 20.04% | n.a |
| Return on Equity | 60.13% | 68.60% | 68.70% | n.a |
| Activity Ratios | ||||
| Accounts Receivable Turnover | 3.29 | 3.29 | 3.29 | n.a |
| Collection Days | 55 | 73 | 82 | n.a |
| Inventory Turnover | 10.91 | 8.80 | 7.82 | n.a |
| Accounts Payable Turnover | 4.75 | 8.11 | 8.11 | n.a |
| Payment Days | 40 | 35 | 33 | n.a |
| Total Asset Turnover | 1.89 | 3.02 | 2.53 | n.a |
| Debt Ratios | ||||
| Debt to Net Worth | 1.81 | 0.66 | 0.36 | n.a |
| Current Liab. to Liab. | 0.49 | 0.71 | 0.90 | n.a |
| Liquidity Ratios | ||||
| Net Working Capital | $144,852 | $305,151 | $822,090 | n.a |
| Interest Coverage | 14.94 | 71.03 | 328.34 | n.a |
| Additional Ratios | ||||
| Assets to Sales | 0.53 | 0.33 | 0.40 | n.a |
| Current Debt/Total Assets | 31% | 28% | 24% | n.a |
| Acid Test | 1.38 | 0.32 | 1.01 | n.a |
| Sales/Net Worth | 5.30 | 5.02 | 3.43 | n.a |
| Dividend Payout | 0.00 | 0.03 | 0.01 | n.a |
Appendix
| Sales Forecast | |||||||||||||
| Month 1 | Month 2 | Month 3 | Month 4 | Month 5 | Month 6 | Month 7 | Month 8 | Month 9 | Month 10 | Month 11 | Month 12 | ||
| Sales | |||||||||||||
| Scoops | 0% | $0 | $0 | $0 | $0 | $30,975 | $32,450 | $33,925 | $36,875 | $38,350 | $39,825 | $42,775 | $44,250 |
| Bags | 0% | $0 | $0 | $0 | $0 | $7,088 | $7,425 | $7,763 | $8,438 | $15,863 | $16,538 | $17,550 | $18,563 |
| Total Sales | $0 | $0 | $0 | $0 | $38,063 | $39,875 | $41,688 | $45,313 | $54,213 | $56,363 | $60,325 | $62,813 | |
| Direct Cost of Sales | Month 1 | Month 2 | Month 3 | Month 4 | Month 5 | Month 6 | Month 7 | Month 8 | Month 9 | Month 10 | Month 11 | Month 12 | |
| Scoops | $0 | $0 | $0 | $0 | $12,600 | $13,200 | $13,800 | $15,000 | $15,600 | $16,200 | $17,400 | $18,000 | |
| Bags | $0 | $0 | $0 | $0 | $3,150 | $3,300 | $3,450 | $3,750 | $7,050 | $7,350 | $7,800 | $8,250 | |
| Subtotal Direct Cost of Sales | $0 | $0 | $0 | $0 | $15,750 | $16,500 | $17,250 | $18,750 | $22,650 | $23,550 | $25,200 | $26,250 | |
| Personnel Plan | |||||||||||||
| Month 1 | Month 2 | Month 3 | Month 4 | Month 5 | Month 6 | Month 7 | Month 8 | Month 9 | Month 10 | Month 11 | Month 12 | ||
| General Manager | 0% | $1,500 | $1,500 | $1,500 | $1,500 | $1,500 | $1,500 | $1,500 | $1,500 | $1,500 | $1,500 | $1,500 | $1,500 |
| Sales Manager | 0% | $2,000 | $2,000 | $2,000 | $2,000 | $2,000 | $2,000 | $2,000 | $2,000 | $2,000 | $2,000 | $2,000 | $2,000 |
| Marketing Assistant | 0% | $0 | $0 | $0 | $0 | $0 | $0 | $0 | $0 | $0 | $0 | $0 | $0 |
| Marketing Manager | 0% | $0 | $0 | $0 | $0 | $0 | $0 | $0 | $0 | $0 | $0 | $0 | $0 |
| Operations Assistant | 0% | $0 | $0 | $0 | $0 | $0 | $0 | $0 | $0 | $0 | $0 | $0 | $0 |
| Operations Manager | 0% | $2,000 | $2,000 | $2,000 | $2,000 | $2,000 | $2,000 | $2,000 | $2,000 | $2,000 | $2,000 | $2,000 | $2,000 |
| Total People | 3 | 3 | 3 | 3 | 3 | 3 | 3 | 3 | 3 | 3 | 3 | 3 | |
| Total Payroll | $5,500 | $5,500 | $5,500 | $5,500 | $5,500 | $5,500 | $5,500 | $5,500 | $5,500 | $5,500 | $5,500 | $5,500 | |
| Pro Forma Profit and Loss | |||||||||||||
| Month 1 | Month 2 | Month 3 | Month 4 | Month 5 | Month 6 | Month 7 | Month 8 | Month 9 | Month 10 | Month 11 | Month 12 | ||
| Sales | $0 | $0 | $0 | $0 | $38,063 | $39,875 | $41,688 | $45,313 | $54,213 | $56,363 | $60,325 | $62,813 | |
| Direct Cost of Sales | $0 | $0 | $0 | $0 | $15,750 | $16,500 | $17,250 | $18,750 | $22,650 | $23,550 | $25,200 | $26,250 | |
| Shipping and Handling – scoops | $0 | $0 | $0 | $2,361 | $464 | $382 | $297 | $2,815 | $676 | $574 | $471 | $357 | |
| Shipping and Handling – bags | $0 | $0 | $0 | $1,594 | $318 | $262 | $203 | $2,576 | $947 | $822 | $692 | $555 | |
| Total Cost of Sales | $0 | $0 | $0 | $3,955 | $16,532 | $17,145 | $17,750 | $24,141 | $24,273 | $24,946 | $26,364 | $27,162 | |
| Gross Margin | $0 | $0 | $0 | ($3,955) | $21,530 | $22,730 | $23,937 | $21,171 | $29,939 | $31,417 | $33,961 | $35,650 | |
| Gross Margin % | 0.00% | 0.00% | 0.00% | 0.00% | 56.57% | 57.00% | 57.42% | 46.72% | 55.23% | 55.74% | 56.30% | 56.76% | |
| Expenses | |||||||||||||
| Payroll | $5,500 | $5,500 | $5,500 | $5,500 | $5,500 | $5,500 | $5,500 | $5,500 | $5,500 | $5,500 | $5,500 | $5,500 | |
| Sales and Marketing and Other Expenses | $0 | $0 | $0 | $0 | $5,709 | $5,981 | $6,253 | $6,797 | $8,132 | $8,454 | $9,049 | $9,422 | |
| Depreciation | $0 | $0 | $0 | $0 | $0 | $0 | $0 | $0 | $0 | $0 | $0 | $0 | |
| Rent | $500 | $500 | $500 | $500 | $500 | $500 | $500 | $500 | $500 | $500 | $500 | $500 | |
| Utilities | $100 | $100 | $100 | $100 | $100 | $100 | $100 | $100 | $100 | $100 | $100 | $100 | |
| Insurance – liability | $350 | $350 | $350 | $350 | $350 | $350 | $350 | $350 | $350 | $350 | $350 | $350 | |
| Payroll Taxes | 15% | $825 | $825 | $825 | $825 | $825 | $825 | $825 | $825 | $825 | $825 | $825 | $825 |
| Other | $0 | $0 | $0 | $0 | $0 | $0 | $0 | $0 | $0 | $0 | $0 | $0 | |
| Total Operating Expenses | $7,275 | $7,275 | $7,275 | $7,275 | $12,984 | $13,256 | $13,528 | $14,072 | $15,407 | $15,729 | $16,324 | $16,697 | |
| Profit Before Interest and Taxes | ($7,275) | ($7,275) | ($7,275) | ($11,230) | $8,546 | $9,474 | $10,409 | $7,099 | $14,532 | $15,687 | $17,638 | $18,954 | |
| EBITDA | ($7,275) | ($7,275) | ($7,275) | ($11,230) | $8,546 | $9,474 | $10,409 | $7,099 | $14,532 | $15,687 | $17,638 | $18,954 | |
| Interest Expense | $425 | $418 | $411 | $404 | $397 | $390 | $383 | $376 | $369 | $362 | $355 | $348 | |
| Taxes Incurred | ($2,310) | ($2,308) | ($2,306) | ($3,490) | $2,445 | $2,725 | $3,008 | $2,017 | $4,249 | $4,598 | $5,185 | $5,582 | |
| Net Profit | ($5,390) | ($5,385) | ($5,380) | ($8,144) | $5,704 | $6,359 | $7,018 | $4,706 | $9,914 | $10,728 | $12,098 | $13,024 | |
| Net Profit/Sales | 0.00% | 0.00% | 0.00% | 0.00% | 14.99% | 15.95% | 16.84% | 10.39% | 18.29% | 19.03% | 20.05% | 20.73% | |
| Pro Forma Cash Flow | |||||||||||||
| Month 1 | Month 2 | Month 3 | Month 4 | Month 5 | Month 6 | Month 7 | Month 8 | Month 9 | Month 10 | Month 11 | Month 12 | ||
| Cash Received | |||||||||||||
| Cash from Operations | |||||||||||||
| Cash Sales | $0 | $0 | $0 | $0 | $9,516 | $9,969 | $10,422 | $11,328 | $13,553 | $14,091 | $15,081 | $15,703 | |
| Cash from Receivables | $0 | $0 | $0 | $0 | $0 | $952 | $28,592 | $29,952 | $31,356 | $34,207 | $40,713 | $42,371 | |
| Subtotal Cash from Operations | $0 | $0 | $0 | $0 | $9,516 | $10,920 | $39,014 | $41,280 | $44,909 | $48,298 | $55,794 | $58,074 | |
| Additional Cash Received | |||||||||||||
| Sales Tax, VAT, HST/GST Received | 0.00% | $0 | $0 | $0 | $0 | $0 | $0 | $0 | $0 | $0 | $0 | $0 | $0 |
| New Current Borrowing | $0 | $0 | $0 | $0 | $0 | $0 | $0 | $0 | $0 | $0 | $0 | $0 | |
| New Other Liabilities (interest-free) | $0 | $0 | $0 | $0 | $0 | $0 | $0 | $0 | $0 | $0 | $0 | $0 | |
| New Long-term Liabilities | $0 | $0 | $0 | $0 | $0 | $0 | $0 | $0 | $0 | $0 | $0 | $0 | |
| Sales of Other Current Assets | $0 | $0 | $0 | $0 | $0 | $0 | $0 | $0 | $0 | $0 | $0 | $0 | |
| Sales of Long-term Assets | $0 | $0 | $0 | $0 | $0 | $0 | $0 | $0 | $0 | $0 | $0 | $0 | |
| New Investment Received | $0 | $0 | $0 | $0 | $0 | $0 | $0 | $0 | $0 | $0 | $0 | $0 | |
| Subtotal Cash Received | $0 | $0 | $0 | $0 | $9,516 | $10,920 | $39,014 | $41,280 | $44,909 | $48,298 | $55,794 | $58,074 | |
| Expenditures | Month 1 | Month 2 | Month 3 | Month 4 | Month 5 | Month 6 | Month 7 | Month 8 | Month 9 | Month 10 | Month 11 | Month 12 | |
| Expenditures from Operations | |||||||||||||
| Cash Spending | $5,500 | $5,500 | $5,500 | $5,500 | $5,500 | $5,500 | $5,500 | $5,500 | $5,500 | $5,500 | $5,500 | $5,500 | |
| Bill Payments | ($110) | ($174) | ($232) | ($118) | $1,354 | $24,798 | $36,001 | $29,456 | $33,601 | $40,133 | $42,041 | $42,947 | |
| Subtotal Spent on Operations | $5,390 | $5,326 | $5,268 | $5,382 | $6,854 | $30,298 | $41,501 | $34,956 | $39,101 | $45,633 | $47,541 | $48,447 | |
| Additional Cash Spent | |||||||||||||
| Sales Tax, VAT, HST/GST Paid Out | $0 | $0 | $0 | $0 | $0 | $0 | $0 | $0 | $0 | $0 | $0 | $0 | |
| Principal Repayment of Current Borrowing | $0 | $0 | $0 | $0 | $0 | $0 | $0 | $0 | $0 | $0 | $0 | $0 | |
| Other Liabilities Principal Repayment | $0 | $0 | $0 | $0 | $0 | $0 | $0 | $0 | $0 | $0 | $0 | $0 | |
| Long-term Liabilities Principal Repayment | $0 | $1,400 | $1,400 | $1,400 | $1,400 | $1,400 | $1,400 | $1,400 | $1,400 | $1,400 | $1,400 | $1,400 | |
| Purchase Other Current Assets | $0 | $0 | $0 | $0 | $0 | $0 | $0 | $0 | $0 | $0 | $0 | $0 | |
| Purchase Long-term Assets | $0 | $0 | $0 | $0 | $0 | $0 | $0 | $0 | $0 | $0 | $0 | $0 | |
| Dividends | $0 | $0 | $0 | $0 | $0 | $0 | $0 | $0 | $0 | $0 | $0 | $0 | |
| Subtotal Cash Spent | $5,390 | $6,726 | $6,668 | $6,782 | $8,254 | $31,698 | $42,901 | $36,356 | $40,501 | $47,033 | $48,941 | $49,847 | |
| Net Cash Flow | ($5,390) | ($6,726) | ($6,668) | ($6,782) | $1,261 | ($20,778) | ($3,887) | $4,924 | $4,409 | $1,264 | $6,853 | $8,227 | |
| Cash Balance | $94,610 | $87,884 | $81,216 | $74,433 | $75,695 | $54,917 | $51,030 | $55,954 | $60,363 | $61,627 | $68,480 | $76,707 | |
| Pro Forma Balance Sheet | |||||||||||||
| Month 1 | Month 2 | Month 3 | Month 4 | Month 5 | Month 6 | Month 7 | Month 8 | Month 9 | Month 10 | Month 11 | Month 12 | ||
| Assets | Starting Balances | ||||||||||||
| Current Assets | |||||||||||||
| Cash | $100,000 | $94,610 | $87,884 | $81,216 | $74,433 | $75,695 | $54,917 | $51,030 | $55,954 | $60,363 | $61,627 | $68,480 | $76,707 |
| Accounts Receivable | $0 | $0 | $0 | $0 | $0 | $28,547 | $57,502 | $60,175 | $64,208 | $73,511 | $81,576 | $86,107 | $90,845 |
| Inventory | $0 | $0 | $0 | $0 | $0 | $17,325 | $18,150 | $18,975 | $20,625 | $24,915 | $25,905 | $27,720 | $28,875 |
| Other Current Assets | $15,000 | $15,000 | $15,000 | $15,000 | $15,000 | $15,000 | $15,000 | $15,000 | $15,000 | $15,000 | $15,000 | $15,000 | $15,000 |
| Total Current Assets | $115,000 | $109,610 | $102,884 | $96,216 | $89,433 | $136,567 | $145,569 | $145,180 | $155,787 | $173,789 | $184,108 | $197,307 | $211,427 |
| Long-term Assets | |||||||||||||
| Long-term Assets | $0 | $0 | $0 | $0 | $0 | $0 | $0 | $0 | $0 | $0 | $0 | $0 | $0 |
| Accumulated Depreciation | $0 | $0 | $0 | $0 | $0 | $0 | $0 | $0 | $0 | $0 | $0 | $0 | $0 |
| Total Long-term Assets | $0 | $0 | $0 | $0 | $0 | $0 | $0 | $0 | $0 | $0 | $0 | $0 | $0 |
| Total Assets | $115,000 | $109,610 | $102,884 | $96,216 | $89,433 | $136,567 | $145,569 | $145,180 | $155,787 | $173,789 | $184,108 | $197,307 | $211,427 |
| Liabilities and Capital | Month 1 | Month 2 | Month 3 | Month 4 | Month 5 | Month 6 | Month 7 | Month 8 | Month 9 | Month 10 | Month 11 | Month 12 | |
| Current Liabilities | |||||||||||||
| Accounts Payable | $0 | $0 | $59 | $171 | $2,933 | $45,762 | $49,805 | $43,798 | $51,098 | $60,586 | $61,577 | $64,078 | $66,575 |
| Current Borrowing | $0 | $0 | $0 | $0 | $0 | $0 | $0 | $0 | $0 | $0 | $0 | $0 | $0 |
| Other Current Liabilities | $0 | $0 | $0 | $0 | $0 | $0 | $0 | $0 | $0 | $0 | $0 | $0 | $0 |
| Subtotal Current Liabilities | $0 | $0 | $59 | $171 | $2,933 | $45,762 | $49,805 | $43,798 | $51,098 | $60,586 | $61,577 | $64,078 | $66,575 |
| Long-term Liabilities | $85,000 | $85,000 | $83,600 | $82,200 | $80,800 | $79,400 | $78,000 | $76,600 | $75,200 | $73,800 | $72,400 | $71,000 | $69,600 |
| Total Liabilities | $85,000 | $85,000 | $83,659 | $82,371 | $83,733 | $125,162 | $127,805 | $120,398 | $126,298 | $134,386 | $133,977 | $135,078 | $136,175 |
| Paid-in Capital | $50,000 | $50,000 | $50,000 | $50,000 | $50,000 | $50,000 | $50,000 | $50,000 | $50,000 | $50,000 | $50,000 | $50,000 | $50,000 |
| Retained Earnings | ($20,000) | ($20,000) | ($20,000) | ($20,000) | ($20,000) | ($20,000) | ($20,000) | ($20,000) | ($20,000) | ($20,000) | ($20,000) | ($20,000) | ($20,000) |
| Earnings | $0 | ($5,390) | ($10,775) | ($16,155) | ($24,299) | ($18,595) | ($12,236) | ($5,218) | ($512) | $9,403 | $20,130 | $32,228 | $45,252 |
| Total Capital | $30,000 | $24,610 | $19,225 | $13,845 | $5,701 | $11,405 | $17,764 | $24,782 | $29,488 | $39,403 | $50,130 | $62,228 | $75,252 |
| Total Liabilities and Capital | $115,000 | $109,610 | $102,884 | $96,216 | $89,433 | $136,567 | $145,569 | $145,180 | $155,787 | $173,789 | $184,108 | $197,307 | $211,427 |
| Net Worth | $30,000 | $24,610 | $19,225 | $13,845 | $5,701 | $11,405 | $17,764 | $24,782 | $29,488 | $39,403 | $50,130 | $62,228 | $75,252 |


