
Adorable Pet Photography
Executive Summary
Owners and their beloved pets … this is what makes our world go around. We are aware that there are many photographic studios, at either end of the spectrum, that will consider photographing a pet. However, they do not openly welcome your furry family members. At Adorable Pet Photography, pets are our only business. We are dedicated to capturing a moment you can remember forever to preserve a special relationship. With many years of experience, and a gentle approach in an unhurried environment, we will preserve your memories in a beautiful piece of photographic art. Our strong commitment to client satisfaction is showcased by the perfect photograph that captures the personality of the pet and the loving relationship between the pet and owner.
Adorable Pet Photography is a small business aimed at bringing a smile to every pet owner’s face when they see their beautiful family member captured in a stunning portrait. Our goal of superior customer service and satisfaction will take dedication on the part of all staff members and vendors. The vision manifests itself in three ways:
- Produce the same outstanding quality results time after time.
- Be recognized as the top pet photographer in the Southeast.
- Be steadfast to our commitment for customer service and satisfaction.
Our keys to success will be providing high quality portraits, competitive pricing, and excellent customer service as our hallmark.
Adorable Pet Photography is currently located in Atlanta, Georgia. We will have a staff of two, with plans to expand to a full-time operation within the next five years. The company is established as a home-operated, part-time sole proprietorship. It is the intention of the company to develop sales and broaden the client base so as to become a full-time business. The company will offer a full range of custom portrait packages. Portrait sittings are available in either the well-equipped studio, the comfort of the client’s home, or in an outdoor setting. The owner serves as the head photographer, and will require one assistant. Adorable Pet Photography is invested in the community. It will provide pro bono service to the local humane society and funding of awards for local dog and cat specialty shows.
The founder of Adorable Pet Photography has a long history as a successful photographer. A graduate of the Showcase School in Atlanta, his architectural photographs have been published in magazines such as Atlanta and Southern Living. The founder owns all of his equipment; therefore, no financial outlay is required for photographic equipment. Because Adorable Pet Photography is a home-based business, overhead is low. Salary for the owner will be withdrawn from the year-end funds once the business is established and profitable. The owner is investing $10,000 from his personal savings, along with another $10,000 from a personal friend. This limits the short-term debt to $12,350 from the owner’s credit union, for which the business is already pre-approved.
All photographs taken by Adorable Pet Photography will carry proper copyright notice. This notice of copyright will offer protection against a claim of “innocent infringement” on the part of a client. Some clients of Adorable Pet Photography will require copyright release forms; this will primarily involve breeders and pet specialty show organizers who will need to use the photographs for publication.
The company will offer a wide variety of products, such as: formal studio portraits, location portrait sessions, holiday candid photographs, portrait finishes, and framing.
Adorable Pet Photography will aggressively seek out local vendors to form strategic alliances in order to to reduce the cost of supplies and offer more services to the client.
Many of today’s white-collar professionals, between the ages of 26 and 60, have at least one pet in the household. The pet is treated as a family member, and the owners spend approximately $26 billion annually for gourmet food, cosmetic services, health care, and specialty items. Adorable Pet Photography will reach this audience by targeting clients of these existing markets. We will fill an existing need for the client by specializing in pet photography. Through advertisements in the print media, brochures, and establishing working relationships with pet organizations and pet specialty businesses frequented by our potential client base, we will highlight our quality products and services.
What makes this industry so attractive is that, although the number of U.S. households with pets has held steady at approximately 58 million over the past ten years, the amount of money Americans spend on their pets has exploded. In 1993, overall retail sales of pet-related items were approximately $16 billion. By 1997 this number had risen to $22.6 billion, and by 2001, that number is expected to jump to $28.5 billion. Industry experts expect sales to grow steadily for the next five years, from three to 15 percent. This increased importance and love for the family pet has caused existing pet services to flourish and has created entirely new fields of pet care. Scores of entrepreneurs, such as the Petco superstores, are developing businesses catering to pet owners.
Adorable Pet Photography is in a unique position of competition. We compete against the standard portrait studio that may photograph pets, but only as an adjunct to photographing people. We compete against two other exclusive pet photographers in the Atlanta Metropolitan area, and a host of amateur photographers. The benefits and drawbacks of each of our competitors, compared with the services we offer, are hardly a match in quality and price.
The critical threats to this business venture are:
- Sudden negative change in the local or national economy, since this is a luxury item.
- Increased competition in the metropolitan Atlanta market.
- Unsuccessful partnerships with pet specialty show organizers, breeder associations, and pet specialty stores.
One of the new threats to photographic studios is the advent of the computer/digital imaging process. Many sources believe that in the years to come we will replace traditional film with digital images. While this may be true of the amateur photographer and the commercial or technical photographer, we at Adorable Pet Photography believe that the time-honored artistry of photography, exhibited by Ansel Adams, Yuseff Karsh, Annie Leibowitz, and other famous photographers, will continue to be recorded on film. While we certainly believe that digital imagery is an enhancement to the portrait photographer, and its application in portrait photography will increase, we do not believe that it is a replacement for artistic talent.
Adorable Pet Photography’s competitive edge is its commitment to customer service and satisfaction. We offer an array of services, flexible scheduling, and have the latest technology to produce beautiful photographic portraits. At Adorable Pet Photography, pets are our primary business, not a sideline or hobby. We understand pets and how to get the right elements together for a successful portrait session. We are patient, and our number-one goal is quality results.
Data suggests that the best way to reach Adorable Pet Photography’s target audience for portrait photography is through the pet-related services they use. Adorable Pet Photography will establish working relationships with businesses such as grooming salons, specialty pet stores, and veterinary clinics. We hope to place brochures and framed pet portraits in these locations. Another strong marketing opportunity is available through the local area pet shows and local breeder associations. Finally, Adorable Pet Photography will establish relationships with pet specialty stores to offer candid photographs of pets and owners in seasonal vignettes. Although this generates revenue, it will be used as a marketing tool to increase exposure to our target market.

By beginning on a smaller scale, Adorable Pet Photography has the foresight to grow at a rapid pace to keep up with demand. We wish to maintain a steady rate of sales growth; however, we understand that sales will vary in different months. We expect rapid increases during holiday seasons that will boost sales, then allow that growth to level off at a steady rate.
The break-even point will be reached more rapidly for Adorable Pet Photography than for other types of home-based businesses since start-up costs are limited and there is little to no staff to pay in the beginning. January is expected to be the slowest month of the year, since this is the post-holiday slump.
Our cash situation is optimum. Although Adorable Pet Photography begins with little extra cash, our increased growth allows the business to gain financial ground quickly. The cash flow is negative for only two months of the first year, during the expected off-season months; the business will be prepared for this with cash reserves, and will maintain positive cash balances.

1.1 Mission
Today’s environment presents the consumer with an array of choices. Adorable Pet Photography strives to be the best choice for the client. Providing high quality portraits, competitive pricing, and excellent customer service is our hallmark. Pet photography, even in a strong economy, is a luxury; therefore, our customers will receive a portrait that captures not only the beauty of their pet, but also the personality. This will be achieved through client interviews and patiently spending time with each pet to make them comfortable in the setting chosen by the owner. At Adorable Pet Photography, we view pets as members of the family. Through consistent, high-quality results we are committed to providing each client with value and satisfaction.
1.2 Keys to Success
The key to success at Adorable Pet Photography includes our commitment to quality and customer satisfaction. We will be responsible for ensuring a high degree of professionalism in three areas:
- Consistent fulfillment of the clients’ expectations.
- Competitive pricing for the quality and array of services offered.
- A fair and reasonable profit on each portrait.
1.3 Objectives
Adorable Pet Photography is a small business aimed at bringing a smile to every pet owner’s face when they see their beautiful family member captured in a stunning portrait. Our goal of superior customer service and satisfaction will take dedication on the part of all staff members and vendors. The vision manifests itself in three ways:
- Produce the same outstanding quality results time after time.
- Be recognized as the top pet photographer in the Southeast.
- Be steadfast to our commitment for customer service and satisfaction.
Company Summary
Adorable Pet Photography was planned to be a part-time business venture. It will be a small business designed to meet the needs of its clients and their pet family members. We are currently located in Atlanta, Georgia. Adorable Pet Photography will have a staff of two, with plans to expand to a full-time operation within the next five years. The owner serves as the head photographer, and will require one assistant. Adorable Pet Photography is invested in the community. It will provide pro bono service to the local humane society and funding of awards for local dog and cat specialty shows.
The staff of Adorable Pet Photography understands the value of our client’s time and provides flexible schedules and locations for photographic services. We also understand the desire of the client to be satisfied with the value received for the money spent. At Adorable Pet Photography, we accept nothing but the best from ourselves and our suppliers.
2.1 Company Ownership
Adorable Pet Photography is established as a home operated, part-time sole proprietorship. It is the intention of the company to develop sales and broaden the client base so as to become a full-time business. The company will offer a full range of custom portrait packages. Portrait sittings are available in either the well-equipped studio, the comfort of the client’s home, or in an outdoor setting.
2.2 Start-up Summary
The founder of Adorable Pet Photography has a long history as a successful photographer. A graduate of the Showcase School in Atlanta, his architectural photographs have been published in magazines such as Atlanta and Southern Living. The founder owns all of his equipment; therefore, no financial outlay is required for photographic equipment. Because Adorable Pet Photography is a home-based business, overhead is low. Funding is provided from various sources: a short-term loan, the founder’s savings, and an investment from a friend.
It is the intention of the founder to keep the personal touch in the business and to keep overhead to a minimum, even as the business grows. Both the founder and the investor own homes and have spotless credit ratings.

| Start-up Funding | |
| Start-up Expenses to Fund | $7,350 |
| Start-up Assets to Fund | $25,000 |
| Total Funding Required | $32,350 |
| Assets | |
| Non-cash Assets from Start-up | $11,500 |
| Cash Requirements from Start-up | $13,500 |
| Additional Cash Raised | $0 |
| Cash Balance on Starting Date | $13,500 |
| Total Assets | $25,000 |
| Liabilities and Capital | |
| Liabilities | |
| Current Borrowing | $10,000 |
| Long-term Liabilities | $0 |
| Accounts Payable (Outstanding Bills) | $0 |
| Other Current Liabilities (interest-free) | $0 |
| Total Liabilities | $10,000 |
| Capital | |
| Planned Investment | |
| John M. Ford | $12,350 |
| Roger M. Parvin | $10,000 |
| Additional Investment Requirement | $0 |
| Total Planned Investment | $22,350 |
| Loss at Start-up (Start-up Expenses) | ($7,350) |
| Total Capital | $15,000 |
| Total Capital and Liabilities | $25,000 |
| Total Funding | $32,350 |
| Start-up | |
| Requirements | |
| Start-up Expenses | |
| Legal | $750 |
| Stationery etc. | $300 |
| Brochures | $2,000 |
| Consultants | $1,000 |
| Insurance | $1,300 |
| Rent | $0 |
| Research and development | $0 |
| Expensed equipment | $2,000 |
| Other | $0 |
| Total Start-up Expenses | $7,350 |
| Start-up Assets | |
| Cash Required | $13,500 |
| Start-up Inventory | $1,500 |
| Other Current Assets | $10,000 |
| Long-term Assets | $0 |
| Total Assets | $25,000 |
| Total Requirements | $32,350 |
2.3 Company Locations and Facilities
Adorable Pet Photography is located inside the city limits of Atlanta, Georgia. It is a home-based business, with an area of the lower floor dedicated to client reception, portrait viewing/gallery, office, and a 500 square-foot studio. Clients can elect to have the portrait sitting done in the studio, on location in the client’s home, or in an outdoor setting.
Our office is equipped with the latest in business technology: telephone systems, computers, fax machines, email, copiers, printers, and software. The company will maintain a high degree of professionalism by using only the highest-quality photographic equipment and film to produce its portraits.
2.4 Legal Considerations
Adorable Pet Photography will be operated as a sole proprietorship. This creates simplicity since little is required to begin operations: there is minimal paperwork, and no legal counsel is necessary to create set-up documents. Salary for the owner will be withdrawn from the year-end funds, once the business is established and profitable. Taxes will be paid via the personal return of the owner, as personal income tax rates are lower than the corporate rate. Among the disadvantages would be difficulty in obtaining outside financing during start-up; however, the owner already owns a full array of professional photographic equipment and is investing $10,000 from his personal savings, along with another $10,000 from a personal friend. This limits the short-term debt to $12,350 from the owner’s Credit Union, for which the business is already pre-approved.
The owner has received an affirmative answer from the Small Business Development Center of Fulton County, Georgia, for obtaining a business license for the company to operate in a residential neighborhood, since noise, traffic, and pollution are not factors to be considered in this type of business.
Two types of insurance will be needed for the company. The owner’s current insurance is through State Farm, who offers a full line of insurance coverage. Photographic equipment will be insured for its full value by adding a rider to the existing homeowner’s policy. An additional umbrella policy for up to $3 million will be issued to cover liability. Since this is starting as a part-time business, disability, health, and life insurance are already in place through the owner’s primary place of employment. As this expands to a full-time business, this coverage will continue in place as part of the owner’s retirement benefits. Since this is a small business with only one part-time employee, there will be no benefits package. As the business expands, the issue of benefits will be re-evaluated based on the needs of the qualified staff added to the company.
Copyright is a form of protection for original works that photographers enjoy. It is afforded automatically to any work, immediately on its creation in fixed form, and the copyright on the work normally becomes the property of the creator. Filling out a form and paying the necessary fee to the U.S. Copyright Office does not copyright a work. Copyright is part and parcel of the creation process. There is no requirement to register a copyright, but it is best to do so as a way of claiming a copyright. Registration helps immensely if suit for copyright infringement is necessary. All photographs taken by Adorable Pet Photography will carry proper copyright notice. This notice of copyright will offer protection against a claim of “innocent infringement” on the part of a client. In addition to this information being printed on the back of each photograph, the sales contract will include the same information.
Some clients of Adorable Pet Photography will require copyright release forms; this will primarily involve breeders and pet specialty show organizers who will need to use the photographs for publication.
A one-time consultation with an attorney will be obtained during the start-up process. This consultation will be used to develop necessary forms for the business and provide advice on any further legal considerations needed.
Products and Services
Adorable Pet Photography offers a variety of products and services to meet our client’s needs. We offer specific information on each of our products to the prospective client. This information is designed to help the client select a setting for the portrait session. The pictures we provide give the client a feel for the variety of poses that can be used, and help them decide if they wish to incorporate other family members in the portrait. The discussion of the different settings helps the client select a studio session, home session, or outdoor location for the portrait. We also provide instructions for each setting. For example, for formal portrait sessions, we provide detailed instructions to the owner for aiding their pet to feel at home in unfamiliar surroundings, and items such as a favorite toy or blanket to bring along to the session. The following sections are examples of the services we provide and the resulting product.
3.1 Product and Service Description
Formal Studio Portrait:
The studio is a controlled environment, free from distraction, where the pet can be comfortably posed and lighted to enhance the beauty of the final image. A variety of props and backgrounds will be used to stage a setting that will highlight the pet’s features and coat color. These sessions must not be rushed, so the pet can become comfortable in the studio environment and be certain that the studio lights do not frighten or excite the pet. There is a standard charge for the portrait session which we refer to as the sitting fee. The owner is provided immediate digital images to be certain we have captured a pleasing likeness. These digital images are not the final proofs, but they do provide photographer and client with the assurance the session is accomplishing the desired outcome. A total of 24 proof-quality photographs will be provided for the client within five days of the photo session. The client will then have ten days to consider the images and the portrait packages before making a final selection.
Location Portrait Session:
The pet may be more comfortable in the home or a familiar outdoor location. The staff of Adorable Pet Photography will travel to the location prior to the portrait session to select an area that is best suited for the session and is most acceptable to the owner. Prior to the session, Adorable Pet Photography staff will stage the lighting and any other props needed for the photo session. Although the digital image capability is not available for on-location sessions, 12 additional photographs will be taken to ensure the client an array of choices for the final image. If the location selected for the photo session is in a public park, the owner, not Adorable Pet Photography, is legally responsible for the behavior of the pet. There are two on-location photo session fees. The fee for a photo session in the home is more than the studio because the equipment must be transported, staged, and then broken down. The fee for the photo session in an outdoor location is the most expensive because an assistant is required for managing light-enhancing equipment throughout the session. The client will be provided 36 photographic-quality images within five working days of the photo session. The client will then have ten working days to consider the images and the portrait packages before making a final selection.
Holiday Candid Photographs:
Adorable Pet Photography, through arrangements with local pet stores and other pet specialty stores, will provide pet owners with the opportunity to have 12 snapshot-quality photographs taken of their pet with Santa Claus or the Easter Bunny. Adorable Pet Photography will also be available at these locations for other holiday-themed candids, such as Valentine’s Day, Mother’s Day, Father’s Day, Fourth of July, Halloween, and Thanksgiving. The fee for these candid photos is standard and includes twelve photos that will be mailed to the client within five days. Negatives from these photo sessions will remain the property of Adorable Pet Photography should the client wish to have reprints made.
Additional Services:
Adorable Pet Photography is aware that a pet portrait is an investment as well as a cherished memory. We offer a variety of portrait finishes from which to choose. These finishes will be shown to the client upon pick up of the proofs, and the client will be given a brochure which illustrates these finishes to compliment a variety of pet images. These finishes are used on the beautiful portraits that are displayed in our studio gallery. Adorable Pet Photography also offers custom and ready made framing for all portraits. We have a beautiful selection of tabletop frames to enhance the client’s selection, and a variety of framing materials displayed in the studio for custom frame construction. At Adorable Pet Photography we are committed to customer service and satisfaction.
3.2 Fulfillment
Adorable Pet Photography employs local vendors who have the same desire to be the best at what they do. Through the use of reliable local vendors, we are able to reduce the cost of supplies and offer more services to the client. We use only Kodak™ film, which is processed by APA Laboratories. APA Laboratories deals only with professional photographers and offers the latest in photo finishes and portrait sizes. By using the services of APA Laboratories, Adorable Pet Photography is able to reduce the need for additional personnel, expensive photographic laboratory equipment and supplies, thus minimizing our start-up cost and capital investment. This saving trickles down to the client in our portrait-package pricing. At Adorable Pet Photography, we concentrate on the artistic quality of the portrait image; we leave the enhancement of that image to the taste of the client and the professionals at APA Laboratories.
3.3 Competitive Comparison
Adorable Pet Photography is one of three photographers in the Atlanta area that specialize in pet portraits.We are experts in working with pets to make them comfortable and to bring out the inner quality and personality of the pet. We also work with the other family members to include them in the portrait session, if that is the desire of the client. Although we are a new organization, we are not novices to photography or photographing pets. Our scheduling and location flexibility are specifically geared to be client friendly.
The fee schedules for Adorable Pet Photography portraits are competitively priced. No other area photographer offers the flexibility and array of services provided to the client at Adorable Pet Photography. Our commitment to customer service and satisfaction is unequaled.
The critical threats to this business venture are:
- Sudden negative change in the local or national economy, since this is a luxury item.
- Increased competition in the metropolitan Atlanta market.
- Unsuccessful partnerships with pet specialty show organizers, breeder associations, and pet specialty stores.
At Adorable Pet Photography, we care about our community. We use only local suppliers who have a reputation for excellence and timeliness; thus, we add back to the economy of the area. We participate with the local Humane Society by creating a virtual adoption page on their website by photographing the animals available for adoption. These photographs have helped to increase the adoption rates of the local programs.
3.4 Technology
Digital imaging technology has brought new and exciting tools to photography. Today the client can see the images recorded in the studio moments after they are taken. High-resolution printers make a print of the image readily available–no processing of film is required. The software to control and manipulate the digital images can remove unwanted objects and shadows, and enhance other qualities. Many sources believe that in the years to come we will replace traditional film with digital images. While this may be true of the amateur photographer and the commercial or technical photographer, we at Adorable Pet Photography believe that the time-honored artistry of photography, exhibited by Ansel Adams, Yuseff Karsh, Annie Leibowitz, and other famous photographers, will continue to be recorded on film.
With a single piece of equipment–the camera–different film emulsions can be used to control grain, contrast, tone, and texture of an image. This image, and the lighting of the subject, is composed in the artistic eye of the photographer and captures a moment in time. While we certainly believe that digital imagery is an enhancement to the portrait photographer, and its application in portrait photography will increase, we do not believe that it is a replacement for artistic talent.
Market Analysis Summary
Many of today’s white collar professionals, between the ages of 26 and 60, have at least one pet in the household. The pet is treated as a family member; and the owners spend approximately $26 billion annually for gourmet food, cosmetic services, health care, and specialty items (Hunter, 1999). Adorable Pet Photography will reach this audience by targeting clients of these existing markets. We will fill an existing need for the client by specializing in pet photography. Through advertisements in the print media, brochures, and establishing working relationships with pet organizations and pet specialty businesses frequented by our potential client base, we will highlight our quality products and services.
4.1 Market Segmentation
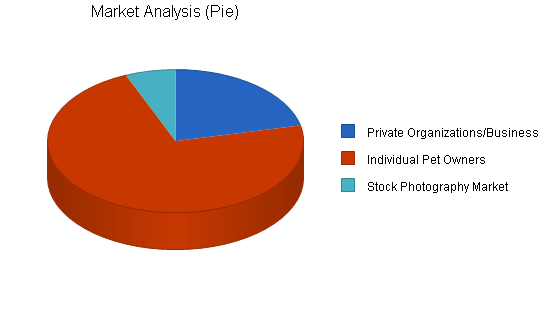
The breakdown for the market for Pet Photography is somewhat diverse, as are the products designed to meet those needs. Individuals, as well as organizations, require the services that we provide. In order to provide the greatest depth, the market segments have been broken down into private organizations and individuals stratified by age groups.
Private Organizations and Businesses:
Private organizations and businesses, such as the American Kennel Club, sponsor specialty pet show events. Championship pet breeders represent the second largest volume in units, but the most exposure to other potential clients, in the pet owner segment. The pet shows will generate documentary photographs for the organizers of the show as well as publicity photographs for the winning pet owners. This category has the potential for tremendous referral and direct sales to pet owners. In addition, the market potential for professional breeders of championship stock for quality studio portraits is high.
Pet Owners:
The market in this category can be further divided into product lines designed to meet the needs of pet owners:
- Studio and Location Portraits: This category will generate the second-highest level of income for the business; the market segment will be white collar professionals 26-60 years old. Individuals that fall into this age group have at least one pet per household and spend in excess of $25 billion dollars annually on their pets. The studio portraits will capture a lasting memory, and the location portraits will highlight the relationship with the family at home.
- Seasonal Promotions: This category represents the highest level of sales. The product in this category will appeal to the same age group, but focuses on a more candid photograph to capture the pet in a theme setting such as Christmas, Valentine’s Day, or Halloween.
Stock Photography Market:
Copyright of all photographs taken by Adorable Pet Photography will be retained unless the rights are specifically sold to the pet owner and the negatives are released. These photographs will be marketed as stock photography for use on calendars or promotional material. While this represents a small volume in overall sales, it represents a tremendous potential for exposure to new clients.
| Market Analysis | |||||||
| Year 1 | Year 2 | Year 3 | Year 4 | Year 5 | |||
| Potential Customers | Growth | CAGR | |||||
| Private Organizations/Businesses | 20% | 850 | 1,020 | 1,224 | 1,469 | 1,763 | 20.01% |
| Individual Pet Owners | 15% | 2,865 | 3,295 | 3,789 | 4,357 | 5,011 | 15.00% |
| Stock Photography Market | 10% | 250 | 275 | 303 | 333 | 366 | 10.00% |
| Total | 15.84% | 3,965 | 4,590 | 5,316 | 6,159 | 7,140 | 15.84% |
4.2 Target Market Segment Strategy
Our target markets are middle- to upper-middle class families, couples, individuals, or private organizations and businesses. We chose these groups because they are most likely to have pets who would be considered a member of the family, and because they are most able to afford high-quality studio portraits of their pets.
In today’s current environment, pets occupy a prominent place in a family, or as the central focus of attention in a single household. Sales trends for pet-related merchandise have shown substantial annual increases since 1996 (Bunn, 1998). Pet industry sales closely parallel the general trends, such as gourmet foods, high-fashion accessories, and medical and dental needs (Simpson, 1998). Adorable Pet Photography fills a need for capturing a moment in time, or preserving a special relationship and providing loved ones (the human kind) with a high quality portrait of them and their best friend. Considering the rise in income and population, coupled with the increased spending for pet-related items and services, the demand for pet photography services can only increase.
4.2.1 Market Trends
As Americans have enjoyed increased standards of living, they expect to pass this on to their pets. Where consumers used to pick up pet food on their weekly excursion to the grocery store, they now buy gourmet premium foods, which exclude animal by-products and replace them with prime cuts of meats and other high-level ingredients, some of which are sold only through veterinary offices. Dog and cat owners spent $8.7 billion on pet food in 1996, and the market is expected to reach $10.5 billion by 2001 (Bunn, 1998).
In addition to regular meal planning, dog-centric bakeries are now found in major cities that offer the ultimate in guilty canine pleasure, using natural ingredients (no sugar, carob instead of chocolate, etc.) to create food and treats similar to those of their owners (chocolate-flavored croissant-like dog biscuits, for example). One company, Alaska Canine Cookies, went international and reported a 400 percent growth rate in their first year, 1996, and settled into a more manageable 200 percent rate in 1999 (Veltkamp, 1999).
The market trend, as the human element permeates the pet industry, leads to pets not being buried in shoeboxes in the back yard as much as they once were. The trend, since 1996, has been to give an animal a proper funeral. There were 650 pet cemeteries and crematories active in business in 1996, with the cost of a pet burial between $235 to $800 (Powell, 1998). The market segment of pet owners is becoming a more solid profit maker, with the trend towards spending more money on a pet with every passing year.
4.2.2 Market Growth
The number of U.S. households with pets has held steady at approximately 58 million over the past ten years, with an estimated six of ten U.S. households owning a pet in 1996, up from 56 percent in 1988. There were 59.1 million pet cats in 1996, up 3.6 percent, and 59.2 million pet dogs, up less than one percent. However, the amount of money Americans spend on their pets has exploded. In 1993, overall retail sales of pet-related items were approximately $16 billion. By 1997 this number had risen to $22.6 billion, and by 2001, that number is expected to jump to $28.5 billion (Hunter, 1999). Industry experts expect sales to grow steadily for the next five years, from three to 15 percent, according to surveys conducted by the Pet Industry Joint Advisory Council (Powell, 1998). Thus, while there does not seem to be a great increase in people who own pets, the ones that do have them are valuing them more.
The veterinary services market totals $20 billion annually. According to an annual American Animal Hospital Association survey, the average dog owner spends $187 per year on veterinary services alone (Littman, 1998). No longer is the primary care veterinarian handling all of their patient’s needs. Specialty care veterinarians who have additional training, such as surgeons, internal medicine specialists, ophthalmologists, and dermatologists, are in great demand (Tuthill, 1999). Doggie day-care centers are springing up all across the country and carving a niche in the pet-care industry. Busy professionals feel guilty about leaving their best friend alone all day, the animals can romp the day away in a “cage-free” environment. Centers for pampering pets, such as Hollywood Hounds in Los Angeles, feature pet massages, “pawdicures,” and complete make-overs for dogs. They even boast a backyard gazebo for “muttrimonies” and “barkmitzvahs.” While kennels have always been around, modern day dog and cat owners are being more selective for their four-legged loved ones when leaving town for a business trip or vacation. Thus pet sitters, who come into the pet’s home and take care of them while the owner is away, and luxury pet lodging and resorts, which provide themed suites, nature walks, swimming pools, and nutritional/gourmet dinners, are reporting waiting lists (Jan, 1999).
There are 8,500 independent full-service pet stores in the U.S., and 1,150 pet superstores, such as Petsmart™ and Petco™ (Powell, 1998). Thus, this increased importance and love for the family pet has caused existing pet services to flourish and has created entirely new fields of pet care. Scores of entrepreneurs are developing businesses catering to pet owners.
4.2.3 Market Needs
Pets have always been an important part of the American family. However, as the American culture has changed in the last two decades, an even more prominent role for the pet has emerged. In today’s mobile society, people often lose touch with their community, friends, and family, so they draw closer to their pets. As more people put off having children until later in life, pets are increasingly lapping up the luxuries that had once been reserved for human housemates. Making pets into family members is typical of an economy driven by middle-aged professionals with two-income households and fewer, if any, children. These “baby boomers” are now hitting the peak years of 35 to 65. In some cases, the pet alleviates the Empty Nest Syndrome for older married couples. Their animals are not just pets but companions, and many owners consider their pets their children. Society is getting better educated and more accepting of pets across the board, and there is existing research that proves pets are a benefit to one’s health (Palmer, 1998). People are now treating their pets as children, a pampering not seen 20 years ago.
The importance of the family pet is evident, and it calculates into big business. People want to show how much they care. Thus, it only makes sense that this important member of the family should be included in the family portrait, or even have a separate photo shoot of their own. Indeed, with increasing frequency, we now see pictures of pets on employee’s desks in addition to, or instead of, human family members. A photography studio that openly welcomes animals appears to be a viable business unto itself.
4.3 Service Business Analysis
Adorable Pet Photography is in a unique position of competition. We compete against the standard portrait studio that may photograph pets, but only as an adjunct to photographing people. We compete against two other exclusive pet photographers in the Atlanta Metropolitan area, and a host of amateur photographers. The benefits and drawbacks of each of our competitors as compared with the services we offer are hardly a match in quality and price.
Standard Portrait Studios:
- Strengths: Established studio locations and support staff, often with repeat clients. Reputation as reliable and stable business.
- Weaknesses: Often very expensive, with little or no experience in pet photography. Pets are a sideline and not the major focus of the business. Can be inflexible with scheduling and out-of-studio work.
Other Exclusive Pet Photographers:
- Strengths: Have been in the market longer, have established client base and reputation.
- Weaknesses: Array of services is limited, inflexible with schedules, and limited studio capability. Quality of final portrait.
Local Amateur Photographers:
- Strengths: Pricing.
- Weaknesses: Quality of final product, lack of professional photographic equipment and skills.
4.3.1 Business Participants
The portrait photography business is composed of thousands of small, individually-owned studios, and several large franchise operations. Pet portrait photography is a new, but very successful, niche market which is experiencing rapid growth. While this segment of the industry is largely individually owned studios or “on location” photographers who operate without a studio, one company, PetStar™ is offering a franchise operation with instruction and low start-up costs.
Strategy and Implementation Summary
Adorable Pet Photography will use marketing databases to accurately target our market. Working closely with local pet show organizations, specialty pet stores, and other pet service businesses, we will place well-designed advertising material in these locations to illustrate our capabilities. Our portrait studio will maintain flexible hours and scheduling to accommodate and expand our client base. Because we are dedicated to customer service and satisfaction, we will use our client base to continually maintain our reputation for excellence.
5.1 Competitive Edge
Adorable Pet Photography’s competitive edge is its commitment to customer service and satisfaction. We offer an array of services, flexible scheduling, and have the latest technology to produce beautiful photographic portraits. At Adorable Pet Photography, pets are our primary business, not a sideline or hobby. We understand pets and how to get the right elements together for a successful portrait session. We are patient, and our number one goal is quality results.
5.2 Marketing Strategy
Data from PRIZM, a Boston-based marketing firm, suggest that the best way to reach Adorable Pet Photography’s target audience for portrait photography is through the pet-related services they use. Adorable Pet Photography will establish working relationships with businesses such as grooming salons, specialty pet stores, and veterinary clinics. We hope to place brochures and framed pet portraits in these locations.
Another strong marketing opportunity is available through the local area pet shows and local breeder associations. Adorable Pet Photography will establish a working arrangement with the Cherokee Cluster and Jack Onofrio pet show network to provide photographic services to document winning pets, their owner/breeder, and show judges. In addition to the exposure with breeders, Adorable Pet Photography will have an exhibit space at these pet shows with framed examples of our work, brochures, and business cards. This will increase our exposure to the attendees of the pet shows, most of whom are pet owners.
Finally, Adorable Pet Photography will establish relationships with pet specialty stores to offer candid photographs of pets and owners in seasonal vignettes. Although this generates revenue, it will be used as a marketing tool to increase exposure to people between 26 and 60 years old. This marketing strategy is aimed at increasing our studio and on-location portrait business.
5.2.1 Promotion Strategy
Adorable Pet Photography will use specialty pet show events to broaden our client base through direct marketing to individual pet owners and breeders attending the shows. Through an arrangement with the specialty pet show promoters, we will have a link to our website. On this link we will feature information about our services, pricing, location, and showcase examples of previous work. We will advertise our services by placing brochures and finished photographic works of art in pet specialty stores, grooming salons, and veterinary clinics. Through the Showcase School of Photography, we will offer classes for teaching amateur photographers how to take successful candid photographs of their own pets. Finally, we will place ads in the American Kennel Club’s monthly magazine. These advertisements target breeders and pet enthusiasts, and highlight Adorable Pet Photography’s quality portrait packages and reasonable prices.
5.2.2 Positioning Statement
For the pet owner who desires a photographic portrait, Adorable Pet Photography’s custom portrait package will capture the beauty and personality of the pet and document a lasting and cherished piece of art. Unlike portrait studios that photograph pets only as a sideline, pets are our only business. We understand that a pet is an important family member and that this special relationship should be captured in a way that pleases the client.
5.3 Sales Strategy
Adorable Pet Photography’s sales strategy is to showcase the proof portraits for the photo sessions in a beautiful folio. We will present all proof photographs for the client’s consideration; however, we will select and highlight the portraits that capture beauty and personality, and we will enhance the beauty by grouping photos in our custom folios. We will take the time to discuss the proofs with the client and ensure that the customer is satisfied with the results.
5.3.1 Sales Forecast
By beginning on a smaller scale, Adorable Pet Photography has the foresight to grow at a rapid pace to keep up with demand. We wish to maintain a steady rate of sales growth; however, we understand that sales will vary in different months. As noted in the following chart and table, rapid increases during the holiday seasons will boost sales, then allow that growth to level off at a steady rate.
Being a new business, we realize that the home and studio portrait sessions will be the slowest to grow because they require initial marketing efforts and advertising; after the first year, we anticipate a 10 to 20 percent growth rate. The Holiday Seasonal Promotion and the Pet Show Location segments target an existing market already built by the pet specialty sponsors and merchants. Because the client base is already established, this will be the first segment of the business to show rapid growth. Predicted growth rate for these segments is also 10 to 20 percent.

| Sales Forecast | |||
| Year 1 | Year 2 | Year 3 | |
| Unit Sales | |||
| Studio Portrait Sessions | 575 | 633 | 760 |
| Holiday Location Promotions | 2,225 | 2,448 | 2,500 |
| Pet Show Locations | 850 | 1,063 | 1,275 |
| Home Portrait Sessions | 65 | 81 | 93 |
| Total Unit Sales | 3,715 | 4,225 | 4,628 |
| Unit Prices | Year 1 | Year 2 | Year 3 |
| Studio Portrait Sessions | $50.00 | $50.00 | $55.00 |
| Holiday Location Promotions | $20.00 | $20.00 | $20.00 |
| Pet Show Locations | $10.00 | $10.00 | $10.00 |
| Home Portrait Sessions | $100.00 | $100.00 | $125.00 |
| Sales | |||
| Studio Portrait Sessions | $28,750 | $31,650 | $41,800 |
| Holiday Location Promotions | $44,500 | $48,960 | $50,000 |
| Pet Show Locations | $8,500 | $10,630 | $12,750 |
| Home Portrait Sessions | $6,500 | $8,100 | $11,625 |
| Total Sales | $88,250 | $99,340 | $116,175 |
| Direct Unit Costs | Year 1 | Year 2 | Year 3 |
| Studio Portrait Sessions | $12.00 | $12.60 | $13.20 |
| Holiday Location Promotions | $8.00 | $8.40 | $8.80 |
| Pet Show Locations | $1.30 | $1.37 | $1.43 |
| Home Portrait Sessions | $20.00 | $22.00 | $24.00 |
| Direct Cost of Sales | |||
| Studio Portrait Sessions | $6,900 | $7,976 | $10,032 |
| Holiday Location Promotions | $17,800 | $20,563 | $22,000 |
| Pet Show Locations | $1,105 | $1,456 | $1,823 |
| Home Portrait Sessions | $1,300 | $1,782 | $2,232 |
| Subtotal Direct Cost of Sales | $27,105 | $31,777 | $36,087 |
Management Summary
The management of Adorable Pet Photography will be very simple in the first few years. In addition to performing the artistic functions of the business, the photographer is also the proprietor and initially must be involved in all aspects of the business, such as marketing, payroll, management of both accounts receivable and accounts payable, and other miscellaneous business details. Additional personnel can be added as the business accounts grow, in order to alleviate these responsibilities from the photographer.
The staff for the first two years of operation will consist of one part-time individual who will serve as an office and photographer’s assistant. In the third year of operation, this position will be upgraded to a full-time assistant as the assumptions regarding profitability come to pass.
Adorable Pet Photography’s growth will be deliberate rather than fast paced. It is possible that the business will need additional staff. Gaps in the personnel structure might well occur in the support staff. It is a reasonable assumption that the demands of the office, and also assisting the photographer, might become too much for one individual. Depending on the strengths of the individual that fills the first part-time position, the second staff member will be hired as a complement, and both will be trained in the other’s duties.
6.1 Personnel Plan
Because the business is small, there is no need for an elaborate personnel structure. The receptionist/photographer assistant position will initially only be needed part time. The following table assumes that this position will become full time in fiscal year 2003. No salary is set for the owner, and will be determined at year end, based on profitability of the business. This is feasible only because the owner has additional income to support normal living expenses.
A reasonable staff for start-up would be one part-time employee in addition to the photographer. The duties and job description would for this person would include:
- General reception duties, including phones, mail, and greeting customers.
- Setting appointments and managing appointment calender.
- Tracking inventory and supplies.
- Billing, handling both accounts receivable and accounts payable.
- Assist photographer in portrait sessions.
- Assist with marketing strategies and plans.
| Personnel Plan | |||
| Year 1 | Year 2 | Year 3 | |
| Payroll | $11,000 | $12,000 | $24,000 |
| Other | $0 | $0 | $0 |
| Total People | 1 | 1 | 2 |
| Total Payroll | $11,000 | $12,000 | $24,000 |
Financial Plan
Photography businesses usually require an enormous initial investment in equipment and facilities. The owner of Adorable Pet Photography has been an avid photographer for many years and possesses professional-level photographic equipment to get the business off to a good start with minimal debt. In addition, the will be a home-based business, with no rent or lease commitment. The charts and tables that follow demonstrate that these up-front investments allow Adorable Pet Photography to function with limited debt and overhead. This gives the business a quicker break-even point and increased profit margins from the start. As Adorable Pet Photography grows, a debt-free philosophy will be maintained.
7.1 Important Assumptions
Tax rates are included for informational purposes. We carry a small loan burden that will affect this rate minimally.
| General Assumptions | |||
| Year 1 | Year 2 | Year 3 | |
| Plan Month | 1 | 2 | 3 |
| Current Interest Rate | 8.00% | 8.00% | 8.00% |
| Long-term Interest Rate | 10.00% | 10.00% | 10.00% |
| Tax Rate | 30.00% | 30.00% | 30.00% |
| Other | 0 | 0 | 0 |
7.2 Key Financial Indicators
The following chart benchmarks four key indicators, including sales, gross margin, operating expenses, and inventory turnover. These were chosen due to their significant impact on the health of the business. These are not focused on gross amounts, but on year-to-year changes. The chart uses indicator values that are set to compare changes with the base year showing up as 1.00, and all successive years showing up as multiples from the base.

7.3 Projected Profit and Loss
Adorable Pet Photography expects a 15 percent annual growth rate for the first three years due to the owner’s already established reputation and contacts. Overhead is expected to be stable, with the exception of the receptionist/photographer’s assistant becoming a full-time position in fiscal year 2003. This allows a predicted 20 percent increase in profits before interest and taxes in the second year of business; this figure remains stable even with the increase in personnel expense the third year. It should be noted that the owner’s salary will be taken out of this figure.


| Pro Forma Profit and Loss | |||
| Year 1 | Year 2 | Year 3 | |
| Sales | $88,250 | $99,340 | $116,175 |
| Direct Cost of Sales | $27,105 | $31,777 | $36,087 |
| Other | $0 | $0 | $0 |
| Total Cost of Sales | $27,105 | $31,777 | $36,087 |
| Gross Margin | $61,145 | $67,563 | $80,088 |
| Gross Margin % | 69.29% | 68.01% | 68.94% |
| Expenses | |||
| Payroll | $11,000 | $12,000 | $24,000 |
| Sales and Marketing and Other Expenses | $9,900 | $7,500 | $7,600 |
| Depreciation | $0 | $0 | $0 |
| Leased Equipment | $0 | $0 | $0 |
| Utilities | $600 | $630 | $650 |
| Insurance | $1,800 | $1,800 | $1,800 |
| Rent | $0 | $0 | $0 |
| Payroll Taxes | $0 | $0 | $0 |
| Other | $0 | $0 | $0 |
| Total Operating Expenses | $23,300 | $21,930 | $34,050 |
| Profit Before Interest and Taxes | $37,845 | $45,633 | $46,038 |
| EBITDA | $37,845 | $45,633 | $46,038 |
| Interest Expense | $696 | $512 | $320 |
| Taxes Incurred | $11,145 | $13,536 | $13,715 |
| Net Profit | $26,004 | $31,584 | $32,002 |
| Net Profit/Sales | 29.47% | 31.79% | 27.55% |
7.4 Break-even Analysis
The break-even point will appear more rapidly for Adorable Pet Photography than for other types of home-based businesses since start-up costs are limited and there is little to no staff to pay in the beginning. January is expected to be the slowest month of the year, since this is the post-holiday slump.

| Break-even Analysis | |
| Monthly Units Break-even | 118 |
| Monthly Revenue Break-even | $2,802 |
| Assumptions: | |
| Average Per-Unit Revenue | $23.76 |
| Average Per-Unit Variable Cost | $7.30 |
| Estimated Monthly Fixed Cost | $1,942 |
7.5 Projected Cash Flow
Our cash situation is optimum. Although Adorable Pet Photography begins with little extra cash, our increased growth allows the business to gain financial ground quickly. The cash flow is negative for only two months of the first year, during the expected off-season months; the business will be prepared for this with cash reserves, and will maintain positive cash balances.

| Pro Forma Cash Flow | |||
| Year 1 | Year 2 | Year 3 | |
| Cash Received | |||
| Cash from Operations | |||
| Cash Sales | $88,250 | $99,340 | $116,175 |
| Subtotal Cash from Operations | $88,250 | $99,340 | $116,175 |
| Additional Cash Received | |||
| Sales Tax, VAT, HST/GST Received | $0 | $0 | $0 |
| New Current Borrowing | $0 | $0 | $0 |
| New Other Liabilities (interest-free) | $0 | $0 | $0 |
| New Long-term Liabilities | $0 | $0 | $0 |
| Sales of Other Current Assets | $0 | $0 | $0 |
| Sales of Long-term Assets | $0 | $0 | $0 |
| New Investment Received | $1,200 | $0 | $0 |
| Subtotal Cash Received | $89,450 | $99,340 | $116,175 |
| Expenditures | Year 1 | Year 2 | Year 3 |
| Expenditures from Operations | |||
| Cash Spending | $11,000 | $12,000 | $24,000 |
| Bill Payments | $48,798 | $54,280 | $60,108 |
| Subtotal Spent on Operations | $59,798 | $66,280 | $84,108 |
| Additional Cash Spent | |||
| Sales Tax, VAT, HST/GST Paid Out | $0 | $0 | $0 |
| Principal Repayment of Current Borrowing | $2,400 | $2,400 | $2,400 |
| Other Liabilities Principal Repayment | $0 | $0 | $0 |
| Long-term Liabilities Principal Repayment | $0 | $0 | $0 |
| Purchase Other Current Assets | $0 | $0 | $0 |
| Purchase Long-term Assets | $0 | $0 | $0 |
| Dividends | $0 | $0 | $0 |
| Subtotal Cash Spent | $62,198 | $68,680 | $86,508 |
| Net Cash Flow | $27,252 | $30,660 | $29,667 |
| Cash Balance | $40,752 | $71,412 | $101,079 |
7.6 Projected Balance Sheet
Adorable Pet Photography is set up for business. According to the numbers, there is steady accumulation of cash and assets. No major capital investments are expected throughout the early years, so the liabilities remain limited. Net worth steadily grows.
| Pro Forma Balance Sheet | |||
| Year 1 | Year 2 | Year 3 | |
| Assets | |||
| Current Assets | |||
| Cash | $40,752 | $71,412 | $101,079 |
| Inventory | $1,864 | $2,186 | $2,482 |
| Other Current Assets | $10,000 | $10,000 | $10,000 |
| Total Current Assets | $52,616 | $83,598 | $113,561 |
| Long-term Assets | |||
| Long-term Assets | $0 | $0 | $0 |
| Accumulated Depreciation | $0 | $0 | $0 |
| Total Long-term Assets | $0 | $0 | $0 |
| Total Assets | $52,616 | $83,598 | $113,561 |
| Liabilities and Capital | Year 1 | Year 2 | Year 3 |
| Current Liabilities | |||
| Accounts Payable | $2,812 | $4,609 | $4,970 |
| Current Borrowing | $7,600 | $5,200 | $2,800 |
| Other Current Liabilities | $0 | $0 | $0 |
| Subtotal Current Liabilities | $10,412 | $9,809 | $7,770 |
| Long-term Liabilities | $0 | $0 | $0 |
| Total Liabilities | $10,412 | $9,809 | $7,770 |
| Paid-in Capital | $23,550 | $23,550 | $23,550 |
| Retained Earnings | ($7,350) | $18,654 | $50,239 |
| Earnings | $26,004 | $31,584 | $32,002 |
| Total Capital | $42,204 | $73,789 | $105,791 |
| Total Liabilities and Capital | $52,616 | $83,598 | $113,561 |
| Net Worth | $42,204 | $73,789 | $105,791 |
7.7 Business Ratios
The following table includes Industry Profile statistics for the photographic studios/portraits industry, as determined by the Standard Industry Classifications (SIC) Index code 7221. These statistics show a comparison of industry standards and the key ratios for this plan.
| Ratio Analysis | ||||
| Year 1 | Year 2 | Year 3 | Industry Profile | |
| Sales Growth | 0.00% | 12.57% | 16.95% | 10.40% |
| Percent of Total Assets | ||||
| Inventory | 3.54% | 2.61% | 2.19% | 5.30% |
| Other Current Assets | 19.01% | 11.96% | 8.81% | 40.60% |
| Total Current Assets | 100.00% | 100.00% | 100.00% | 56.60% |
| Long-term Assets | 0.00% | 0.00% | 0.00% | 43.40% |
| Total Assets | 100.00% | 100.00% | 100.00% | 100.00% |
| Current Liabilities | 19.79% | 11.73% | 6.84% | 27.60% |
| Long-term Liabilities | 0.00% | 0.00% | 0.00% | 25.80% |
| Total Liabilities | 19.79% | 11.73% | 6.84% | 53.40% |
| Net Worth | 80.21% | 88.27% | 93.16% | 46.60% |
| Percent of Sales | ||||
| Sales | 100.00% | 100.00% | 100.00% | 100.00% |
| Gross Margin | 69.29% | 68.01% | 68.94% | 0.00% |
| Selling, General & Administrative Expenses | 39.42% | 35.46% | 40.72% | 77.70% |
| Advertising Expenses | 8.50% | 5.03% | 4.30% | 2.00% |
| Profit Before Interest and Taxes | 42.88% | 45.94% | 39.63% | 4.80% |
| Main Ratios | ||||
| Current | 5.05 | 8.52 | 14.62 | 1.83 |
| Quick | 4.87 | 8.30 | 14.30 | 1.26 |
| Total Debt to Total Assets | 19.79% | 11.73% | 6.84% | 53.40% |
| Pre-tax Return on Net Worth | 88.02% | 61.15% | 43.22% | 7.60% |
| Pre-tax Return on Assets | 70.60% | 53.97% | 40.26% | 16.20% |
| Additional Ratios | Year 1 | Year 2 | Year 3 | |
| Net Profit Margin | 29.47% | 31.79% | 27.55% | n.a |
| Return on Equity | 61.62% | 42.80% | 30.25% | n.a |
| Activity Ratios | ||||
| Inventory Turnover | 8.97 | 15.69 | 15.46 | n.a |
| Accounts Payable Turnover | 18.35 | 12.17 | 12.17 | n.a |
| Payment Days | 27 | 24 | 29 | n.a |
| Total Asset Turnover | 1.68 | 1.19 | 1.02 | n.a |
| Debt Ratios | ||||
| Debt to Net Worth | 0.25 | 0.13 | 0.07 | n.a |
| Current Liab. to Liab. | 1.00 | 1.00 | 1.00 | n.a |
| Liquidity Ratios | ||||
| Net Working Capital | $42,204 | $73,789 | $105,791 | n.a |
| Interest Coverage | 54.38 | 89.13 | 143.87 | n.a |
| Additional Ratios | ||||
| Assets to Sales | 0.60 | 0.84 | 0.98 | n.a |
| Current Debt/Total Assets | 20% | 12% | 7% | n.a |
| Acid Test | 4.87 | 8.30 | 14.30 | n.a |
| Sales/Net Worth | 2.09 | 1.35 | 1.10 | n.a |
| Dividend Payout | 0.00 | 0.00 | 0.00 | n.a |
References
Bunn, D. (1998, January 3). Pampering pets is big business. Rocky Mountain News , pp. 1B.
Hunter, G. (1999, March 14). More companies cash in as owners pamper pets. Detroit News, pp. D1.
Jan, T. (1999, July 3). Ah, yes, it’s a dog’s life — some posh alternatives to kennels beckon dog lovers who want the very best for their pets while they’re away. Seattle Times, pp. A1.
Littman, M. (1998, June 29). Wags to riches. Crains Chicago Business, pp. 11.
Palmer, J. (1998, August 3). Pampering pets becomes big business. Business Record – Des Moines IA, pp. 17.
Powell, B. (1998, April 6). Cashing in on critters owners help boost pet products industry. Fort Worth Star-Telegram, pp. 16.
Simpson, C. (1998 January 12). Copycat products – pet suppliers take cues from human trends. Chicago Sun-Times, pp. 4
Tuthill, W. (1999, August 9). Pet M.D. operates in very special niche. Capital District Business Review, pp. 39.
Veltkamp, R (1999, June 28). Alaska Canine Cookies tops with dogs, owners across the nation. Alaska Journal of Commerce, pp. 8.
Appendix
| Sales Forecast | |||||||||||||
| Month 1 | Month 2 | Month 3 | Month 4 | Month 5 | Month 6 | Month 7 | Month 8 | Month 9 | Month 10 | Month 11 | Month 12 | ||
| Unit Sales | |||||||||||||
| Studio Portrait Sessions | 0% | 10 | 20 | 30 | 40 | 15 | 30 | 50 | 60 | 80 | 80 | 80 | 80 |
| Holiday Location Promotions | 0% | 0 | 50 | 500 | 375 | 0 | 100 | 400 | 300 | 200 | 200 | 100 | 0 |
| Pet Show Locations | 0% | 0 | 50 | 0 | 0 | 75 | 50 | 100 | 125 | 150 | 75 | 75 | 150 |
| Home Portrait Sessions | 0% | 2 | 2 | 3 | 5 | 2 | 4 | 5 | 8 | 8 | 8 | 8 | 10 |
| Total Unit Sales | 12 | 122 | 533 | 420 | 92 | 184 | 555 | 493 | 438 | 363 | 263 | 240 | |
| Unit Prices | Month 1 | Month 2 | Month 3 | Month 4 | Month 5 | Month 6 | Month 7 | Month 8 | Month 9 | Month 10 | Month 11 | Month 12 | |
| Studio Portrait Sessions | $50.00 | $50.00 | $50.00 | $50.00 | $50.00 | $50.00 | $50.00 | $50.00 | $50.00 | $50.00 | $50.00 | $50.00 | |
| Holiday Location Promotions | $20.00 | $20.00 | $20.00 | $20.00 | $20.00 | $20.00 | $20.00 | $20.00 | $20.00 | $20.00 | $20.00 | $20.00 | |
| Pet Show Locations | $10.00 | $10.00 | $10.00 | $10.00 | $10.00 | $10.00 | $10.00 | $10.00 | $10.00 | $10.00 | $10.00 | $10.00 | |
| Home Portrait Sessions | $100.00 | $100.00 | $100.00 | $100.00 | $100.00 | $100.00 | $100.00 | $100.00 | $100.00 | $100.00 | $100.00 | $100.00 | |
| Sales | |||||||||||||
| Studio Portrait Sessions | $500 | $1,000 | $1,500 | $2,000 | $750 | $1,500 | $2,500 | $3,000 | $4,000 | $4,000 | $4,000 | $4,000 | |
| Holiday Location Promotions | $0 | $1,000 | $10,000 | $7,500 | $0 | $2,000 | $8,000 | $6,000 | $4,000 | $4,000 | $2,000 | $0 | |
| Pet Show Locations | $0 | $500 | $0 | $0 | $750 | $500 | $1,000 | $1,250 | $1,500 | $750 | $750 | $1,500 | |
| Home Portrait Sessions | $200 | $200 | $300 | $500 | $200 | $400 | $500 | $800 | $800 | $800 | $800 | $1,000 | |
| Total Sales | $700 | $2,700 | $11,800 | $10,000 | $1,700 | $4,400 | $12,000 | $11,050 | $10,300 | $9,550 | $7,550 | $6,500 | |
| Direct Unit Costs | Month 1 | Month 2 | Month 3 | Month 4 | Month 5 | Month 6 | Month 7 | Month 8 | Month 9 | Month 10 | Month 11 | Month 12 | |
| Studio Portrait Sessions | 0.00% | $12.00 | $12.00 | $12.00 | $12.00 | $12.00 | $12.00 | $12.00 | $12.00 | $12.00 | $12.00 | $12.00 | $12.00 |
| Holiday Location Promotions | 0.00% | $8.00 | $8.00 | $8.00 | $8.00 | $8.00 | $8.00 | $8.00 | $8.00 | $8.00 | $8.00 | $8.00 | $8.00 |
| Pet Show Locations | 0.00% | $1.30 | $1.30 | $1.30 | $1.30 | $1.30 | $1.30 | $1.30 | $1.30 | $1.30 | $1.30 | $1.30 | $1.30 |
| Home Portrait Sessions | 0.00% | $20.00 | $20.00 | $20.00 | $20.00 | $20.00 | $20.00 | $20.00 | $20.00 | $20.00 | $20.00 | $20.00 | $20.00 |
| Direct Cost of Sales | |||||||||||||
| Studio Portrait Sessions | $120 | $240 | $360 | $480 | $180 | $360 | $600 | $720 | $960 | $960 | $960 | $960 | |
| Holiday Location Promotions | $0 | $400 | $4,000 | $3,000 | $0 | $800 | $3,200 | $2,400 | $1,600 | $1,600 | $800 | $0 | |
| Pet Show Locations | $0 | $65 | $0 | $0 | $98 | $65 | $130 | $163 | $195 | $98 | $98 | $195 | |
| Home Portrait Sessions | $40 | $40 | $60 | $100 | $40 | $80 | $100 | $160 | $160 | $160 | $160 | $200 | |
| Subtotal Direct Cost of Sales | $160 | $745 | $4,420 | $3,580 | $318 | $1,305 | $4,030 | $3,443 | $2,915 | $2,818 | $2,018 | $1,355 | |
| Personnel Plan | |||||||||||||
| Month 1 | Month 2 | Month 3 | Month 4 | Month 5 | Month 6 | Month 7 | Month 8 | Month 9 | Month 10 | Month 11 | Month 12 | ||
| Payroll | 0% | $0 | $1,000 | $1,000 | $1,000 | $1,000 | $1,000 | $1,000 | $1,000 | $1,000 | $1,000 | $1,000 | $1,000 |
| Other | 0% | $0 | $0 | $0 | $0 | $0 | $0 | $0 | $0 | $0 | $0 | $0 | $0 |
| Total People | 0 | 1 | 1 | 1 | 1 | 1 | 1 | 1 | 1 | 1 | 1 | 1 | |
| Total Payroll | $0 | $1,000 | $1,000 | $1,000 | $1,000 | $1,000 | $1,000 | $1,000 | $1,000 | $1,000 | $1,000 | $1,000 | |
| General Assumptions | |||||||||||||
| Month 1 | Month 2 | Month 3 | Month 4 | Month 5 | Month 6 | Month 7 | Month 8 | Month 9 | Month 10 | Month 11 | Month 12 | ||
| Plan Month | 1 | 2 | 3 | 4 | 5 | 6 | 7 | 8 | 9 | 10 | 11 | 12 | |
| Current Interest Rate | 8.00% | 8.00% | 8.00% | 8.00% | 8.00% | 8.00% | 8.00% | 8.00% | 8.00% | 8.00% | 8.00% | 8.00% | |
| Long-term Interest Rate | 10.00% | 10.00% | 10.00% | 10.00% | 10.00% | 10.00% | 10.00% | 10.00% | 10.00% | 10.00% | 10.00% | 10.00% | |
| Tax Rate | Tax Rate | 30.00% | 30.00% | 30.00% | 30.00% | 30.00% | 30.00% | 30.00% | 30.00% | 30.00% | 30.00% | 30.00% | 30.00% |
| Other | 0 | 0 | 0 | 0 | 0 | 0 | 0 | 0 | 0 | 0 | 0 | 0 | |
| Pro Forma Profit and Loss | |||||||||||||
| Month 1 | Month 2 | Month 3 | Month 4 | Month 5 | Month 6 | Month 7 | Month 8 | Month 9 | Month 10 | Month 11 | Month 12 | ||
| Sales | $700 | $2,700 | $11,800 | $10,000 | $1,700 | $4,400 | $12,000 | $11,050 | $10,300 | $9,550 | $7,550 | $6,500 | |
| Direct Cost of Sales | $160 | $745 | $4,420 | $3,580 | $318 | $1,305 | $4,030 | $3,443 | $2,915 | $2,818 | $2,018 | $1,355 | |
| Other | $0 | $0 | $0 | $0 | $0 | $0 | $0 | $0 | $0 | $0 | $0 | $0 | |
| Total Cost of Sales | $160 | $745 | $4,420 | $3,580 | $318 | $1,305 | $4,030 | $3,443 | $2,915 | $2,818 | $2,018 | $1,355 | |
| Gross Margin | $540 | $1,955 | $7,380 | $6,420 | $1,383 | $3,095 | $7,970 | $7,608 | $7,385 | $6,733 | $5,533 | $5,145 | |
| Gross Margin % | 77.14% | 72.41% | 62.54% | 64.20% | 81.32% | 70.34% | 66.42% | 68.85% | 71.70% | 70.50% | 73.28% | 79.15% | |
| Expenses | |||||||||||||
| Payroll | $0 | $1,000 | $1,000 | $1,000 | $1,000 | $1,000 | $1,000 | $1,000 | $1,000 | $1,000 | $1,000 | $1,000 | |
| Sales and Marketing and Other Expenses | $1,200 | $1,200 | $1,200 | $700 | $700 | $700 | $700 | $700 | $700 | $700 | $700 | $700 | |
| Depreciation | $0 | $0 | $0 | $0 | $0 | $0 | $0 | $0 | $0 | $0 | $0 | $0 | |
| Leased Equipment | $0 | $0 | $0 | $0 | $0 | $0 | $0 | $0 | $0 | $0 | $0 | $0 | |
| Utilities | $50 | $50 | $50 | $50 | $50 | $50 | $50 | $50 | $50 | $50 | $50 | $50 | |
| Insurance | $150 | $150 | $150 | $150 | $150 | $150 | $150 | $150 | $150 | $150 | $150 | $150 | |
| Rent | $0 | $0 | $0 | $0 | $0 | $0 | $0 | $0 | $0 | $0 | $0 | $0 | |
| Payroll Taxes | 15% | $0 | $0 | $0 | $0 | $0 | $0 | $0 | $0 | $0 | $0 | $0 | $0 |
| Other | $0 | $0 | $0 | $0 | $0 | $0 | $0 | $0 | $0 | $0 | $0 | $0 | |
| Total Operating Expenses | $1,400 | $2,400 | $2,400 | $1,900 | $1,900 | $1,900 | $1,900 | $1,900 | $1,900 | $1,900 | $1,900 | $1,900 | |
| Profit Before Interest and Taxes | ($860) | ($445) | $4,980 | $4,520 | ($518) | $1,195 | $6,070 | $5,708 | $5,485 | $4,833 | $3,633 | $3,245 | |
| EBITDA | ($860) | ($445) | $4,980 | $4,520 | ($518) | $1,195 | $6,070 | $5,708 | $5,485 | $4,833 | $3,633 | $3,245 | |
| Interest Expense | $65 | $64 | $63 | $61 | $60 | $59 | $57 | $56 | $55 | $53 | $52 | $51 | |
| Taxes Incurred | ($278) | ($153) | $1,475 | $1,338 | ($173) | $341 | $1,804 | $1,695 | $1,629 | $1,434 | $1,074 | $958 | |
| Net Profit | ($648) | ($356) | $3,442 | $3,121 | ($404) | $795 | $4,209 | $3,956 | $3,801 | $3,345 | $2,506 | $2,236 | |
| Net Profit/Sales | -92.53% | -13.20% | 29.17% | 31.21% | -23.78% | 18.08% | 35.07% | 35.80% | 36.91% | 35.03% | 33.20% | 34.40% | |
| Pro Forma Cash Flow | |||||||||||||
| Month 1 | Month 2 | Month 3 | Month 4 | Month 5 | Month 6 | Month 7 | Month 8 | Month 9 | Month 10 | Month 11 | Month 12 | ||
| Cash Received | |||||||||||||
| Cash from Operations | |||||||||||||
| Cash Sales | $700 | $2,700 | $11,800 | $10,000 | $1,700 | $4,400 | $12,000 | $11,050 | $10,300 | $9,550 | $7,550 | $6,500 | |
| Subtotal Cash from Operations | $700 | $2,700 | $11,800 | $10,000 | $1,700 | $4,400 | $12,000 | $11,050 | $10,300 | $9,550 | $7,550 | $6,500 | |
| Additional Cash Received | |||||||||||||
| Sales Tax, VAT, HST/GST Received | 0.00% | $0 | $0 | $0 | $0 | $0 | $0 | $0 | $0 | $0 | $0 | $0 | $0 |
| New Current Borrowing | $0 | $0 | $0 | $0 | $0 | $0 | $0 | $0 | $0 | $0 | $0 | $0 | |
| New Other Liabilities (interest-free) | $0 | $0 | $0 | $0 | $0 | $0 | $0 | $0 | $0 | $0 | $0 | $0 | |
| New Long-term Liabilities | $0 | $0 | $0 | $0 | $0 | $0 | $0 | $0 | $0 | $0 | $0 | $0 | |
| Sales of Other Current Assets | $0 | $0 | $0 | $0 | $0 | $0 | $0 | $0 | $0 | $0 | $0 | $0 | |
| Sales of Long-term Assets | $0 | $0 | $0 | $0 | $0 | $0 | $0 | $0 | $0 | $0 | $0 | $0 | |
| New Investment Received | $0 | $0 | $0 | $0 | $0 | $0 | $200 | $200 | $200 | $200 | $200 | $200 | |
| Subtotal Cash Received | $700 | $2,700 | $11,800 | $10,000 | $1,700 | $4,400 | $12,200 | $11,250 | $10,500 | $9,750 | $7,750 | $6,700 | |
| Expenditures | Month 1 | Month 2 | Month 3 | Month 4 | Month 5 | Month 6 | Month 7 | Month 8 | Month 9 | Month 10 | Month 11 | Month 12 | |
| Expenditures from Operations | |||||||||||||
| Cash Spending | $0 | $1,000 | $1,000 | $1,000 | $1,000 | $1,000 | $1,000 | $1,000 | $1,000 | $1,000 | $1,000 | $1,000 | |
| Bill Payments | $40 | $1,225 | $2,588 | $10,436 | $4,816 | $804 | $1,553 | $8,793 | $5,430 | $4,924 | $5,033 | $3,155 | |
| Subtotal Spent on Operations | $40 | $2,225 | $3,588 | $11,436 | $5,816 | $1,804 | $2,553 | $9,793 | $6,430 | $5,924 | $6,033 | $4,155 | |
| Additional Cash Spent | |||||||||||||
| Sales Tax, VAT, HST/GST Paid Out | $0 | $0 | $0 | $0 | $0 | $0 | $0 | $0 | $0 | $0 | $0 | $0 | |
| Principal Repayment of Current Borrowing | $200 | $200 | $200 | $200 | $200 | $200 | $200 | $200 | $200 | $200 | $200 | $200 | |
| Other Liabilities Principal Repayment | $0 | $0 | $0 | $0 | $0 | $0 | $0 | $0 | $0 | $0 | $0 | $0 | |
| Long-term Liabilities Principal Repayment | $0 | $0 | $0 | $0 | $0 | $0 | $0 | $0 | $0 | $0 | $0 | $0 | |
| Purchase Other Current Assets | $0 | $0 | $0 | $0 | $0 | $0 | $0 | $0 | $0 | $0 | $0 | $0 | |
| Purchase Long-term Assets | $0 | $0 | $0 | $0 | $0 | $0 | $0 | $0 | $0 | $0 | $0 | $0 | |
| Dividends | $0 | $0 | $0 | $0 | $0 | $0 | $0 | $0 | $0 | $0 | $0 | $0 | |
| Subtotal Cash Spent | $240 | $2,425 | $3,788 | $11,636 | $6,016 | $2,004 | $2,753 | $9,993 | $6,630 | $6,124 | $6,233 | $4,355 | |
| Net Cash Flow | $460 | $275 | $8,012 | ($1,636) | ($4,316) | $2,396 | $9,447 | $1,257 | $3,870 | $3,626 | $1,517 | $2,345 | |
| Cash Balance | $13,960 | $14,235 | $22,247 | $20,611 | $16,295 | $18,691 | $28,138 | $29,395 | $33,265 | $36,890 | $38,407 | $40,752 | |
| Pro Forma Balance Sheet | |||||||||||||
| Month 1 | Month 2 | Month 3 | Month 4 | Month 5 | Month 6 | Month 7 | Month 8 | Month 9 | Month 10 | Month 11 | Month 12 | ||
| Assets | Starting Balances | ||||||||||||
| Current Assets | |||||||||||||
| Cash | $13,500 | $13,960 | $14,235 | $22,247 | $20,611 | $16,295 | $18,691 | $28,138 | $29,395 | $33,265 | $36,890 | $38,407 | $40,752 |
| Inventory | $1,500 | $1,340 | $1,595 | $4,862 | $3,938 | $3,621 | $2,316 | $4,433 | $3,787 | $3,207 | $3,099 | $2,219 | $1,864 |
| Other Current Assets | $10,000 | $10,000 | $10,000 | $10,000 | $10,000 | $10,000 | $10,000 | $10,000 | $10,000 | $10,000 | $10,000 | $10,000 | $10,000 |
| Total Current Assets | $25,000 | $25,300 | $25,830 | $37,109 | $34,549 | $29,915 | $31,007 | $42,571 | $43,181 | $46,471 | $49,989 | $50,626 | $52,616 |
| Long-term Assets | |||||||||||||
| Long-term Assets | $0 | $0 | $0 | $0 | $0 | $0 | $0 | $0 | $0 | $0 | $0 | $0 | $0 |
| Accumulated Depreciation | $0 | $0 | $0 | $0 | $0 | $0 | $0 | $0 | $0 | $0 | $0 | $0 | $0 |
| Total Long-term Assets | $0 | $0 | $0 | $0 | $0 | $0 | $0 | $0 | $0 | $0 | $0 | $0 | $0 |
| Total Assets | $25,000 | $25,300 | $25,830 | $37,109 | $34,549 | $29,915 | $31,007 | $42,571 | $43,181 | $46,471 | $49,989 | $50,626 | $52,616 |
| Liabilities and Capital | Month 1 | Month 2 | Month 3 | Month 4 | Month 5 | Month 6 | Month 7 | Month 8 | Month 9 | Month 10 | Month 11 | Month 12 | |
| Current Liabilities | |||||||||||||
| Accounts Payable | $0 | $1,148 | $2,234 | $10,271 | $4,790 | $761 | $1,256 | $8,612 | $5,266 | $4,755 | $4,927 | $3,058 | $2,812 |
| Current Borrowing | $10,000 | $9,800 | $9,600 | $9,400 | $9,200 | $9,000 | $8,800 | $8,600 | $8,400 | $8,200 | $8,000 | $7,800 | $7,600 |
| Other Current Liabilities | $0 | $0 | $0 | $0 | $0 | $0 | $0 | $0 | $0 | $0 | $0 | $0 | $0 |
| Subtotal Current Liabilities | $10,000 | $10,948 | $11,834 | $19,671 | $13,990 | $9,761 | $10,056 | $17,212 | $13,666 | $12,955 | $12,927 | $10,858 | $10,412 |
| Long-term Liabilities | $0 | $0 | $0 | $0 | $0 | $0 | $0 | $0 | $0 | $0 | $0 | $0 | $0 |
| Total Liabilities | $10,000 | $10,948 | $11,834 | $19,671 | $13,990 | $9,761 | $10,056 | $17,212 | $13,666 | $12,955 | $12,927 | $10,858 | $10,412 |
| Paid-in Capital | $22,350 | $22,350 | $22,350 | $22,350 | $22,350 | $22,350 | $22,350 | $22,550 | $22,750 | $22,950 | $23,150 | $23,350 | $23,550 |
| Retained Earnings | ($7,350) | ($7,350) | ($7,350) | ($7,350) | ($7,350) | ($7,350) | ($7,350) | ($7,350) | ($7,350) | ($7,350) | ($7,350) | ($7,350) | ($7,350) |
| Earnings | $0 | ($648) | ($1,004) | $2,438 | $5,559 | $5,155 | $5,950 | $10,159 | $14,115 | $17,917 | $21,262 | $23,768 | $26,004 |
| Total Capital | $15,000 | $14,352 | $13,996 | $17,438 | $20,559 | $20,155 | $20,950 | $25,359 | $29,515 | $33,517 | $37,062 | $39,768 | $42,204 |
| Total Liabilities and Capital | $25,000 | $25,300 | $25,830 | $37,109 | $34,549 | $29,915 | $31,007 | $42,571 | $43,181 | $46,471 | $49,989 | $50,626 | $52,616 |
| Net Worth | $15,000 | $14,352 | $13,996 | $17,438 | $20,559 | $20,155 | $20,950 | $25,359 | $29,515 | $33,517 | $37,062 | $39,768 | $42,204 |


