
OutReSources
Executive Summary
OutReSources, Inc. will be a consulting company specializing in the design and delivery of training products and services in statewide and regional markets. The company offers health care providers a reliable, high-quality alternative to in-house resources for business development, market development, training, and quality assurance.
OutReSources will initially be created as a Greenstate DBA company under the umbrella of Flowstone, Inc., based in the Central County area of Greenstate, the heart of Greenstate’s population and growth.
Within the state, OutReSources plans to target health care service providers, tailoring our services to their needs. One of OutReSources’ challenges will be establishing itself as a real consulting and training company, positioned as a relatively risk-free purchase.
Industry competition comes in several forms, the most significant being companies and agencies that choose to do business development and training in-house rather than outsourcing. There are also State and independent organizations providing training and development resources. Many of these companies are generalist in nature and do not focus on a niche market. Furthermore, they are often hampered by a flawed organizational structure that does not provide the most experienced people for the client’s projects. OutReSources’ advantage over such companies is that it provides high-level consulting to help integrate practice with theory and in concert with the client companies’ goals.
OutReSources will be priced at the upper edge of what the market will bear. The pricing will fit with the general positioning of OutReSources as providing high-level expertise. Sales are estimated to be substantial and an excellent cash balance in the first year.
The company’s founders are former and current health care service providers, all in the “fee-for-service” provider markets we will target. They are founding OutReSources to formalize the consulting services they already offer. OutReSources will be managed by working partners, in a structure taken mainly from Flowstone, Inc. In the beginning we assume three partners, Khallie Locharnold and Soren Aboukir (from Flowstone Inc.) and Yuriatin Guadalquivir.
The firm estimates healthy profits by the first year with a commensurate net profit margin. The company does not anticipate any cash flow problems arising.
1.1 Objectives
OutReSources has set several objectives for the first year.
- Develop and implement a training service that targets both for-profit and non-profit health care providers that provide fee-for-services and which are required to meet standards set by state and federal regulations, and/or private associations.
- Raise the standards for quality of care while breaking free of the confines of the “fee-for-service that is Medicaid” by developing a service to support those health care providers who still operate within those confines.
- Develop a company with low overhead and liability to optimize net profit margins.
1.2 Mission
Our mission is to raise the standards of health care services by improving the skills, abilities, and efficiencies of those who provide such services. We wish to educate and train those who provide health care services and are reimbursed and regulated by the state governing agencies. We aim to be transitional educators and trainers to those with the education but without the experience.
1.3 Keys to Success
Quality and Credibility
Employing trainers within the appropriate disciplines who have
- Credentials: Education, Licenses, Certifications
- Proven successful track record
- Continuing Education Units
Strong Formal Methodology
Developing strong formalized training methodologies for all services
- Policy and Procedures
- Hierarchy roles in the Organizational Structure: Qualifications and Duties
- Confidentiality control
- Feedback Reporting: Finished Product
Promotion and Marketing
- Starting with what we know: Our first offerings are based on our expertise
- Reaching a large targeted population: Expanding our offerings
- Spring boarding off current credentials
Operations and Liability
Maintaining low overhead and liability by:
- Maximizing abilities and simplifying roles
- Assessing the market and initiating with “High End” targets (large providers, high fee-for-service rate services)
- Strong investments in quality equipment vs cost by including
- Mobility vs Center or combinations
- Space and supplies
- Finished products (manuals, pamphlets, protocols)
Company Summary
OutReSources, Inc. is a new company providing high-level expertise consulting to health care providers, including business development, training development, quality assurance strategies, and marketing of additional training services. It will focus initially on:
- Providing “How-to’s of Best Practice” with development and training for Developmental Disability, Service Coordination, and a multitude of Mental Health Service providers.
- Audit Preparation reviews to enable companies and agencies to avoid costly recoupment or pay backs, and avoid damaging citations.
As OutReSources grows it will take on people and consulting work in related markets becoming more diversified, such as supportive training services like First Aid/CPR, Cultural Diversity, Health and Wellness in the workplace, Research Resource Center, Mobility, Business Practices in the Business System, and so on. It will also look for additional leverage by developing partnerships with key advocacy organizations and state officials.
2.1 Company Ownership
OutReSources, Inc. is projected as a Limited Partnership in conjunction with Flowstone, Inc., but may switch the preferred structure to a “C” Corporation or Limited Liability Corporation, for purposes of investment structuring.
OPERATING PARTNERS (initial)
- General Managing Partners, with 62% ownership by Flowstone, Inc.
- Vice Managing Partner for Programmatic Development and Operations, with 28% ownership.
INVESTMENT PARTNERS
- Flowstone, Inc. with 95% ownership from start-up date.
- Limited Partner Yuriatin Guadalquivir, with 5% ownership from start date.
Structure of Partnership
Flowstone, Inc. will provide the initial starting capital investment necessary to begin OutReSources, Inc., making them the primary stock holder. Yuriatin Guadalquivir will begin as the General Operating Manager responsible for development and implementation, receiving compensation through salary and stock acquisition. First year salary of $41,000 will be paid by Flowstone, Inc. An appropriate profit percentage may be paid at each year end. If a loss is realized at the end of any year then Yuriatin Guadalquivir receives no payout of stock in the company.
- Following first calander year, Flowstone, Inc. will reimburse Yuriatin Guadalquivir for service by turning 5% of stock ownership of OutReSources, Inc. over to him.
- Each additional year Flowstone will increase Yuriatin Guadalquivir’s stock ownership by 5% to a maximum of 33% ownership in OutReSources, Inc.
- Once equal partnership between Flowstone, Inc. and Yuriatin Guadalquivir has been reached then Guadalquivir becomes a full partner, assuming equal voting rights, and liability.
- Liability will include equal share in all legal and financial obligations.
2.2 Start-up Summary
Total start-up expenses includae legal costs, logo design, stationery and related expenses.
Expensed presentation and office equipment include computers and projectors. Start-up assets include initial cash to handle the first few months of consulting operations as accounts receivable play through the cash flow. Initial production and reproduction of training documents, and beginning office supplies will be required. Legal Fees are anticipated for attorney and processing fees to develop OutReSources as a DBA under Flowstone Inc., and for the development and finalizing of partnership with Yuriatin Guadalquivir. Flowstone, Inc. is providing some of their used office furniture, chairs, as Other Current Assets.


| Start-up | |
| Requirements | |
| Start-up Expenses | |
| Legal (Formalization of Partnership) | $2,000 |
| Presentation Equipment | $3,500 |
| Office Computers, Printers, and Equipment | $4,000 |
| Promotion and Marketing | $1,000 |
| Operational Supplies (Develop & Produce Training Documents) | $1,000 |
| Lodging and Meals | $3,000 |
| Total Start-up Expenses | $14,500 |
| Start-up Assets | |
| Cash Required | $24,500 |
| Other Current Assets | $1,000 |
| Long-term Assets | $0 |
| Total Assets | $25,500 |
| Total Requirements | $40,000 |
Services
OutReSources, Inc. will begin by providing multiple training services for health care providers and public agencies in the areas of Developmental Therapy, and Service Coordination, but will later progress and diversify into Psychosocial Rehabilitation, Case Management, Clinical Therapies, and a multitude of supportive and more specific concepts. These concepts may range from Health Care Business Practices, Health and Wellness Promotion, Specific Disabilities and Treatments.
The initial service training categories for Developmental Therapy and Service Coordination are:
- Standard DS training (DS for Children and Adults) and state certification
- Paraprofessional Supervision by a Developmental Disabilities Professional
- Quality Assurance practices and implementation of the “Best Practice/Client 1st” concept
- Audit simulation in conjunction with training and assistance.
- First Aid/CPR Certifications
- Business analysis and restructuring consultations
- Specific acute “Hot Topic” analysis (treatment/therapy methods, disorders, customer service, adult transition to include Medicaid/SSI, guardianship, community resource)
Market Analysis Summary
OutReSources, Inc. is a business that has become necessary because of today’s ever increasing demand on the need for community health care. There are an increasing number of providers who have become dependent on Medicaid reimbursement, which has created the need for training resources. There are 100s of agencies providing fee-for-services reimbursed by Medicaid. Combine this with regional Medicaid units being severely understaffed and underbudgeted and you have a declining system unable to meet the huge need for support. OutReSources is therefore, ideally positioned to deliver these support and training services to provider companies and agencies.
4.1 Market Segmentation
The are many Medicaid providers. There are 79 listed in the Centerville Yellow Pages under the Mental Health and Developmental Disability categories, most of which provide a variety of service treatments or therapies. Several are either incorporated or franchised across the state. All of them provide at least one Medicaid reimbursed service (most offer several) and are required to maintain certain standards, self regulate, and educate. This creates the prime market for our services:
- Pre-Audit preparation which would be on a sliding scale from finding, fixing, and training.
- Certification Training (Specialist Certifications, CPR/First Aid, etc…)
- Supportive training options (Diversity, Language, Parenting, “Best Practice”, Business and HR in Health Care, etc…)
The segmentation of the market is a new concept within the Mental Health and Developmental Disabilities fields of service but is not new to the general health care industry, and other service fields leaving a strong need for specific services:
- Developmental Disabilities: Largest population in target with even larger body of regulations.
- Service Coordination: Little regulation but severe lack of quality service.
- Psychology/Social Rehabilitation: Smaller population but strong need for improvements in both quality and quantity.
It makes logical sense for OutReSources, Inc. to primarily direct its marketing approach at these three segments. In 2000, the market potential for the disabled service population is estimated to be around 200,498 people reporting some disability in Greenstate (Census 2000). Nationally the number was nearly 50 million. At the same time, the market potential for the need of bilingual services was estimated to be around 127,609 people speaking another language other than English at home of which 85% speak Spanish. Each of these populations are expected to grow at a steady rate of 5.6% per year.
In the table and chart below:
- Agency Group 1 = State Licensed Developmental Disabilities Agencies
- Agency Group 2 = State Licensed Service Coordination Agencies
- Agency Group 3 = Other Medicaid Providers in Need of Cross Training and Continuing Education Units

| Market Analysis | |||||||
| Year 1 | Year 2 | Year 3 | Year 4 | Year 5 | |||
| Potential Customers | Growth | CAGR | |||||
| Agency Group 1 | 25% | 60 | 75 | 94 | 118 | 148 | 25.32% |
| Agency Group 2 | 25% | 40 | 50 | 63 | 79 | 99 | 25.43% |
| Agency Group 3 | 5% | 100 | 105 | 110 | 116 | 122 | 5.10% |
| Total | 16.55% | 200 | 230 | 267 | 313 | 369 | 16.55% |
4.2 Target Market Segment Strategy
OutReSources, Inc. chooses to make the above segments its targeted market is because we have the applied first hand experience and the credentials having provided these services for significant periods of time, earning credibility with substantial marks in quality. Through our experiences as providers we have developed a strong knowledge of what services would be greatly needed, appreciated and valued.
We have and are continually increasing our credentials as providers to improve our current services allowing us to utilize those gained credentials in support of our new offerings. Through the years we have developed a reputation of providing high-quality services among state regulators, providers, and the community.
4.3 Service Business Analysis
Consulting participants range from major international name-brand consultants to tens of thousands of individuals. One of OutReSources’ challenges will be establishing itself as a real consulting company, positioned as a relatively risk-free organizational purchase.
There really is not much local competition specific to the field of Mental Health and Developmental Disabilities, only small private entities that are usually sole proprietors consulting from the basis of that one individual’s own knowledge and/or theories, and their own interpretations but with varying levels of practical application experience.
Our program will minimize its starting cost and have almost no overall risk by developing our new offerings based on the services services Flowstone, Inc. currently provides. This allows us to minimize up front cost and overhead while improving services within OutReSources. Flowstone will provide the inial start-up expenses in return for partial ownership, profit, and free access to services rendered.
4.3.1 Competition and Buying Patterns
The key element in purchase decisions made at the OutReSources’ client level is trust in the professional reputation and reliability of the consulting firm.
Strategy and Implementation Summary
OutReSources, Inc. will primarily focus on three service markets, Developmental Disability, Service Coordination, and Mental Health Providers, and in limited product segments: Pre-audit Review, Training, and Certifications.
5.1 Competitive Edge
Clearly, our competitive edge is the customer service experience and approach that our management team will bring to the table. Our “Best Practice” and “Client First” approach to all of our services is evident, and highly appreciated.
5.2 Marketing Strategy
An overview of the marketing plan includes:
- Networking via word of mouth
- Joining Associations of potential clients
- Evolve Flowstone’s services to optimized levels to maximize profit and quality
- Community involvement through volunteering, providing free seminars or scholarships to families in need to attend seminars
- Symposium and Conferences
- Website
- Calling on connections within key state departments, agencies, and other affiliates
- High profile interaction between our managers, and the customers
- Excellent service and high quality results
5.3 Sales Strategy
The marketing strategy discussed previously in this business plan will generate the desired sales. These sales will begin with a phone call to known health care providers across the state. It is a stated objective to assist or transfer the administrative burden of quality assurance, training and certification away from the owner, freeing up their time to meet with clients, to network at functions, and to market the list of prospective clients. This means that our team will be running and directing internal audits and staff trainings. This team must be carefully trained to recognize and address deficiencies in service quality.
The Team Supervisor needs and expects close contact and cooperation with the client agency’s staff. The General Operational Manger is under pressure to get a quotation together. The GOM and Trainers must be armed with quick reference guide to pricing. The important caller should be told that the GOM will “call right back.” The more successful the marketing strategy is in making in-roads into the foundation of a market, the more important this communication response will become.
In respect to the prospect list of clients, it is essential that a “salesman’s” approach be adopted to insure an organized, orderly approach to each prospect. Notes need to be kept on each client. Follow-up and persistence will pay off.
5.3.1 Sales Forecast
OutReSources, Inc. is a start-up and a relatively new concept in the field within a fairly common concept of consultation and training services. It is difficult to forecast without any benchmarks. However, since our overhead and start-up cost will be minimal we are able to use basic forecast principles by estimating our primary cost of salary (what it cost us to provide the service) which includes staffs estimated operating costs of lodging, meals and travel expenses to forecast our cost.
We want a 50% profit margin (to allow room for adjustments as needed) and so will double operating expenses to project revenue. This results in a Net profit of 50% on the dollar or 2-1 on our money. Of course, as services are implemented adjustments will be made based on total sales, realized cost, accessibility, feasibility, etc.


| Sales Forecast | |||
| Year 1 | Year 2 | Year 3 | |
| Sales | |||
| Pre-audit Review | $195,000 | $253,500 | $329,550 |
| Pre-audit Review with Training | $265,500 | $345,150 | $448,695 |
| Specialized Trainings | $7,800 | $11,700 | $17,550 |
| Certification Courses | $11,700 | $17,550 | $26,325 |
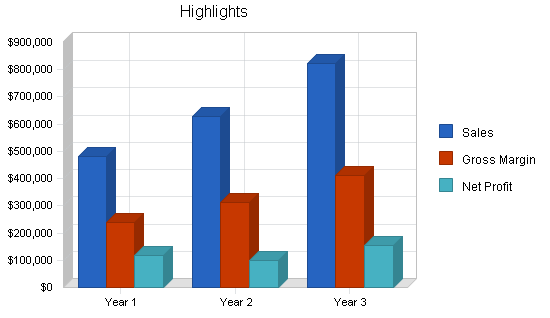
| Total Sales | $480,000 | $627,900 | $822,120 |
| Direct Cost of Sales | Year 1 | Year 2 | Year 3 |
| Pre-audit Review | $97,500 | $126,750 | $164,775 |
| Pre-audit Review with Training | $132,750 | $172,575 | $224,348 |
| Specialized Trainings | $1,950 | $2,925 | $4,388 |
| Certification Courses | $1,942 | $2,913 | $4,370 |
| Subtotal Direct Cost of Sales | $234,142 | $305,163 | $397,880 |
5.4 Milestones
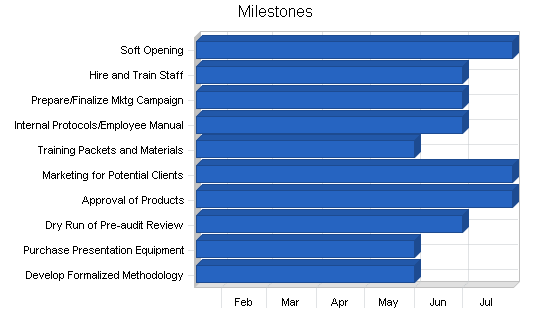
Set forth below are the main milestones in the schedule of proposed development. We have carefully reviewed the timelines for start-up and firmly believe that once we are completely funded we can construct and open our initial services within less than one month of external implementation.
- Development of Formalized Methodology of all services provided by May 2005 (GOM)
- Purchase of High-end Presentation equipment by May 2005 (FLowstone, Inc.)
- Preliminary dry run of internal mock services by June 2005 (General Operations Manager)
- Approval of final product by July 2005 (Flowstone, Inc. GOM and Training Supervisors)
- Marketing for potential clients By July 2005 (Flowstone, Inc. and GOM)
- Training Packets, manuals, and documents by May 2005 (GOM, Training Supervisors)
- Develop internal operation protocols and employee manual By June 2005 (Flowstone, Inc. and GOM)
- Prepare and finalize marketing campaign (pamphlets, advertisements, etc) by June 2005 (Flowstone, Inc. and GOM)
- Train staff by June 2005 (GOM and Training Supervisors)
- Soft open (training period 30 to 45 days) by July 2005 (GOM and Training Supervisors)
| Milestones | |||||
| Milestone | Start Date | End Date | Budget | Manager | Department |
| Develop Formalized Methodology | 1/15/2005 | 5/31/2005 | $0 | GOM | Department |
| Purchase Presentation Equipment | 1/15/2005 | 5/31/2005 | $0 | Flowstone | Department |
| Dry Run of Pre-audit Review | 1/15/2005 | 6/30/2005 | $0 | GOM | Department |
| Approval of Products | 1/15/2005 | 7/31/2005 | $0 | Flowstone, GOM, T-S | Department |
| Marketing for Potential Clients | 1/15/2005 | 7/31/2005 | $0 | Flowstone, GOM | Department |
| Training Packets and Materials | 1/15/2005 | 5/31/2005 | $0 | GOM, T-S | Department |
| Internal Protocols/Employee Manual | 1/15/2005 | 6/30/2005 | $0 | Flowstone, GOM | Department |
| Prepare/Finalize Mktg Campaign | 1/15/2005 | 6/30/2005 | $0 | Flowstone, GOM | Department |
| Hire and Train Staff | 1/15/2005 | 6/30/2005 | $0 | GOM, T-S | Department |
| Soft Opening | 1/15/2005 | 7/31/2005 | $0 | GOM, T-S | Department |
| Totals | $0 | ||||
Management Summary
The three managers, Flowstone, Inc. owners Khallie Locharnold and Soren Aboukir and General Operations Manager Yuriatin Guadalquivir, have impeccable credentials in this industry. This will benefit OutReSources, Inc. in three ways:
- Clients will be brought from existing professional relationships
- Respect and recognition by associated organizations and state departments
- The experience each has will attract new clients in the area of finance and administration,
The Training Supervisors and Trainers have yet to be formalized but would primarily consist of the Program Managers and Professionals from within Flowstone. Their extensive experience and education in service, and management within the industry will provide a foundation for success for OutReSources, Inc.
6.1 Personnel Plan
All work is, at the moment, produced by Yuriatin Guadalquivir and Flowstone, Inc. Since OutReSources, Inc. still remains in its formative stage and all stock holders’ compensation is purely based on net profit, and currently there is no revenue being generated, there are no salary expenses. There will be added where and when necessary and in line with success in penetrating the plan’s targeted markets. These salary expenses will absorbed by Flowstone, Inc.
By the end of June 2005, it is assumed that increased business volume will require the first Training Supervisor to be brought on board. By the end of August 2005, increased volume will require hiring the first trainer.
In FY2007, OutReSources will have 4 Training Supervisors and 4 trainers working, with the increasing amount of less sensitive work being farmed out to paraprofessionals and administrative support staff of Flowstone. It is assumed that OutReSources will become completely independent of Flowstone’s financial and staff support in year FY2008 or FY2009, depending on demand volume.
As stated earlier the salaries of the owner/consultants, training supervisors and trainers is included in the Cost of Sales. Only those costs for the hourly paraprofessional and administrative staff are shown in the Personnel table below.
| Personnel Plan | |||
| Year 1 | Year 2 | Year 3 | |
| Owners/Consultants | $0 | $0 | $0 |
| Operations Manager | $0 | $41,000 | $41,000 |
| Training Supervisors | $0 | $0 | $0 |
| Trainers | $0 | $0 | $0 |
| Paraprofessionals | $16,000 | $32,000 | $32,000 |
| Administrative Support | $10,000 | $24,000 | $24,000 |
| Total People | 0 | 0 | 0 |
| Total Payroll | $26,000 | $97,000 | $97,000 |
Financial Plan
Our main concerns will be aggressive time management, so that our labor costs stay under control, and proper purchasing, keeping costs down. Secondarily, hiring the best team, training them properly and retaining them will be a critical component to good costs. A good trainer does not sacrifice quality for quantity, but rather they optimize their time spent. Growth will be sustained through a contribution to a “roll-over” plan, and from potential future clients.
7.1 Start-up Funding
Total start-up expenses include legal costs, logo design, stationery and related expenses.
Expensed presentation and office equipment include computers and projectors. Start-up assets include initial cash to handle the first few months of consulting operations as accounts receivable play through the cash flow. Flowstone, Inc. is providing some of their used office furniture, chairs, as Other Current Assets.
Flowstone, Inc. will provide seed capital. Soren Aboukir and Khallie Locharnold will each invest at start-up, and anticipate loaning the company additional funds during the year.
| Start-up Funding | |
| Start-up Expenses to Fund | $14,500 |
| Start-up Assets to Fund | $25,500 |
| Total Funding Required | $40,000 |
| Assets | |
| Non-cash Assets from Start-up | $1,000 |
| Cash Requirements from Start-up | $24,500 |
| Additional Cash Raised | $0 |
| Cash Balance on Starting Date | $24,500 |
| Total Assets | $25,500 |
| Liabilities and Capital | |
| Liabilities | |
| Current Borrowing | $0 |
| Long-term Liabilities | $0 |
| Accounts Payable (Outstanding Bills) | $0 |
| Other Current Liabilities (interest-free) | $0 |
| Total Liabilities | $0 |
| Capital | |
| Planned Investment | |
| Flowstone, Inc. | $20,000 |
| Khallie Locharnold | $10,000 |
| Soren Aboukir | $10,000 |
| Additional Investment Requirement | $0 |
| Total Planned Investment | $40,000 |
| Loss at Start-up (Start-up Expenses) | ($14,500) |
| Total Capital | $25,500 |
| Total Capital and Liabilities | $25,500 |
| Total Funding | $40,000 |
7.2 Important Assumptions
- We are assuming steady growth from good management, barring any unforseen local, or state disasters, economic slowdown, or Medicaid budget cuts.
- We are assuming adequate funding by Flowstone, Inc. and the partners to sustain us during start-up.
- We are assuming that health care providers will respond to the new concept of outsourced training and value it enough to pay for it.
- We are assuming that the state will support us by referring health care provider clients.
- We are assuming that we will be able to market our offerings as high-end services, allowing us to have a large profit potential.
- We are assuming that this endeavor will not negatively affect those services already provided by Flowstone, Inc.
7.3 Projected Profit and Loss
Outlines in our Profit and Loss table are purely simplistic guesses on an ideal scenario with the assumption that clients will pay what has been estimated, operating /overhead expenses are minimal, and staff are satisfied with their compensation. Development will take place within the agency of Flowstone, Inc. to minimize overhead expenses since Flowstone would be able to simply absorb the start up expenses as a cost to improve their current services.
Initially, OutReSources will be housed in the Flowstone office spaces and and benefit from the established administrative support system. In January 2006, we anticipate that OutReSources will move to it’s own office when an adjacent suite is due to become available.
As noted earlier, salaries for owner/consultants, training supervisors and trainers are included in Cost of Sales. To correctly calculate the necessary payroll tax withholding, a formula was entered into the P&L table for a percentage of the combined salaried and hourly wages.


| Pro Forma Profit and Loss | |||
| Year 1 | Year 2 | Year 3 | |
| Sales | $480,000 | $627,900 | $822,120 |
| Direct Cost of Sales | $234,142 | $305,163 | $397,880 |
| Other Costs of Sales | $7,800 | $10,000 | $13,000 |
| Total Cost of Sales | $241,942 | $315,163 | $410,880 |
| Gross Margin | $238,058 | $312,737 | $411,240 |
| Gross Margin % | 49.60% | 49.81% | 50.02% |
| Expenses | |||
| Payroll | $26,000 | $97,000 | $97,000 |
| Marketing/Promotion | $1,560 | $3,000 | $4,000 |
| Depreciation | $0 | $0 | $0 |
| Rent | $5,000 | $12,000 | $15,000 |
| Utilities | $750 | $600 | $750 |
| Insurance | $1,000 | $2,000 | $3,000 |
| Payroll Taxes | $28,485 | $46,592 | $56,327 |
| Training Packet Production | $3,900 | $5,820 | $8,000 |
| Office Supplies | $2,340 | $4,000 | $5,500 |
| Total Operating Expenses | $69,035 | $171,012 | $189,577 |
| Profit Before Interest and Taxes | $169,023 | $141,725 | $221,663 |
| EBITDA | $169,023 | $141,725 | $221,663 |
| Interest Expense | $0 | $0 | $0 |
| Taxes Incurred | $50,707 | $42,517 | $66,499 |
| Net Profit | $118,316 | $99,207 | $155,164 |
| Net Profit/Sales | 24.65% | 15.80% | 18.87% |
7.4 Break-even Analysis
Our monthly break even figure is based on our anticipated cost of sales, and in-kind administrative support from Flowstone. Break even currently requires an average monthly sales as shown below. This will vary if cost of sales increases or decreases, and if overhead expenses such as administrative support is transferred from Flowstone to us sooner than expected.

| Break-even Analysis | |
| Monthly Revenue Break-even | $11,232 |
| Assumptions: | |
| Average Percent Variable Cost | 49% |
| Estimated Monthly Fixed Cost | $5,753 |
7.5 Projected Cash Flow
The Cash Flow table is based on ideal numbers. The numbers where set as explained previously by basic business principles to permit room for adjustment as the company grows. As seen in the chart as the months go by the Cash Balance remains positive. This is dependent upon reaching sales forecasts each month and keeping our expenses in line. Over time we are assured to make adjustments as stated in the explanation of the forecasting. The key components we will need to monitor that will adjust the overall true numbers are:
- The Demand for Service
- Cost of Service (The service may be desired, but must be priced right for clients to see the benefit)
- Quality of Service (A fine balance of quality vs quantity)
- Quality Cost (Salaries will be the primary factor. Can we hire quality trainers and charge a quality price while still receiving a quality profit)
The founding partners anticipate loaning the company additional monies as a short-term loan in mid-year. If sales exceed forecast this may not be necessary. Additional computers and presentation equipment will need to be purchased as new trainers and supervisors are hired.

| Pro Forma Cash Flow | |||
| Year 1 | Year 2 | Year 3 | |
| Cash Received | |||
| Cash from Operations | |||
| Cash Sales | $0 | $0 | $0 |
| Cash from Receivables | $341,008 | $585,073 | $765,880 |
| Subtotal Cash from Operations | $341,008 | $585,073 | $765,880 |
| Additional Cash Received | |||
| Sales Tax, VAT, HST/GST Received | $28,800 | $37,674 | $49,327 |
| New Current Borrowing | $0 | $0 | $0 |
| New Other Liabilities (interest-free) | $0 | $0 | $0 |
| New Long-term Liabilities | $0 | $0 | $0 |
| Sales of Other Current Assets | $0 | $0 | $0 |
| Sales of Long-term Assets | $0 | $0 | $0 |
| New Investment Received | $0 | $0 | $0 |
| Subtotal Cash Received | $369,808 | $622,747 | $815,208 |
| Expenditures | Year 1 | Year 2 | Year 3 |
| Expenditures from Operations | |||
| Cash Spending | $26,000 | $97,000 | $97,000 |
| Bill Payments | $285,781 | $446,114 | $558,592 |
| Subtotal Spent on Operations | $311,781 | $543,114 | $655,592 |
| Additional Cash Spent | |||
| Sales Tax, VAT, HST/GST Paid Out | $28,800 | $37,674 | $49,327 |
| Principal Repayment of Current Borrowing | $0 | $0 | $0 |
| Other Liabilities Principal Repayment | $0 | $0 | $0 |
| Long-term Liabilities Principal Repayment | $0 | $0 | $0 |
| Purchase Other Current Assets | $4,000 | $4,000 | $6,000 |
| Purchase Long-term Assets | $0 | $0 | $0 |
| Dividends | $0 | $0 | $0 |
| Subtotal Cash Spent | $344,581 | $584,788 | $710,919 |
| Net Cash Flow | $25,228 | $37,959 | $104,288 |
| Cash Balance | $49,728 | $87,686 | $191,975 |
7.6 Projected Balance Sheet
The balance sheet is not a key factor at this point since OutReSources, Inc. will be operating as a company within a company and utilizing Flowstone, Inc.’s assets. Given that any start-up cost or realized loss can be deemed as an assets expense for Flowstone there is truly little to no liability or risk thereof.
| Pro Forma Balance Sheet | |||
| Year 1 | Year 2 | Year 3 | |
| Assets | |||
| Current Assets | |||
| Cash | $49,728 | $87,686 | $191,975 |
| Accounts Receivable | $138,992 | $181,818 | $238,058 |
| Other Current Assets | $5,000 | $9,000 | $15,000 |
| Total Current Assets | $193,719 | $278,505 | $445,033 |
| Long-term Assets | |||
| Long-term Assets | $0 | $0 | $0 |
| Accumulated Depreciation | $0 | $0 | $0 |
| Total Long-term Assets | $0 | $0 | $0 |
| Total Assets | $193,719 | $278,505 | $445,033 |
| Liabilities and Capital | Year 1 | Year 2 | Year 3 |
| Current Liabilities | |||
| Accounts Payable | $49,903 | $35,482 | $46,846 |
| Current Borrowing | $0 | $0 | $0 |
| Other Current Liabilities | $0 | $0 | $0 |
| Subtotal Current Liabilities | $49,903 | $35,482 | $46,846 |
| Long-term Liabilities | $0 | $0 | $0 |
| Total Liabilities | $49,903 | $35,482 | $46,846 |
| Paid-in Capital | $40,000 | $40,000 | $40,000 |
| Retained Earnings | ($14,500) | $103,816 | $203,023 |
| Earnings | $118,316 | $99,207 | $155,164 |
| Total Capital | $143,816 | $243,023 | $398,187 |
| Total Liabilities and Capital | $193,719 | $278,505 | $445,033 |
| Net Worth | $143,816 | $243,023 | $398,187 |
7.7 Business Ratios
The following table shows the projected business ratios. We expect to maintain healthy ratios for profitability, risk, and return. The industry comparisons are for SIC 8742.0200, Human Resources Consulting, part of the larger Management Consulting Services category. The most noteworthy catagory is the percent of sales. You will notice that OutReSources, Inc. and Industry Standards are comparable until gross profit margin wherein OutReSources falls back by 50% from industry standards. This is primarily due to the majority of our expenses coming from staff compensation. However, OutReSources more than compensates in general administrative expenses. Though the numbers are based on ideal assumptions and are subject to change, OutReSources’ owner and management structure will continue to minimize general admin costs.
| Ratio Analysis | ||||
| Year 1 | Year 2 | Year 3 | Industry Profile | |
| Sales Growth | 0.00% | 30.81% | 30.93% | 6.61% |
| Percent of Total Assets | ||||
| Accounts Receivable | 71.75% | 65.28% | 53.49% | 18.68% |
| Other Current Assets | 2.58% | 3.23% | 3.37% | 49.64% |
| Total Current Assets | 100.00% | 100.00% | 100.00% | 71.06% |
| Long-term Assets | 0.00% | 0.00% | 0.00% | 28.94% |
| Total Assets | 100.00% | 100.00% | 100.00% | 100.00% |
| Current Liabilities | 25.76% | 12.74% | 10.53% | 35.28% |
| Long-term Liabilities | 0.00% | 0.00% | 0.00% | 15.95% |
| Total Liabilities | 25.76% | 12.74% | 10.53% | 51.23% |
| Net Worth | 74.24% | 87.26% | 89.47% | 48.77% |
| Percent of Sales | ||||
| Sales | 100.00% | 100.00% | 100.00% | 100.00% |
| Gross Margin | 49.60% | 49.81% | 50.02% | 100.00% |
| Selling, General & Administrative Expenses | 24.95% | 34.01% | 31.15% | 83.35% |
| Advertising Expenses | 0.00% | 0.00% | 0.00% | 1.13% |
| Profit Before Interest and Taxes | 35.21% | 22.57% | 26.96% | 2.92% |
| Main Ratios | ||||
| Current | 3.88 | 7.85 | 9.50 | 1.49 |
| Quick | 3.88 | 7.85 | 9.50 | 1.25 |
| Total Debt to Total Assets | 25.76% | 12.74% | 10.53% | 60.96% |
| Pre-tax Return on Net Worth | 117.53% | 58.32% | 55.67% | 7.36% |
| Pre-tax Return on Assets | 87.25% | 50.89% | 49.81% | 18.86% |
| Additional Ratios | Year 1 | Year 2 | Year 3 | |
| Net Profit Margin | 24.65% | 15.80% | 18.87% | n.a |
| Return on Equity | 82.27% | 40.82% | 38.97% | n.a |
| Activity Ratios | ||||
| Accounts Receivable Turnover | 3.45 | 3.45 | 3.45 | n.a |
| Collection Days | 55 | 93 | 93 | n.a |
| Accounts Payable Turnover | 6.73 | 12.17 | 12.17 | n.a |
| Payment Days | 27 | 36 | 26 | n.a |
| Total Asset Turnover | 2.48 | 2.25 | 1.85 | n.a |
| Debt Ratios | ||||
| Debt to Net Worth | 0.35 | 0.15 | 0.12 | n.a |
| Current Liab. to Liab. | 1.00 | 1.00 | 1.00 | n.a |
| Liquidity Ratios | ||||
| Net Working Capital | $143,816 | $243,023 | $398,187 | n.a |
| Interest Coverage | 0.00 | 0.00 | 0.00 | n.a |
| Additional Ratios | ||||
| Assets to Sales | 0.40 | 0.44 | 0.54 | n.a |
| Current Debt/Total Assets | 26% | 13% | 11% | n.a |
| Acid Test | 1.10 | 2.72 | 4.42 | n.a |
| Sales/Net Worth | 3.34 | 2.58 | 2.06 | n.a |
| Dividend Payout | 0.00 | 0.00 | 0.00 | n.a |
Appendix
| Sales Forecast | |||||||||||||
| Month 1 | Month 2 | Month 3 | Month 4 | Month 5 | Month 6 | Month 7 | Month 8 | Month 9 | Month 10 | Month 11 | Month 12 | ||
| Sales | |||||||||||||
| Pre-audit Review | 0% | $2,500 | $5,000 | $7,500 | $10,000 | $12,500 | $15,000 | $17,500 | $20,000 | $22,500 | $25,000 | $27,500 | $30,000 |
| Pre-audit Review with Training | 0% | $3,500 | $7,000 | $10,500 | $14,000 | $17,500 | $20,000 | $23,500 | $27,000 | $30,500 | $34,000 | $37,500 | $40,500 |
| Specialized Trainings | 0% | $100 | $200 | $300 | $400 | $500 | $600 | $700 | $800 | $900 | $1,000 | $1,100 | $1,200 |
| Certification Courses | 0% | $150 | $300 | $450 | $600 | $750 | $900 | $1,050 | $1,200 | $1,350 | $1,500 | $1,650 | $1,800 |
| Total Sales | $6,250 | $12,500 | $18,750 | $25,000 | $31,250 | $36,500 | $42,750 | $49,000 | $55,250 | $61,500 | $67,750 | $73,500 | |
| Direct Cost of Sales | Month 1 | Month 2 | Month 3 | Month 4 | Month 5 | Month 6 | Month 7 | Month 8 | Month 9 | Month 10 | Month 11 | Month 12 | |
| Pre-audit Review | $1,250 | $2,500 | $3,750 | $5,000 | $6,250 | $7,500 | $8,750 | $10,000 | $11,250 | $12,500 | $13,750 | $15,000 | |
| Pre-audit Review with Training | $1,750 | $3,500 | $5,250 | $7,000 | $8,750 | $10,000 | $11,750 | $13,500 | $15,250 | $17,000 | $18,750 | $20,250 | |
| Specialized Trainings | $25 | $50 | $75 | $100 | $125 | $150 | $175 | $200 | $225 | $250 | $275 | $300 | |
| Certification Courses | $25 | $50 | $75 | $100 | $125 | $149 | $174 | $199 | $224 | $249 | $274 | $299 | |
| Subtotal Direct Cost of Sales | $3,050 | $6,100 | $9,150 | $12,200 | $15,250 | $17,799 | $20,849 | $23,899 | $26,949 | $29,999 | $33,049 | $35,849 | |
| Personnel Plan | |||||||||||||
| Month 1 | Month 2 | Month 3 | Month 4 | Month 5 | Month 6 | Month 7 | Month 8 | Month 9 | Month 10 | Month 11 | Month 12 | ||
| Owners/Consultants | 0% | $0 | $0 | $0 | $0 | $0 | $0 | $0 | $0 | $0 | $0 | $0 | $0 |
| Operations Manager | 0% | $0 | $0 | $0 | $0 | $0 | $0 | $0 | $0 | $0 | $0 | $0 | $0 |
| Training Supervisors | 0% | $0 | $0 | $0 | $0 | $0 | $0 | $0 | $0 | $0 | $0 | $0 | $0 |
| Trainers | 0% | $0 | $0 | $0 | $0 | $0 | $0 | $0 | $0 | $0 | $0 | $0 | $0 |
| Paraprofessionals | 0% | $0 | $0 | $0 | $0 | $2,000 | $2,000 | $2,000 | $2,000 | $2,000 | $2,000 | $2,000 | $2,000 |
| Administrative Support | 0% | $0 | $0 | $0 | $0 | $0 | $0 | $0 | $2,000 | $2,000 | $2,000 | $2,000 | $2,000 |
| Total People | 0 | 0 | 0 | 0 | 0 | 0 | 0 | 0 | 0 | 0 | 0 | 0 | |
| Total Payroll | $0 | $0 | $0 | $0 | $2,000 | $2,000 | $2,000 | $4,000 | $4,000 | $4,000 | $4,000 | $4,000 | |
| Pro Forma Profit and Loss | |||||||||||||
| Month 1 | Month 2 | Month 3 | Month 4 | Month 5 | Month 6 | Month 7 | Month 8 | Month 9 | Month 10 | Month 11 | Month 12 | ||
| Sales | $6,250 | $12,500 | $18,750 | $25,000 | $31,250 | $36,500 | $42,750 | $49,000 | $55,250 | $61,500 | $67,750 | $73,500 | |
| Direct Cost of Sales | $3,050 | $6,100 | $9,150 | $12,200 | $15,250 | $17,799 | $20,849 | $23,899 | $26,949 | $29,999 | $33,049 | $35,849 | |
| Other Costs of Sales | $100 | $200 | $300 | $400 | $500 | $600 | $700 | $800 | $900 | $1,000 | $1,100 | $1,200 | |
| Total Cost of Sales | $3,150 | $6,300 | $9,450 | $12,600 | $15,750 | $18,399 | $21,549 | $24,699 | $27,849 | $30,999 | $34,149 | $37,049 | |
| Gross Margin | $3,100 | $6,200 | $9,300 | $12,400 | $15,501 | $18,101 | $21,201 | $24,301 | $27,401 | $30,501 | $33,601 | $36,451 | |
| Gross Margin % | 49.60% | 49.60% | 49.60% | 49.60% | 49.60% | 49.59% | 49.59% | 49.59% | 49.59% | 49.60% | 49.60% | 49.59% | |
| Expenses | |||||||||||||
| Payroll | $0 | $0 | $0 | $0 | $2,000 | $2,000 | $2,000 | $4,000 | $4,000 | $4,000 | $4,000 | $4,000 | |
| Marketing/Promotion | $20 | $40 | $60 | $80 | $100 | $120 | $140 | $160 | $180 | $200 | $220 | $240 | |
| Depreciation | $0 | $0 | $0 | $0 | $0 | $0 | $0 | $0 | $0 | $0 | $0 | $0 | |
| Rent | $0 | $0 | $0 | $0 | $0 | $0 | $0 | $1,000 | $1,000 | $1,000 | $1,000 | $1,000 | |
| Utilities | $0 | $0 | $0 | $0 | $0 | $0 | $0 | $150 | $150 | $150 | $150 | $150 | |
| Insurance | $0 | $0 | $0 | $0 | $0 | $0 | $0 | $200 | $200 | $200 | $200 | $200 | |
| Payroll Taxes | 15% | $320 | $640 | $961 | $1,281 | $1,901 | $2,169 | $2,489 | $3,109 | $3,430 | $3,750 | $4,070 | $4,364 |
| Training Packet Production | 15% | $50 | $100 | $150 | $200 | $250 | $300 | $350 | $400 | $450 | $500 | $550 | $600 |
| Office Supplies | $30 | $60 | $90 | $120 | $150 | $180 | $210 | $240 | $270 | $300 | $330 | $360 | |
| Total Operating Expenses | $420 | $840 | $1,261 | $1,681 | $4,401 | $4,769 | $5,189 | $9,259 | $9,680 | $10,100 | $10,520 | $10,914 | |
| Profit Before Interest and Taxes | $2,680 | $5,360 | $8,040 | $10,719 | $11,099 | $13,332 | $16,012 | $15,041 | $17,721 | $20,401 | $23,081 | $25,537 | |
| EBITDA | $2,680 | $5,360 | $8,040 | $10,719 | $11,099 | $13,332 | $16,012 | $15,041 | $17,721 | $20,401 | $23,081 | $25,537 | |
| Interest Expense | $0 | $0 | $0 | $0 | $0 | $0 | $0 | $0 | $0 | $0 | $0 | $0 | |
| Taxes Incurred | $804 | $1,608 | $2,412 | $3,216 | $3,330 | $3,999 | $4,803 | $4,512 | $5,316 | $6,120 | $6,924 | $7,661 | |
| Net Profit | $1,876 | $3,752 | $5,628 | $7,504 | $7,770 | $9,332 | $11,208 | $10,529 | $12,405 | $14,281 | $16,157 | $17,876 | |
| Net Profit/Sales | 30.01% | 30.01% | 30.01% | 30.01% | 24.86% | 25.57% | 26.22% | 21.49% | 22.45% | 23.22% | 23.85% | 24.32% | |
| Pro Forma Cash Flow | |||||||||||||
| Month 1 | Month 2 | Month 3 | Month 4 | Month 5 | Month 6 | Month 7 | Month 8 | Month 9 | Month 10 | Month 11 | Month 12 | ||
| Cash Received | |||||||||||||
| Cash from Operations | |||||||||||||
| Cash Sales | $0 | $0 | $0 | $0 | $0 | $0 | $0 | $0 | $0 | $0 | $0 | $0 | |
| Cash from Receivables | $0 | $208 | $6,458 | $12,708 | $18,958 | $25,208 | $31,425 | $36,708 | $42,958 | $49,208 | $55,458 | $61,708 | |
| Subtotal Cash from Operations | $0 | $208 | $6,458 | $12,708 | $18,958 | $25,208 | $31,425 | $36,708 | $42,958 | $49,208 | $55,458 | $61,708 | |
| Additional Cash Received | |||||||||||||
| Sales Tax, VAT, HST/GST Received | 6.00% | $375 | $750 | $1,125 | $1,500 | $1,875 | $2,190 | $2,565 | $2,940 | $3,315 | $3,690 | $4,065 | $4,410 |
| New Current Borrowing | $0 | $0 | $0 | $0 | $0 | $0 | $0 | $0 | $0 | $0 | $0 | $0 | |
| New Other Liabilities (interest-free) | $0 | $0 | $0 | $0 | $0 | $0 | $0 | $0 | $0 | $0 | $0 | $0 | |
| New Long-term Liabilities | $0 | $0 | $0 | $0 | $0 | $0 | $0 | $0 | $0 | $0 | $0 | $0 | |
| Sales of Other Current Assets | $0 | $0 | $0 | $0 | $0 | $0 | $0 | $0 | $0 | $0 | $0 | $0 | |
| Sales of Long-term Assets | $0 | $0 | $0 | $0 | $0 | $0 | $0 | $0 | $0 | $0 | $0 | $0 | |
| New Investment Received | $0 | $0 | $0 | $0 | $0 | $0 | $0 | $0 | $0 | $0 | $0 | $0 | |
| Subtotal Cash Received | $375 | $958 | $7,583 | $14,208 | $20,833 | $27,398 | $33,990 | $39,648 | $46,273 | $52,898 | $59,523 | $66,118 | |
| Expenditures | Month 1 | Month 2 | Month 3 | Month 4 | Month 5 | Month 6 | Month 7 | Month 8 | Month 9 | Month 10 | Month 11 | Month 12 | |
| Expenditures from Operations | |||||||||||||
| Cash Spending | $0 | $0 | $0 | $0 | $2,000 | $2,000 | $2,000 | $4,000 | $4,000 | $4,000 | $4,000 | $4,000 | |
| Bill Payments | $146 | $4,520 | $8,894 | $13,268 | $17,629 | $21,603 | $25,314 | $29,706 | $34,617 | $38,991 | $43,365 | $47,728 | |
| Subtotal Spent on Operations | $146 | $4,520 | $8,894 | $13,268 | $19,629 | $23,603 | $27,314 | $33,706 | $38,617 | $42,991 | $47,365 | $51,728 | |
| Additional Cash Spent | |||||||||||||
| Sales Tax, VAT, HST/GST Paid Out | $375 | $750 | $1,125 | $1,500 | $1,875 | $2,190 | $2,565 | $2,940 | $3,315 | $3,690 | $4,065 | $4,410 | |
| Principal Repayment of Current Borrowing | $0 | $0 | $0 | $0 | $0 | $0 | $0 | $0 | $0 | $0 | $0 | $0 | |
| Other Liabilities Principal Repayment | $0 | $0 | $0 | $0 | $0 | $0 | $0 | $0 | $0 | $0 | $0 | $0 | |
| Long-term Liabilities Principal Repayment | $0 | $0 | $0 | $0 | $0 | $0 | $0 | $0 | $0 | $0 | $0 | $0 | |
| Purchase Other Current Assets | $0 | $0 | $0 | $0 | $2,000 | $0 | $0 | $2,000 | $0 | $0 | $0 | $0 | |
| Purchase Long-term Assets | $0 | $0 | $0 | $0 | $0 | $0 | $0 | $0 | $0 | $0 | $0 | $0 | |
| Dividends | $0 | $0 | $0 | $0 | $0 | $0 | $0 | $0 | $0 | $0 | $0 | $0 | |
| Subtotal Cash Spent | $521 | $5,270 | $10,019 | $14,768 | $23,504 | $25,793 | $29,879 | $38,646 | $41,932 | $46,681 | $51,430 | $56,138 | |
| Net Cash Flow | ($146) | ($4,312) | ($2,436) | ($560) | ($2,671) | $1,605 | $4,111 | $1,002 | $4,341 | $6,217 | $8,093 | $9,981 | |
| Cash Balance | $24,354 | $20,043 | $17,607 | $17,047 | $14,376 | $15,981 | $20,093 | $21,095 | $25,436 | $31,654 | $39,747 | $49,728 | |
| Pro Forma Balance Sheet | |||||||||||||
| Month 1 | Month 2 | Month 3 | Month 4 | Month 5 | Month 6 | Month 7 | Month 8 | Month 9 | Month 10 | Month 11 | Month 12 | ||
| Assets | Starting Balances | ||||||||||||
| Current Assets | |||||||||||||
| Cash | $24,500 | $24,354 | $20,043 | $17,607 | $17,047 | $14,376 | $15,981 | $20,093 | $21,095 | $25,436 | $31,654 | $39,747 | $49,728 |
| Accounts Receivable | $0 | $6,250 | $18,542 | $30,833 | $43,125 | $55,417 | $66,708 | $78,033 | $90,325 | $102,617 | $114,908 | $127,200 | $138,992 |
| Other Current Assets | $1,000 | $1,000 | $1,000 | $1,000 | $1,000 | $3,000 | $3,000 | $3,000 | $5,000 | $5,000 | $5,000 | $5,000 | $5,000 |
| Total Current Assets | $25,500 | $31,604 | $39,584 | $49,440 | $61,172 | $72,793 | $85,690 | $101,126 | $116,420 | $133,053 | $151,562 | $171,947 | $193,719 |
| Long-term Assets | |||||||||||||
| Long-term Assets | $0 | $0 | $0 | $0 | $0 | $0 | $0 | $0 | $0 | $0 | $0 | $0 | $0 |
| Accumulated Depreciation | $0 | $0 | $0 | $0 | $0 | $0 | $0 | $0 | $0 | $0 | $0 | $0 | $0 |
| Total Long-term Assets | $0 | $0 | $0 | $0 | $0 | $0 | $0 | $0 | $0 | $0 | $0 | $0 | $0 |
| Total Assets | $25,500 | $31,604 | $39,584 | $49,440 | $61,172 | $72,793 | $85,690 | $101,126 | $116,420 | $133,053 | $151,562 | $171,947 | $193,719 |
| Liabilities and Capital | Month 1 | Month 2 | Month 3 | Month 4 | Month 5 | Month 6 | Month 7 | Month 8 | Month 9 | Month 10 | Month 11 | Month 12 | |
| Current Liabilities | |||||||||||||
| Accounts Payable | $0 | $4,228 | $8,457 | $12,685 | $16,913 | $20,764 | $24,329 | $28,557 | $33,322 | $37,550 | $41,779 | $46,007 | $49,903 |
| Current Borrowing | $0 | $0 | $0 | $0 | $0 | $0 | $0 | $0 | $0 | $0 | $0 | $0 | $0 |
| Other Current Liabilities | $0 | $0 | $0 | $0 | $0 | $0 | $0 | $0 | $0 | $0 | $0 | $0 | $0 |
| Subtotal Current Liabilities | $0 | $4,228 | $8,457 | $12,685 | $16,913 | $20,764 | $24,329 | $28,557 | $33,322 | $37,550 | $41,779 | $46,007 | $49,903 |
| Long-term Liabilities | $0 | $0 | $0 | $0 | $0 | $0 | $0 | $0 | $0 | $0 | $0 | $0 | $0 |
| Total Liabilities | $0 | $4,228 | $8,457 | $12,685 | $16,913 | $20,764 | $24,329 | $28,557 | $33,322 | $37,550 | $41,779 | $46,007 | $49,903 |
| Paid-in Capital | $40,000 | $40,000 | $40,000 | $40,000 | $40,000 | $40,000 | $40,000 | $40,000 | $40,000 | $40,000 | $40,000 | $40,000 | $40,000 |
| Retained Earnings | ($14,500) | ($14,500) | ($14,500) | ($14,500) | ($14,500) | ($14,500) | ($14,500) | ($14,500) | ($14,500) | ($14,500) | ($14,500) | ($14,500) | ($14,500) |
| Earnings | $0 | $1,876 | $5,628 | $11,255 | $18,759 | $26,529 | $35,861 | $47,069 | $57,598 | $70,003 | $84,283 | $100,440 | $118,316 |
| Total Capital | $25,500 | $27,376 | $31,128 | $36,755 | $44,259 | $52,029 | $61,361 | $72,569 | $83,098 | $95,503 | $109,783 | $125,940 | $143,816 |
| Total Liabilities and Capital | $25,500 | $31,604 | $39,584 | $49,440 | $61,172 | $72,793 | $85,690 | $101,126 | $116,420 | $133,053 | $151,562 | $171,947 | $193,719 |
| Net Worth | $25,500 | $27,376 | $31,128 | $36,755 | $44,259 | $52,029 | $61,361 | $72,569 | $83,098 | $95,503 | $109,783 | $125,940 | $143,816 |

