
Buy The Time
Executive Summary
Buy the Time will be a shopping service that allows customers to purchase gifts and necessities of life at little inconvenience to their schedule and workday. We will do this with the aid of a shopping consultant to provide each customer with quality solutions to their shopping concerns at reasonable prices. The owner has had years of experience in the retail market and is aware of trends and the shopping environment. In time, this service will evolve to incorporate a larger market instead of a luxury for the more wealthy customers.
1.1 Mission
The mission of Buy the Time is to offer custom goods for all occasions with minimal interruptions into our clients’ daily activities. We want our customers to be able to give special gifts to their loved ones without it being a stressful event. We will strive to provide expert consultants in order to guide the client from start to finish with low-cost, reliable information in a timely fashion.
1.2 Objectives
The objectives for the company are outlined below:
-
Obtain and service clients with a knowledgeable sales team offering purchases of goods based on desires and needs.
-
For a low charge, allow people to obtain custom items with minimal interruption into their day and life.
-
Grow into a large franchise with a reputation for getting the desired item at a reasonable cost.
1.3 Keys to Success
In order to ensure a healthy profit and low customer turnover, Buy the Time will have to:
- Provide a significantly easier, more convenient, and customized shopping experience than can be found in high-end stores.
- Ensure 100% customer satisfaction.
- Establish close ties with the clients to ensure repeat business, encourage customer feedback to enhance further customized service, and promote word-of-mouth marketing.
Company Summary
Buy the Time is a shopping service which allows the client to purchase custom items without stress. With our expert staff, we intend to grow into a larger market where we can still be personable, yet offer greater choices.
Our ideal larger market will expand from the Seattle area to include New York, San Francisco, Los Angeles, Chicago, and Miami.
2.1 Company Ownership
Buy the Time will be a Seattle, WA-based company. It will be formed as a simple sole proprietorship. The company will operate as a home business until such time as expansion is required.
Jade Kousky is the owner and sole proprietor. With many years of retail experience, she brings a unique knowledge of discovering solutions to personal needs at low cost. Many have known her to have a personal flare for anticipating trends and an ability to match purchases to a client’s desires.
With growth, Ms. Kousky plans to convert the sole proprietorship into a corporation, still maintaining major control. Each location manager will operate as a key figure in the growth and evolution of Buy the Time.
2.2 Start-up Summary
Originally, operation will be based out of the owner’s residence. One-to-one service can be provided by meeting the client at a time and place most convenient for them. This will cut unnecessary costs while still providing superb service.

| Start-up Funding | |
| Start-up Expenses to Fund | $1,250 |
| Start-up Assets to Fund | $3,650 |
| Total Funding Required | $4,900 |
| Assets | |
| Non-cash Assets from Start-up | $2,400 |
| Cash Requirements from Start-up | $1,250 |
| Additional Cash Raised | $0 |
| Cash Balance on Starting Date | $1,250 |
| Total Assets | $3,650 |
| Liabilities and Capital | |
| Liabilities | |
| Current Borrowing | $0 |
| Long-term Liabilities | $0 |
| Accounts Payable (Outstanding Bills) | $0 |
| Other Current Liabilities (interest-free) | $0 |
| Total Liabilities | $0 |
| Capital | |
| Planned Investment | |
| Owner | $3,250 |
| Private Investor | $1,650 |
| Other | $0 |
| Additional Investment Requirement | $0 |
| Total Planned Investment | $4,900 |
| Loss at Start-up (Start-up Expenses) | ($1,250) |
| Total Capital | $3,650 |
| Total Capital and Liabilities | $3,650 |
| Total Funding | $4,900 |
| Start-up | |
| Requirements | |
| Start-up Expenses | |
| Legal | $300 |
| Stationery etc. | $150 |
| Brochures | $200 |
| Consultants | $0 |
| Insurance | $0 |
| Rent | $0 |
| Research and development | $100 |
| Expensed equipment | $500 |
| Other | $0 |
| Total Start-up Expenses | $1,250 |
| Start-up Assets | |
| Cash Required | $1,250 |
| Other Current Assets | $400 |
| Long-term Assets | $2,000 |
| Total Assets | $3,650 |
| Total Requirements | $4,900 |
Services
Buy the Time will offer an expert consultant for all occasions. This consultant will specialize in personal gifts and ideas for people who desire the latest fashions and/or gift solutions for individuals who are hard to shop for. This service will provide insight, research, purchases, and delivery in custom packaging. The focus of the company is the needs of the client. It is the job of the consultant to translate those needs into low-cost solutions.
Market Analysis Summary
Buy the Time will target the middle-aged, busy executive. These individuals often have extremely busy schedules, including a great deal of travel time. In addition, they possess a large proportion of disposable income that allows them to afford custom services. This service will allow them more concentration on work, while allowing them to obtain great products for personal and business life.
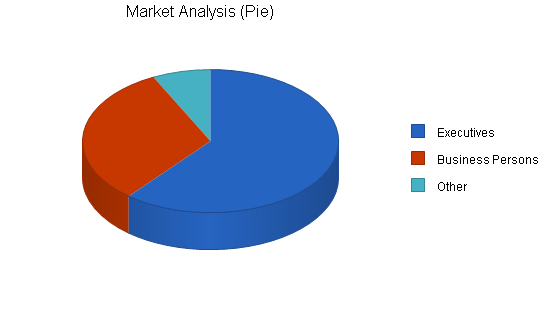
4.1 Market Segmentation
The target market for Buy the Time is broken into three segments:
- Busy executives desiring to keep pace with the trends, yet not having the time to facilitate their needs.
- Younger business persons who choose to have the luxury and convenience of a personalized shopping service.
- Those needing consultation in gifts and/or not wanting the pressures that are associated with finding custom gifts for special occasions.
| Market Analysis | |||||||
| Year 1 | Year 2 | Year 3 | Year 4 | Year 5 | |||
| Potential Customers | Growth | CAGR | |||||
| Executives | 52% | 500 | 900 | 1,300 | 4,000 | 6,400 | 89.15% |
| Business Persons | 32% | 260 | 500 | 800 | 2,010 | 3,900 | 96.80% |
| Other | 15% | 60 | 240 | 400 | 1,000 | 1,840 | 135.32% |
| Total | 96.16% | 820 | 1,640 | 2,500 | 7,010 | 12,140 | 96.16% |
4.2 Market Needs
Buy the Time’s primary market, the executive or high-end professional individual, has certain needs that are outlined below.
- They often find that their image is very important, both professionally and personally. They need advice or information on what the latest trends and fashions are.
- They keep busy schedules that often involve a lot of travel. This leaves little time for shopping that is time consuming, such as gift buying.
- They have a desire to be pampered and willingly spend money as a symbol of status.
4.3 Target Market Segment Strategy
The best way to develop the company is to make our service necessary and accessible to the public. By facilitating their needs easily, we offer a great service at little inconvenience to them in a time where convenience matters the most.
In its broadest definition, the American shopping market consists of every American who needs to buy goods and services for themselves and their families. Although it is the aim of Buy the Time to eventually reach out to a wide range of shoppers, including middle income families, busy professionals, and people looking for “hard to find” items, the company will focus first on the busy executive-type shopper.
4.4 Service Business Analysis
Buy the Time offers the service of shopping advice/expertise in trends, fashions, and emerging products, along with the purchasing and delivery of such items to the customer’s residence. It is assumed that most of the items purchased will be in single or small quantities. The primary attraction of such a service is that it significantly cuts down on shopping time for busy customers who wish to utilize their time for other purposes. With the advent of computers and the Internet, it is believed that this service can be offered at a low cost, and can be enhanced through the use of an established-customer database to track individual preferences.
4.5 Competition and Buying Patterns
This is a luxury service. An affordable cost will be needed to maintain clients and keep their needs constant. This requires being aware of economic changes, as well as alterations in trends.

At the moment, there are few services like this in the Seattle area. Therefore, there is a tremendous opportunity to build and retain significant market share. Customers choose and retain services like this often through word-of-mouth, when the company is able to achieve a high level of customer satisfaction. Although it is the aim of Buy the Time to significantly lower costs of this luxury service, at this time, cost does not play a significant factor in how customers choose a shopping service. The bottom line is establishing a strong intimate relationship with customers to capture the long-term profits through repeat business and create the enthusiasm among customers that will spur on word-of-mouth marketing.
Strategy and Implementation Summary
Buy the Time will concentrate on expanding in metropolitan areas that have significant growth of young business persons and executives. Starting in Seattle, it will grow down the west coast to San Francisco and Los Angeles. From there we will target the east coast with locations in New York City, Miami, and Chicago.
The target customer is a busy business person unable to find time for purchasing custom goods. We will provide this tailored service to work around their schedules, while maintaining a low cost.
5.1 Competitive Edge
Our competitive edge lies in our expert service at a reasonable price. We will transform this service from a luxury into a demand service. We will provide a database for remembering occasions and dates, this will allow the client to remain stress-free. Buy the Time was created by an expert shopper who knows trends, prices, and details, such as fabrics and colors.
We are aware that there will be others trying to offer such a service, but only we will be able to provide such services at a low cost, with friendly consultants, and an ability to find exactly what our clients desire.
5.2 Sales Strategy
Our sales will be generated from repeat clients. This service will be established as an easy and friendly way to shop without the hassle. We will offer low introductory costs for our services. To ensure that all purchases will be worthwhile for the consultant, all of our orders will have a minimal amount required to cover any expenses incurred. This will be minimal, allowing for our services to be affordable.
Ms. Kousky has enough contacts in the Seattle area who have expressed interest in the service that no advertising will be needed for the first year of operation. Subsequent advertising (which may not start until year four or five) will depend on word-of-mouth, a website, telephone directory ads, local newspaper ads and articles, and brochures.
5.2.1 Sales Forecast
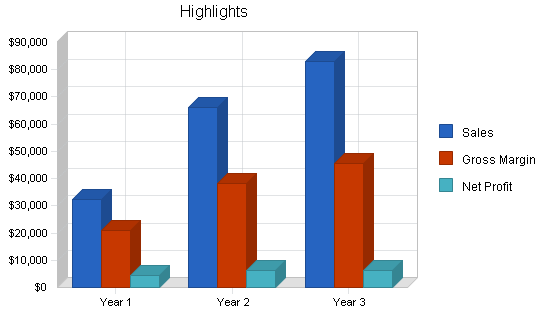
The following chart and table document forecasted sales.
In both April and May we expect a two percent growth each month. From June to September, each month should reflect a growth of five percent, since many activities occur during the summer months. October will show approximately four percent, since this is usually a time of transitions. November and December will show an increase to seven percent, with many people buying for the holidays. January through April will be an increase of one percent each month, since this is a slow retail period.
This will result in a growth of 68% after the first year. From that, sales in 2002 will see a growth of 57% as we develop our team of consultants. By 2003, sales will show a 78% growth. By the end of the third year, we will be able to move into markets outside the Seattle area.

| Sales Forecast | |||
| Year 1 | Year 2 | Year 3 | |
| Sales | |||
| Jade Kousky – Owner | $32,365 | $41,000 | $50,000 |
| Retail Consultant 1 | $0 | $25,000 | $33,000 |
| Total Sales | $32,365 | $66,000 | $83,000 |
| Direct Cost of Sales | Year 1 | Year 2 | Year 3 |
| Jade Kousky – Owner | $11,250 | $18,750 | $22,500 |
| Retail Consultant 1 | $0 | $9,000 | $15,000 |
| Subtotal Direct Cost of Sales | $11,250 | $27,750 | $37,500 |
Management Summary
As Buy the Time grows, we will add consultants so that we may continue to offer personalized service in a timely fashion. Originally, it will start with the owner as the sole employee. By the end of the first year, another consultant will be added. From that point we will add a consultant when we choose to grow into different markets. We will shape our team depending on sales and growth.
Marketing and public relations will be handled mainly by the owner. If there is a greater need, a marketing consultant will be used.
| Personnel Plan | |||
| Year 1 | Year 2 | Year 3 | |
| Owner | $15,000 | $30,000 | $37,000 |
| Other | $0 | $0 | $0 |
| Total People | 0 | 0 | 0 |
| Total Payroll | $15,000 | $30,000 | $37,000 |
Financial Plan
Growth will occur according to the number of clients and cash flow.
With approximately half of our services provided on credit, collection will be essential. With this still being a service that is not essential to everyday living, we will show that payments are necessary immediately. With a concrete system for cash flow, we will be able to keep debt to a minimum, while still providing a high level of sales.
7.1 Important Assumptions
The following assumptions are made responding to growth, and are based on economic trends from the preceding two years.
- A strong economy is expected to continue in the future.
- Many people have annual dates on which purchases are made.
- It is assumed that people are willing to pay for a service if it is an agreeable and convenient experience.
The table below outlines some business assumptions that are the basis for Buy The Time’s growth, including tax rate and payment days.
| General Assumptions | |||
| Year 1 | Year 2 | Year 3 | |
| Plan Month | 1 | 2 | 3 |
| Current Interest Rate | 10.00% | 10.00% | 10.00% |
| Long-term Interest Rate | 10.00% | 10.00% | 10.00% |
| Tax Rate | 25.42% | 25.00% | 25.42% |
| Other | 0 | 0 | 0 |
7.2 Break-even Analysis
Our break-even analysis is shown in further detail in the following chart and table.
This is a conservative figure since contacts have been made, and have already generated many orders for our services. Buy the Time’s goal is to generate twice as much as the break-even point for a monthly standard.

| Break-even Analysis | |
| Monthly Revenue Break-even | $1,916 |
| Assumptions: | |
| Average Percent Variable Cost | 35% |
| Estimated Monthly Fixed Cost | $1,250 |
7.3 Projected Profit and Loss
Buy the Time’s projected profit and loss is indicated in the following table. Gross margin should remain between 50-70% the first year, with highest profits due near the end of the year. This should prove to be accurate, since that is a time when many clients increase their spending.
| Pro Forma Profit and Loss | |||
| Year 1 | Year 2 | Year 3 | |
| Sales | $32,365 | $66,000 | $83,000 |
| Direct Cost of Sales | $11,250 | $27,750 | $37,500 |
| Other | $0 | $0 | $0 |
| Total Cost of Sales | $11,250 | $27,750 | $37,500 |
| Gross Margin | $21,115 | $38,250 | $45,500 |
| Gross Margin % | 65.24% | 57.95% | 54.82% |
| Expenses | |||
| Payroll | $15,000 | $30,000 | $37,000 |
| Sales and Marketing and Other Expenses | $0 | $0 | $0 |
| Depreciation | $0 | $0 | $0 |
| Leased Equipment | $0 | $0 | $0 |
| Utilities | $0 | $0 | $0 |
| Insurance | $0 | $0 | $0 |
| Rent | $0 | $0 | $0 |
| Payroll Taxes | $0 | $0 | $0 |
| Other | $0 | $0 | $0 |
| Total Operating Expenses | $15,000 | $30,000 | $37,000 |
| Profit Before Interest and Taxes | $6,115 | $8,250 | $8,500 |
| EBITDA | $6,115 | $8,250 | $8,500 |
| Interest Expense | $0 | $0 | $0 |
| Taxes Incurred | $1,528 | $2,063 | $2,160 |
| Net Profit | $4,587 | $6,188 | $6,340 |
| Net Profit/Sales | 14.17% | 9.38% | 7.64% |
7.4 Projected Cash Flow
The following chart and table outline the cash flow for fiscal years 2002, 2003, and 2004. For a monthly analysis, please see the attached appendix.

| Pro Forma Cash Flow | |||
| Year 1 | Year 2 | Year 3 | |
| Cash Received | |||
| Cash from Operations | |||
| Cash Sales | $17,801 | $36,300 | $45,650 |
| Cash from Receivables | $11,759 | $26,785 | $35,877 |
| Subtotal Cash from Operations | $29,560 | $63,085 | $81,527 |
| Additional Cash Received | |||
| Sales Tax, VAT, HST/GST Received | $0 | $0 | $0 |
| New Current Borrowing | $0 | $0 | $0 |
| New Other Liabilities (interest-free) | $0 | $0 | $0 |
| New Long-term Liabilities | $0 | $0 | $0 |
| Sales of Other Current Assets | $0 | $0 | $0 |
| Sales of Long-term Assets | $0 | $0 | $0 |
| New Investment Received | $0 | $0 | $0 |
| Subtotal Cash Received | $29,560 | $63,085 | $81,527 |
| Expenditures | Year 1 | Year 2 | Year 3 |
| Expenditures from Operations | |||
| Cash Spending | $15,000 | $30,000 | $37,000 |
| Bill Payments | $11,630 | $28,509 | $38,851 |
| Subtotal Spent on Operations | $26,630 | $58,509 | $75,851 |
| Additional Cash Spent | |||
| Sales Tax, VAT, HST/GST Paid Out | $0 | $0 | $0 |
| Principal Repayment of Current Borrowing | $0 | $0 | $0 |
| Other Liabilities Principal Repayment | $0 | $0 | $0 |
| Long-term Liabilities Principal Repayment | $0 | $0 | $0 |
| Purchase Other Current Assets | $0 | $0 | $0 |
| Purchase Long-term Assets | $0 | $0 | $0 |
| Dividends | $0 | $0 | $0 |
| Subtotal Cash Spent | $26,630 | $58,509 | $75,851 |
| Net Cash Flow | $2,929 | $4,575 | $5,676 |
| Cash Balance | $4,179 | $8,755 | $14,430 |
7.5 Projected Balance Sheet
The Balance Sheet table for fiscal years 2002, 2003, and 2004 follows. For a monthly analysis, please see the attached appendix.
| Pro Forma Balance Sheet | |||
| Year 1 | Year 2 | Year 3 | |
| Assets | |||
| Current Assets | |||
| Cash | $4,179 | $8,755 | $14,430 |
| Accounts Receivable | $2,805 | $5,721 | $7,194 |
| Other Current Assets | $400 | $400 | $400 |
| Total Current Assets | $7,385 | $14,875 | $22,024 |
| Long-term Assets | |||
| Long-term Assets | $2,000 | $2,000 | $2,000 |
| Accumulated Depreciation | $0 | $0 | $0 |
| Total Long-term Assets | $2,000 | $2,000 | $2,000 |
| Total Assets | $9,385 | $16,875 | $24,024 |
| Liabilities and Capital | Year 1 | Year 2 | Year 3 |
| Current Liabilities | |||
| Accounts Payable | $1,147 | $2,450 | $3,260 |
| Current Borrowing | $0 | $0 | $0 |
| Other Current Liabilities | $0 | $0 | $0 |
| Subtotal Current Liabilities | $1,147 | $2,450 | $3,260 |
| Long-term Liabilities | $0 | $0 | $0 |
| Total Liabilities | $1,147 | $2,450 | $3,260 |
| Paid-in Capital | $4,900 | $4,900 | $4,900 |
| Retained Earnings | ($1,250) | $3,337 | $9,525 |
| Earnings | $4,587 | $6,188 | $6,340 |
| Total Capital | $8,237 | $14,425 | $20,764 |
| Total Liabilities and Capital | $9,385 | $16,875 | $24,024 |
| Net Worth | $8,237 | $14,425 | $20,764 |
7.6 Business Ratios
The following table provides significant ratios for the personal services industry. The final column, Industry Profile, shows ratios for this industry as it is determined by the Standard Industrial Classification (SIC) Index 7299, “miscellaneous personal services.”
| Ratio Analysis | ||||
| Year 1 | Year 2 | Year 3 | Industry Profile | |
| Sales Growth | 0.00% | 103.92% | 25.76% | -8.50% |
| Percent of Total Assets | ||||
| Accounts Receivable | 29.89% | 33.90% | 29.95% | 6.70% |
| Other Current Assets | 4.26% | 2.37% | 1.66% | 26.40% |
| Total Current Assets | 78.69% | 88.15% | 91.68% | 43.50% |
| Long-term Assets | 21.31% | 11.85% | 8.32% | 56.50% |
| Total Assets | 100.00% | 100.00% | 100.00% | 100.00% |
| Current Liabilities | 12.23% | 14.52% | 13.57% | 19.50% |
| Long-term Liabilities | 0.00% | 0.00% | 0.00% | 21.40% |
| Total Liabilities | 12.23% | 14.52% | 13.57% | 40.90% |
| Net Worth | 87.77% | 85.48% | 86.43% | 59.10% |
| Percent of Sales | ||||
| Sales | 100.00% | 100.00% | 100.00% | 100.00% |
| Gross Margin | 65.24% | 57.95% | 54.82% | 50.80% |
| Selling, General & Administrative Expenses | 51.07% | 54.26% | 47.14% | 34.40% |
| Advertising Expenses | 0.00% | 0.00% | 0.00% | 0.20% |
| Profit Before Interest and Taxes | 18.89% | 12.50% | 10.24% | 1.50% |
| Main Ratios | ||||
| Current | 6.44 | 6.07 | 6.76 | 2.09 |
| Quick | 6.44 | 6.07 | 6.76 | 1.03 |
| Total Debt to Total Assets | 12.23% | 14.52% | 13.57% | 40.90% |
| Pre-tax Return on Net Worth | 74.24% | 57.19% | 40.94% | 1.10% |
| Pre-tax Return on Assets | 65.16% | 48.89% | 35.38% | 1.90% |
| Additional Ratios | Year 1 | Year 2 | Year 3 | |
| Net Profit Margin | 14.17% | 9.38% | 7.64% | n.a |
| Return on Equity | 55.69% | 42.90% | 30.53% | n.a |
| Activity Ratios | ||||
| Accounts Receivable Turnover | 5.19 | 5.19 | 5.19 | n.a |
| Collection Days | 57 | 52 | 63 | n.a |
| Accounts Payable Turnover | 11.14 | 12.17 | 12.17 | n.a |
| Payment Days | 27 | 22 | 26 | n.a |
| Total Asset Turnover | 3.45 | 3.91 | 3.45 | n.a |
| Debt Ratios | ||||
| Debt to Net Worth | 0.14 | 0.17 | 0.16 | n.a |
| Current Liab. to Liab. | 1.00 | 1.00 | 1.00 | n.a |
| Liquidity Ratios | ||||
| Net Working Capital | $6,237 | $12,425 | $18,764 | n.a |
| Interest Coverage | 0.00 | 0.00 | 0.00 | n.a |
| Additional Ratios | ||||
| Assets to Sales | 0.29 | 0.26 | 0.29 | n.a |
| Current Debt/Total Assets | 12% | 15% | 14% | n.a |
| Acid Test | 3.99 | 3.74 | 4.55 | n.a |
| Sales/Net Worth | 3.93 | 4.58 | 4.00 | n.a |
| Dividend Payout | 0.00 | 0.00 | 0.00 | n.a |
Appendix
| Sales Forecast | |||||||||||||
| Month 1 | Month 2 | Month 3 | Month 4 | Month 5 | Month 6 | Month 7 | Month 8 | Month 9 | Month 10 | Month 11 | Month 12 | ||
| Sales | |||||||||||||
| Jade Kousky – Owner | 0% | $2,168 | $2,181 | $2,290 | $2,404 | $2,524 | $2,650 | $2,703 | $2,891 | $3,092 | $3,123 | $3,154 | $3,185 |
| Retail Consultant 1 | 0% | $0 | $0 | $0 | $0 | $0 | $0 | $0 | $0 | $0 | $0 | $0 | $0 |
| Total Sales | $2,168 | $2,181 | $2,290 | $2,404 | $2,524 | $2,650 | $2,703 | $2,891 | $3,092 | $3,123 | $3,154 | $3,185 | |
| Direct Cost of Sales | Month 1 | Month 2 | Month 3 | Month 4 | Month 5 | Month 6 | Month 7 | Month 8 | Month 9 | Month 10 | Month 11 | Month 12 | |
| Jade Kousky – Owner | $938 | $938 | $938 | $938 | $938 | $938 | $938 | $938 | $938 | $938 | $938 | $938 | |
| Retail Consultant 1 | $0 | $0 | $0 | $0 | $0 | $0 | $0 | $0 | $0 | $0 | $0 | $0 | |
| Subtotal Direct Cost of Sales | $938 | $938 | $938 | $938 | $938 | $938 | $938 | $938 | $938 | $938 | $938 | $938 | |
| Personnel Plan | |||||||||||||
| Month 1 | Month 2 | Month 3 | Month 4 | Month 5 | Month 6 | Month 7 | Month 8 | Month 9 | Month 10 | Month 11 | Month 12 | ||
| Owner | 0% | $1,250 | $1,250 | $1,250 | $1,250 | $1,250 | $1,250 | $1,250 | $1,250 | $1,250 | $1,250 | $1,250 | $1,250 |
| Other | 0% | $0 | $0 | $0 | $0 | $0 | $0 | $0 | $0 | $0 | $0 | $0 | $0 |
| Total People | 0 | 0 | 0 | 0 | 0 | 0 | 0 | 0 | 0 | 0 | 0 | 0 | |
| Total Payroll | $1,250 | $1,250 | $1,250 | $1,250 | $1,250 | $1,250 | $1,250 | $1,250 | $1,250 | $1,250 | $1,250 | $1,250 | |
| General Assumptions | |||||||||||||
| Month 1 | Month 2 | Month 3 | Month 4 | Month 5 | Month 6 | Month 7 | Month 8 | Month 9 | Month 10 | Month 11 | Month 12 | ||
| Plan Month | 1 | 2 | 3 | 4 | 5 | 6 | 7 | 8 | 9 | 10 | 11 | 12 | |
| Current Interest Rate | 10.00% | 10.00% | 10.00% | 10.00% | 10.00% | 10.00% | 10.00% | 10.00% | 10.00% | 10.00% | 10.00% | 10.00% | |
| Long-term Interest Rate | 10.00% | 10.00% | 10.00% | 10.00% | 10.00% | 10.00% | 10.00% | 10.00% | 10.00% | 10.00% | 10.00% | 10.00% | |
| Tax Rate | 30.00% | 25.00% | 25.00% | 25.00% | 25.00% | 25.00% | 25.00% | 25.00% | 25.00% | 25.00% | 25.00% | 25.00% | |
| Other | 0 | 0 | 0 | 0 | 0 | 0 | 0 | 0 | 0 | 0 | 0 | 0 | |
| Pro Forma Profit and Loss | |||||||||||||
| Month 1 | Month 2 | Month 3 | Month 4 | Month 5 | Month 6 | Month 7 | Month 8 | Month 9 | Month 10 | Month 11 | Month 12 | ||
| Sales | $2,168 | $2,181 | $2,290 | $2,404 | $2,524 | $2,650 | $2,703 | $2,891 | $3,092 | $3,123 | $3,154 | $3,185 | |
| Direct Cost of Sales | $938 | $938 | $938 | $938 | $938 | $938 | $938 | $938 | $938 | $938 | $938 | $938 | |
| Other | $0 | $0 | $0 | $0 | $0 | $0 | $0 | $0 | $0 | $0 | $0 | $0 | |
| Total Cost of Sales | $938 | $938 | $938 | $938 | $938 | $938 | $938 | $938 | $938 | $938 | $938 | $938 | |
| Gross Margin | $1,231 | $1,244 | $1,353 | $1,467 | $1,587 | $1,713 | $1,766 | $1,954 | $2,155 | $2,186 | $2,217 | $2,248 | |
| Gross Margin % | 56.76% | 57.02% | 59.06% | 61.00% | 62.86% | 64.62% | 65.32% | 67.57% | 69.68% | 69.98% | 70.28% | 70.57% | |
| Expenses | |||||||||||||
| Payroll | $1,250 | $1,250 | $1,250 | $1,250 | $1,250 | $1,250 | $1,250 | $1,250 | $1,250 | $1,250 | $1,250 | $1,250 | |
| Sales and Marketing and Other Expenses | $0 | $0 | $0 | $0 | $0 | $0 | $0 | $0 | $0 | $0 | $0 | $0 | |
| Depreciation | $0 | $0 | $0 | $0 | $0 | $0 | $0 | $0 | $0 | $0 | $0 | $0 | |
| Leased Equipment | $0 | $0 | $0 | $0 | $0 | $0 | $0 | $0 | $0 | $0 | $0 | $0 | |
| Utilities | $0 | $0 | $0 | $0 | $0 | $0 | $0 | $0 | $0 | $0 | $0 | $0 | |
| Insurance | $0 | $0 | $0 | $0 | $0 | $0 | $0 | $0 | $0 | $0 | $0 | $0 | |
| Rent | $0 | $0 | $0 | $0 | $0 | $0 | $0 | $0 | $0 | $0 | $0 | $0 | |
| Payroll Taxes | 10% | $0 | $0 | $0 | $0 | $0 | $0 | $0 | $0 | $0 | $0 | $0 | $0 |
| Other | $0 | $0 | $0 | $0 | $0 | $0 | $0 | $0 | $0 | $0 | $0 | $0 | |
| Total Operating Expenses | $1,250 | $1,250 | $1,250 | $1,250 | $1,250 | $1,250 | $1,250 | $1,250 | $1,250 | $1,250 | $1,250 | $1,250 | |
| Profit Before Interest and Taxes | ($20) | ($7) | $103 | $217 | $337 | $463 | $516 | $704 | $905 | $936 | $967 | $998 | |
| EBITDA | ($20) | ($7) | $103 | $217 | $337 | $463 | $516 | $704 | $905 | $936 | $967 | $998 | |
| Interest Expense | $0 | $0 | $0 | $0 | $0 | $0 | $0 | $0 | $0 | $0 | $0 | $0 | |
| Taxes Incurred | ($6) | ($2) | $26 | $54 | $84 | $116 | $129 | $176 | $226 | $234 | $242 | $249 | |
| Net Profit | ($14) | ($5) | $77 | $162 | $252 | $347 | $387 | $528 | $678 | $702 | $725 | $748 | |
| Net Profit/Sales | -0.63% | -0.22% | 3.36% | 6.75% | 10.00% | 13.09% | 14.30% | 18.25% | 21.94% | 22.47% | 22.98% | 23.49% | |
| Pro Forma Cash Flow | |||||||||||||
| Month 1 | Month 2 | Month 3 | Month 4 | Month 5 | Month 6 | Month 7 | Month 8 | Month 9 | Month 10 | Month 11 | Month 12 | ||
| Cash Received | |||||||||||||
| Cash from Operations | |||||||||||||
| Cash Sales | $1,192 | $1,200 | $1,260 | $1,322 | $1,388 | $1,458 | $1,487 | $1,590 | $1,701 | $1,718 | $1,735 | $1,752 | |
| Cash from Receivables | $0 | $33 | $976 | $983 | $1,032 | $1,084 | $1,138 | $1,193 | $1,219 | $1,304 | $1,392 | $1,406 | |
| Subtotal Cash from Operations | $1,192 | $1,232 | $2,235 | $2,305 | $2,420 | $2,541 | $2,624 | $2,783 | $2,920 | $3,022 | $3,127 | $3,158 | |
| Additional Cash Received | |||||||||||||
| Sales Tax, VAT, HST/GST Received | 0.00% | $0 | $0 | $0 | $0 | $0 | $0 | $0 | $0 | $0 | $0 | $0 | $0 |
| New Current Borrowing | $0 | $0 | $0 | $0 | $0 | $0 | $0 | $0 | $0 | $0 | $0 | $0 | |
| New Other Liabilities (interest-free) | $0 | $0 | $0 | $0 | $0 | $0 | $0 | $0 | $0 | $0 | $0 | $0 | |
| New Long-term Liabilities | $0 | $0 | $0 | $0 | $0 | $0 | $0 | $0 | $0 | $0 | $0 | $0 | |
| Sales of Other Current Assets | $0 | $0 | $0 | $0 | $0 | $0 | $0 | $0 | $0 | $0 | $0 | $0 | |
| Sales of Long-term Assets | $0 | $0 | $0 | $0 | $0 | $0 | $0 | $0 | $0 | $0 | $0 | $0 | |
| New Investment Received | $0 | $0 | $0 | $0 | $0 | $0 | $0 | $0 | $0 | $0 | $0 | $0 | |
| Subtotal Cash Received | $1,192 | $1,232 | $2,235 | $2,305 | $2,420 | $2,541 | $2,624 | $2,783 | $2,920 | $3,022 | $3,127 | $3,158 | |
| Expenditures | Month 1 | Month 2 | Month 3 | Month 4 | Month 5 | Month 6 | Month 7 | Month 8 | Month 9 | Month 10 | Month 11 | Month 12 | |
| Expenditures from Operations | |||||||||||||
| Cash Spending | $1,250 | $1,250 | $1,250 | $1,250 | $1,250 | $1,250 | $1,250 | $1,250 | $1,250 | $1,250 | $1,250 | $1,250 | |
| Bill Payments | $31 | $932 | $937 | $964 | $993 | $1,023 | $1,054 | $1,068 | $1,115 | $1,164 | $1,172 | $1,179 | |
| Subtotal Spent on Operations | $1,281 | $2,182 | $2,187 | $2,214 | $2,243 | $2,273 | $2,304 | $2,318 | $2,365 | $2,414 | $2,422 | $2,429 | |
| Additional Cash Spent | |||||||||||||
| Sales Tax, VAT, HST/GST Paid Out | $0 | $0 | $0 | $0 | $0 | $0 | $0 | $0 | $0 | $0 | $0 | $0 | |
| Principal Repayment of Current Borrowing | $0 | $0 | $0 | $0 | $0 | $0 | $0 | $0 | $0 | $0 | $0 | $0 | |
| Other Liabilities Principal Repayment | $0 | $0 | $0 | $0 | $0 | $0 | $0 | $0 | $0 | $0 | $0 | $0 | |
| Long-term Liabilities Principal Repayment | $0 | $0 | $0 | $0 | $0 | $0 | $0 | $0 | $0 | $0 | $0 | $0 | |
| Purchase Other Current Assets | $0 | $0 | $0 | $0 | $0 | $0 | $0 | $0 | $0 | $0 | $0 | $0 | |
| Purchase Long-term Assets | $0 | $0 | $0 | $0 | $0 | $0 | $0 | $0 | $0 | $0 | $0 | $0 | |
| Dividends | $0 | $0 | $0 | $0 | $0 | $0 | $0 | $0 | $0 | $0 | $0 | $0 | |
| Subtotal Cash Spent | $1,281 | $2,182 | $2,187 | $2,214 | $2,243 | $2,273 | $2,304 | $2,318 | $2,365 | $2,414 | $2,422 | $2,429 | |
| Net Cash Flow | ($89) | ($950) | $49 | $91 | $178 | $268 | $321 | $465 | $555 | $608 | $705 | $728 | |
| Cash Balance | $1,161 | $212 | $260 | $351 | $529 | $798 | $1,118 | $1,584 | $2,138 | $2,746 | $3,451 | $4,179 | |
| Pro Forma Balance Sheet | |||||||||||||
| Month 1 | Month 2 | Month 3 | Month 4 | Month 5 | Month 6 | Month 7 | Month 8 | Month 9 | Month 10 | Month 11 | Month 12 | ||
| Assets | Starting Balances | ||||||||||||
| Current Assets | |||||||||||||
| Cash | $1,250 | $1,161 | $212 | $260 | $351 | $529 | $798 | $1,118 | $1,584 | $2,138 | $2,746 | $3,451 | $4,179 |
| Accounts Receivable | $0 | $976 | $1,925 | $1,979 | $2,078 | $2,182 | $2,290 | $2,369 | $2,477 | $2,649 | $2,750 | $2,778 | $2,805 |
| Other Current Assets | $400 | $400 | $400 | $400 | $400 | $400 | $400 | $400 | $400 | $400 | $400 | $400 | $400 |
| Total Current Assets | $1,650 | $2,537 | $2,536 | $2,639 | $2,829 | $3,111 | $3,488 | $3,887 | $4,460 | $5,187 | $5,897 | $6,629 | $7,385 |
| Long-term Assets | |||||||||||||
| Long-term Assets | $2,000 | $2,000 | $2,000 | $2,000 | $2,000 | $2,000 | $2,000 | $2,000 | $2,000 | $2,000 | $2,000 | $2,000 | $2,000 |
| Accumulated Depreciation | $0 | $0 | $0 | $0 | $0 | $0 | $0 | $0 | $0 | $0 | $0 | $0 | $0 |
| Total Long-term Assets | $2,000 | $2,000 | $2,000 | $2,000 | $2,000 | $2,000 | $2,000 | $2,000 | $2,000 | $2,000 | $2,000 | $2,000 | $2,000 |
| Total Assets | $3,650 | $4,537 | $4,536 | $4,639 | $4,829 | $5,111 | $5,488 | $5,887 | $6,460 | $7,187 | $7,897 | $8,629 | $9,385 |
| Liabilities and Capital | Month 1 | Month 2 | Month 3 | Month 4 | Month 5 | Month 6 | Month 7 | Month 8 | Month 9 | Month 10 | Month 11 | Month 12 | |
| Current Liabilities | |||||||||||||
| Accounts Payable | $0 | $901 | $905 | $931 | $959 | $988 | $1,018 | $1,031 | $1,076 | $1,125 | $1,132 | $1,140 | $1,147 |
| Current Borrowing | $0 | $0 | $0 | $0 | $0 | $0 | $0 | $0 | $0 | $0 | $0 | $0 | $0 |
| Other Current Liabilities | $0 | $0 | $0 | $0 | $0 | $0 | $0 | $0 | $0 | $0 | $0 | $0 | $0 |
| Subtotal Current Liabilities | $0 | $901 | $905 | $931 | $959 | $988 | $1,018 | $1,031 | $1,076 | $1,125 | $1,132 | $1,140 | $1,147 |
| Long-term Liabilities | $0 | $0 | $0 | $0 | $0 | $0 | $0 | $0 | $0 | $0 | $0 | $0 | $0 |
| Total Liabilities | $0 | $901 | $905 | $931 | $959 | $988 | $1,018 | $1,031 | $1,076 | $1,125 | $1,132 | $1,140 | $1,147 |
| Paid-in Capital | $4,900 | $4,900 | $4,900 | $4,900 | $4,900 | $4,900 | $4,900 | $4,900 | $4,900 | $4,900 | $4,900 | $4,900 | $4,900 |
| Retained Earnings | ($1,250) | ($1,250) | ($1,250) | ($1,250) | ($1,250) | ($1,250) | ($1,250) | ($1,250) | ($1,250) | ($1,250) | ($1,250) | ($1,250) | ($1,250) |
| Earnings | $0 | ($14) | ($19) | $58 | $221 | $473 | $820 | $1,207 | $1,734 | $2,413 | $3,114 | $3,839 | $4,587 |
| Total Capital | $3,650 | $3,636 | $3,631 | $3,708 | $3,871 | $4,123 | $4,470 | $4,857 | $5,384 | $6,063 | $6,764 | $7,489 | $8,237 |
| Total Liabilities and Capital | $3,650 | $4,537 | $4,536 | $4,639 | $4,829 | $5,111 | $5,488 | $5,887 | $6,460 | $7,187 | $7,897 | $8,629 | $9,385 |
| Net Worth | $3,650 | $3,636 | $3,631 | $3,708 | $3,871 | $4,123 | $4,470 | $4,857 | $5,384 | $6,063 | $6,764 | $7,489 | $8,237 |


