
Plynthe Insurance
Executive Summary
Plynthe Insurance will be an independent personal insurance brokerage located in Peristyle Gardens and serving the adult population of the town with insurance advice, a variety of policy types, and selection from any insurance provider available on the market. The business will be launched by Kolem Plynthe, a newly licensed insurance agent, as a home-based business and grown in future years to a small office where Plynthe can collaborate with associate agents. Plynthe’s track record as a salesperson positions him well for success in the insurance business.
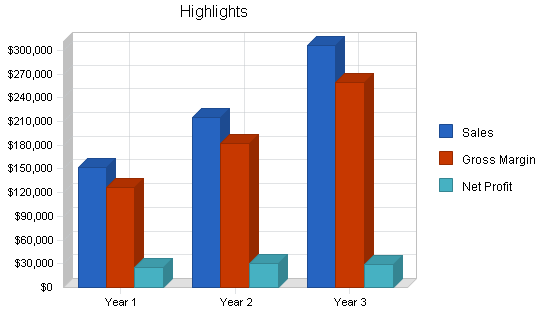
Plynthe Insurance stands to be a profitable business which will provide salary and dividends for Kolem Plynthe, its sole owner. Salary to Plynthe plus profits will increase moderately but steadily. The business can be launched without external investment or loans, relying only on Plynthe’s savings and personal borrowings. To finance expansion to an office, Plynthe Insurance will require a long-term loan taken out in its second year of operation.
Objectives
Plynthe Insurance will judge its success on meeting the following objectives:
- Build revenues quickly in the first year of operations.
- Rent an office and add an associate insurance agent in the second year of operations.
- Reach revenues double in third year of operations with a reasonable net profit.
Mission
The mission of Plynthe Insurance is to create a more protected community by offering property, casualty, and life insurance to residents of Peristyle Gardens from a wide range of insurance sources.
Keys to Success
To achieve its objectives, Plynthe Insurance will follow these principles:
- Remain independent of direct affiliate ties to any specific insurance providers
- Think of each client’s needs holistically to consider all the potential risks in their lives
- Maintain a reputation of care, fairness, empathy, and expertise
Company Summary
Plynthe Insurance is founded by Kolem Plynthe as a local, independent insurance agent providing personal insurance products to residents of Peristyle Gardens and its neighboring towns. The business will begin as a home-based business with Kolem Plynthe as the owner and only employee, and continue to grow through the establishment of a local office and the addition of associate agents to better serve the community. Kolem Plynthe is an experienced salesperson and newly certified insurance agent. The business will broker insurance purchases for property insurance (home & contents, valuable possessions, renter’s insurance), personal liability, and life insurance.
Company Ownership
Plynthe Insurance is founded and owned entirely by Kolem Plynthe. The business is currently incorporated as a sole proprietorship with a registered DBA, but will reincorporate as an LLC when there is a need to hire additional employees and open an office.
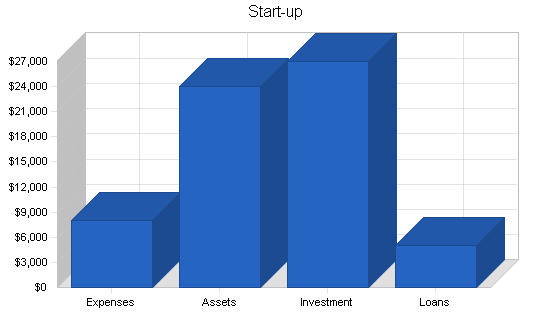
Start-up Summary
Plynthe Insurance requires very little in the way of start-up funding. Expenses include the licenses for Kolem Plynthe and the business, business insurance, stationery (business cards and brochures), and a basic website. Rent will not be required at the outset as Kolem Plynthe will operate out of a home office. Most of the start-up funding is required to cover operating expenses until break even is achieved halfway through the first year of operation.
| Start-up | |
| Requirements | |
| Start-up Expenses | |
| Legal (license and permits) | $2,000 |
| Stationery | $2,000 |
| Insurance | $1,000 |
| Rent | $0 |
| Computer | $2,000 |
| Website | $1,000 |
| Total Start-up Expenses | $8,000 |
| Start-up Assets | |
| Cash Required | $24,000 |
| Other Current Assets | $0 |
| Long-term Assets | $0 |
| Total Assets | $24,000 |
| Total Requirements | $32,000 |
Services
Plynthe Insurance will offer the following personal insurance products:
1. Home and Contents:
- Homeowner’s Insurance
- Condo Insurance
- Cooperative Insurance
- Renter’s Insurance
- Seasonal and Secondary Locations
- Flood Insurance
2. Valuable Items:
- Jewelry
- Fine Art
- Silver
- Furs
- Other Collectible Items
3. Personal Liability
4. Life Insurance
- Term Life
- Variable Life
- Whole Life
- Second-to-Die
5. Long-term Care
6. Long-term Disability
All of these products will be offered to individuals and not businesses. The insurance products will be provided by any of the major insurance providers in existence, with attention paid to smaller providers who offer specialized insurance products.
While offering these products, Plynthe Insurance will provide the following services:
- Consult with clients on their insurance needs to determine a course of action
- Assist existing clients with insurance claims and understanding their insurance policy
- Referring clients to additional providers who can reduce their risk (locksmiths, security professionals, etc.)
Market Analysis Summary
The market for personal insurance consists of all adult individuals, potentially, as there are products available which are appropriate for every type of person from the moment they leave their parents’ home to the day they die. Therefore, the market for an insurance agent selling personal insurance in Peristyle Gardens is synonymous with the adult population of Peristyle Gardens. In 2008, the population of adults (18 and older) in the town was estimated at 57,500. The town has an overall annual growth rate of 2% due to new developments in the town and an aging population with ever-increasing life expectancies.
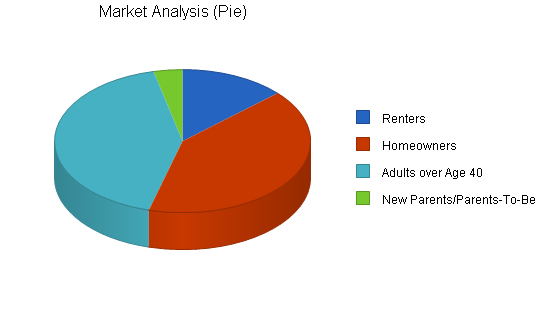
Within this target market, the market segments on which Plynthe Insurance will focus include renters, homeowners, individuals over 40 years of age, and new parents/parents-to-be.
Market Segmentation
The market segments described include a great deal of overlap. For example, many adults over the age of 40 are also homeowners and the remainder are renters. The new parent segment are also either homeowners or renters, generally. Each segment has different needs for insurance products, however, and those who fall into more than one segment have a need for more than one product.
| Market Analysis | |||||||
| Year 1 | Year 2 | Year 3 | Year 4 | Year 5 | |||
| Potential Customers | Growth | CAGR | |||||
| Renters | 2% | 11,000 | 11,220 | 11,444 | 11,673 | 11,906 | 2.00% |
| Homeowners | 1% | 34,000 | 34,340 | 34,683 | 35,030 | 35,380 | 1.00% |
| Adults over Age 40 | 3% | 35,000 | 36,050 | 37,132 | 38,246 | 39,393 | 3.00% |
| New Parents/Parents-To-Be | 2% | 3,000 | 3,060 | 3,121 | 3,183 | 3,247 | 2.00% |
| Total | 2.02% | 83,000 | 84,670 | 86,380 | 88,132 | 89,926 | 2.02% |
Target Market Segment Strategy
Plynthe Insurance will focus its initial marketing on those at the younger end of the spectrum, including renters and new parents/parents-to-be. The strategy will be to begin by selling renter’s insurance and life insurance to clients and then earn their ongoing trust in order to sell additional insurance policies to them as new needs arise. Younger clients will also serve as a longer annuity as insurance policies are renewed year after year.
As these clients increase in age they will have growing needs for homeowner’s insurance, valuable items insurance, life insurance, and, eventually, long-term care and long-term disability.
Service Business Analysis
The United States Department of Labor offers the following summary of the insurance industry:
Most people have their first contact with an insurance company through an insurance sales agent. These workers help individuals, families, and businesses select insurance policies that provide the best protection for their lives, health, and property.
Insurance sales agents, commonly referred to as “producers” in the insurance industry, sell one or more types of insurance, such as property and casualty, life, health, disability, and long-term care. Property and casualty insurance agents sell policies that protect individuals and businesses from financial loss resulting from automobile accidents, fire, theft, storms, and other events that can damage property. For businesses, property and casualty insurance can also cover injured workers’ compensation, product liability claims, or medical malpractice claims.
Life insurance agents specialize in selling policies that pay beneficiaries when a policyholder dies. Depending on the policyholder’s circumstances, a cash-value policy can be designed to provide retirement income, funds for the education of children, or other benefits as well. Life insurance agents also sell annuities that promise a retirement income. Health insurance agents sell health insurance policies that cover the costs of medical care and loss of income due to illness or injury. They also may sell dental insurance and short-term and long-term-disability insurance policies. Agents may specialize in any one of these product areas, or function as generalists, providing multiple products to a single customer.

An increasing number of insurance sales agents are offering comprehensive financial planning services to their clients. These services include retirement planning, estate planning, and assistance in setting up pension plans for businesses. As a result, many insurance agents are involved in “cross-selling” or “total account development”. Besides offering insurance, these agents may become licensed to sell mutual funds, variable annuities, and other securities. This practice is most common with life insurance agents who already sell annuities, but many property and casualty agents also sell financial products.
Insurance sales agents also prepare reports, maintain records, and seek out new clients. In the event that policy holders experience a loss, agents help them settle their insurance claims. Increasingly, some agents are also offering their clients financial analysis or advice on how to minimize risk.
Insurance sales agents working exclusively for one insurance company are referred to as captive agents. Independent insurance agents, or brokers, represent several companies and match insurance policies for their clients with the company that offers the best rate and coverage.
Technology has greatly affected the insurance business, making it much more efficient and giving the agent the ability to take on more clients. Agents’ computers are now linked directly to insurance carriers via the Internet, making the tasks of obtaining price quotes and processing applications and service requests faster and easier. Computers also allow agents to be better informed about new products that the insurance carriers may be offering.
The growing use of the Internet in the insurance industry has altered the relationship between agent and client. Agents formerly used to devote much of their time to marketing and selling products to new clients. Now, clients are increasingly obtaining insurance quotes from a company’s Web site and then contacting the company directly to purchase policies. This interaction gives the client a more active role in selecting their policy, while reducing the amount of time agents spend actively seeking new clients. Insurance sales agents also obtain many new accounts through referrals, so it is important that they maintain regular contact with their clients to ensure that the clients’ financial needs are being met. Developing a satisfied clientele that will recommend an agent’s services to other potential customers is a key to success for agents.
The Department of Labor reports that there were 436,000 insurance sales agents in 2006 and that approximately 50% of them were independent agents or worked for brokerages. Urban areas tend to have a greater concentration of insurance agents. Peristyle Gardens has approximately 28 insurance agents (or roughly 1 for every 2,000 residents). However, these agents do not all offer the same products as Plynthe Insurance.
Competition and Buying Patterns
Customers seek insurance through one or more of the following:
- Referrals from trusted friends, family, and colleagues
- Brand names of national companies (Allstate, State Farm, Geico, Progressive, etc.)
- Local office location
The greater the insurance need of an individual, the more likely they are to seek a local office where they can meet with an agent and discuss their needs in person. For the target markets of renters and new parents/parents-to-be in Peristyle Gardens, the primary competition will come from national insurance carriers rather than other independent agents.
Strategy and Implementation Summary
To implement its launch in Peristyle Gardens, Plynthe Insurance intends to target clients on the younger side of the total potential market in order to build up a client base for long-term service. This is also a target market that is ignored by other local independent insurance agents, making it easier to establish a foothold in the market this way. This implementation will include:
- Advertising to new parents/parents-to-be (in need of life insurance) and renters (in need of renters insurance)
- Sell additional insurance policies to these clients as the years go on
- Maintain a high policy renewal rate and high client retention rate through excellent service
Competitive Edge
Plynthe Insurance will establish its competitive edge through a single-minded focus on personal insurance. By being and staying an expert on personal insurance products and providers, Plynthe Insurance will be a one-stop-shop for individuals looking to minimize the risks in their lives for themselves and for their families. To maintain this expertise, Plynthe Insurance will devote time and energy to training and course work, and will subscribe to trade periodicals and newsletters. Plynthe Insurance will also spend time learning about the specific risks and problems associated with Peristyle Gardens in order to better serve its residents.
Marketing Strategy
The marketing strategy for Plynthe Insurance involves an initial focus on the target markets chosen, new parents/parents-to-be and renters. Renters require renter’s insurance and valuable items insurance. It is often the first time they will have purchased insurance in their lives. New parents require life insurance to protect their family and their children. Both groups may only purchase policies with small premiums at the moment, but their loyalty will turn into an annuity of renewals and opportunities to sell additional policies as they age.
To reach these target markets, Plynthe Insurance will engage in the following tactics:
- Advertising in Peristyle Gardens parent newsletters
- Posting flyers at apartment buildings
- Direct mail to apartment tenants and inclusion in books of coupons/flyers provided to new tenants
- Creating a basic website
- Search engine marketing: Bidding for keywords about renter’s and life insurance locally to come up in search results
- Yellow Pages listing
Sales Strategy
The sales strategy of Plynthe Insurance will be an aggressive one based on profiling and targeting individuals in the initial target market. Kolem Plynthe will have initial phone conversations with clients and then meet them at their home or office to discuss further. He will bring his laptop with him to all sales calls to search for insurance options for clients on the spot whenever possible.
Potential, actual, and past clients will all be managed through a CRM database in salesforce.com which will contain contact information and data on the relationship, and will generate reminders for follow-ups and next steps automatically.
Kolem Plynthe will encourage referrals through his interactions with clients by asking them directly and by offering gifts to those who refer clients.
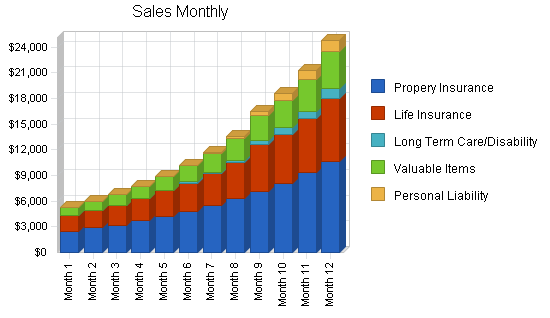
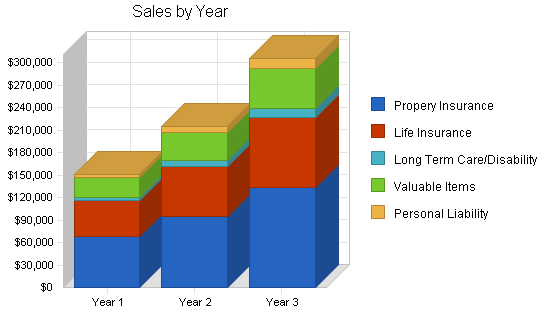
Sales Forecast
Property insurance and life insurance will be the main drivers of business. Customers who use other products will typically be customers who have first purchased property or life insurance. Cost of sales is low as the revenues earned come directly from the insurance providers generally as a commission on the policies sold and renewed. The commissions will range between 4% and 7% depending on the insurance provider, but Plynthe estimates an average of a 5% commission on policies sold, leading to the per unit commissions listed in the forecast. Cost of sales consist of the fees involved with submitting and processing a client’s paperwork and the costs of travel (gasoline/tolls) that can be directly attributed to sales calls at client homes and is estimated to start at 16% of sales in the first year and to drop to 15% in future years as travel costs can be saved due to the volume of sales calls being made as well as some clients who do not need sales visits due to renewals.
By building business through Kolem Plynthe’s own sales work and then through an additional associate, the business is expected to significantly grow its revenue streams, especially in the target market of younger clients, in these first three years of operation.
| Sales Forecast | |||
| Year 1 | Year 2 | Year 3 | |
| Unit Sales | |||
| Propery Insurance | 682 | 955 | 1,336 |
| Life Insurance | 318 | 445 | 624 |
| Long Term Care/Disability | 26 | 46 | 80 |
| Valuable Items | 363 | 509 | 712 |
| Personal Liability | 57 | 100 | 175 |
| Total Unit Sales | 1,446 | 2,055 | 2,927 |
| Unit Prices | Year 1 | Year 2 | Year 3 |
| Propery Insurance | $100.00 | $100.00 | $100.00 |
| Life Insurance | $150.00 | $150.00 | $150.00 |
| Long Term Care/Disability | $150.00 | $150.00 | $150.00 |
| Valuable Items | $75.00 | $75.00 | $75.00 |
| Personal Liability | $75.00 | $75.00 | $75.00 |
| Sales | |||
| Propery Insurance | $68,200 | $95,500 | $133,600 |
| Life Insurance | $47,700 | $66,750 | $93,600 |
| Long Term Care/Disability | $3,900 | $6,900 | $12,000 |
| Valuable Items | $27,225 | $38,175 | $53,400 |
| Personal Liability | $4,275 | $7,500 | $13,125 |
| Total Sales | $151,300 | $214,825 | $305,725 |
| Direct Unit Costs | Year 1 | Year 2 | Year 3 |
| Propery Insurance | $16.00 | $15.00 | $15.00 |
| Life Insurance | $24.00 | $22.50 | $22.50 |
| Long Term Care/Disability | $24.00 | $22.50 | $22.50 |
| Valuable Items | $12.00 | $11.25 | $11.25 |
| Personal Liability | $12.00 | $11.25 | $11.25 |
| Direct Cost of Sales | |||
| Propery Insurance | $10,912 | $14,325 | $20,040 |
| Life Insurance | $7,632 | $10,013 | $14,040 |
| Long Term Care/Disability | $624 | $1,035 | $1,800 |
| Valuable Items | $4,356 | $5,726 | $8,010 |
| Personal Liability | $684 | $1,125 | $1,969 |
| Subtotal Direct Cost of Sales | $24,208 | $32,224 | $45,859 |
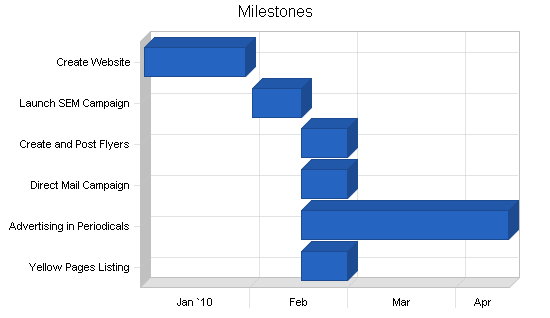
Milestones
The marketing activities listed in the Milestones Table are all intended to be low cost methods to establish an initial client base. They are intended as one-time activities with the exception of search engine marketing which will continue with a dedicated budget of $500 per month and advertising in parent periodicals which may continue with $500 per month devoted to it after the launch.
| Milestones | |||||
| Milestone | Start Date | End Date | Budget | Manager | Department |
| Create Website | 1/1/2010 | 1/30/2010 | $1,000 | KP | Owner |
| Launch SEM Campaign | 2/1/2010 | 2/15/2010 | $500 | KP | Owner |
| Create and Post Flyers | 2/15/2010 | 2/28/2010 | $500 | KP | Owner |
| Direct Mail Campaign | 2/15/2010 | 2/28/2010 | $1,000 | KP | Owner |
| Advertising in Periodicals | 2/15/2010 | 4/15/2010 | $500 | KP | Owner |
| Yellow Pages Listing | 2/15/2010 | 2/28/2010 | $100 | KP | Owner |
| Totals | $3,600 | ||||
Management Summary
Kolem Plynthe will be the only employee of Plynthe Insurance in its first year. He will continue to direct the company going forward and will bring on an associate agent in the second year of operation. This agent will prospect, sell, and fulfill policy requests for clients and will answer questions of clients just as Kolem Plynthe will. However, Plynthe will manage the marketing and finances of the firm and will set guidelines for training and education which the associate agent must follow.
Personnel Plan
Kolem Plynthe will escalate his salary as the year goes forward. Although the business is currently a sole proprietorship, his salary is recorded to better illustrate the tax burden he will face. The associate agent will be compensated with a base salary, a 5% commission on sales, and a percentage of net profits which will increase based on performance. The associate agent will have an initial salary of $50,000 per year, but will be hired part way into the second year of operation.
Training for the associate agent (and future associate agents) will begin with direct, on the job training by Kolem Plynthe on sales calls. Ongoing training will include required course work to maintain certification as well as additional events in the community, conferences, and reading material.
| Personnel Plan | |||
| Year 1 | Year 2 | Year 3 | |
| Kolem Plynthe | $49,000 | $50,000 | $75,000 |
| Associate Agent | $0 | $35,000 | $75,000 |
| Total People | 1 | 2 | 2 |
| Total Payroll | $49,000 | $85,000 | $150,000 |
Financial Plan
The business will finance its growth from a combination of the free cash flows generated by the business and a loan taken out in the second year to finance the move to a small office space in Peristyle Gardens. Beyond the first three years, growth will be possible by adding more agents and moving to a larger office space when the initial space is no longer adequate (when a third associate must be added).
The business is not well positioned for a sale as it will be built on the expertise of Kolem Plynthe. However, profits may become extensive when the appropriate scale is achieved and the business can expand to additional personal insurance products or financial advisory services.
Start-up Funding
Plynthe Insurance will be launched with Kolem Plynthe’s own resources, including credit card debt, personal savings, and some credit extended by vendors providing start-up services.
| Start-up Funding | |
| Start-up Expenses to Fund | $8,000 |
| Start-up Assets to Fund | $24,000 |
| Total Funding Required | $32,000 |
| Assets | |
| Non-cash Assets from Start-up | $0 |
| Cash Requirements from Start-up | $24,000 |
| Additional Cash Raised | $0 |
| Cash Balance on Starting Date | $24,000 |
| Total Assets | $24,000 |
| Liabilities and Capital | |
| Liabilities | |
| Current Borrowing | $4,000 |
| Long-term Liabilities | $0 |
| Accounts Payable (Outstanding Bills) | $1,000 |
| Other Current Liabilities (interest-free) | $0 |
| Total Liabilities | $5,000 |
| Capital | |
| Planned Investment | |
| Owner | $27,000 |
| Investor | $0 |
| Additional Investment Requirement | $0 |
| Total Planned Investment | $27,000 |
| Loss at Start-up (Start-up Expenses) | ($8,000) |
| Total Capital | $19,000 |
| Total Capital and Liabilities | $24,000 |
| Total Funding | $32,000 |
Important Assumptions
This plan assumes the following:
- That younger residents of Peristyle Gardens will value the personal attention (coupled by the lure of the best priced insurance) offered by Plynthe Insurance rather than go straight to brand name carriers
- That enough young residents will remain in Peristyle Gardens (move from renting to owning) and grow families to make the focus on young residents worthwhile in the long run
Break-even Analysis
As shown below a low monthly break even point leads to break even from a profit perspective in the nineth month of operation.

| Break-even Analysis | |
| Monthly Units Break-even | 86 |
| Monthly Revenue Break-even | $8,983 |
| Assumptions: | |
| Average Per-Unit Revenue | $104.63 |
| Average Per-Unit Variable Cost | $16.74 |
| Estimated Monthly Fixed Cost | $7,546 |
Projected Profit and Loss
Net profit will be on top of a healthy salary for Kolem Plynthe, showing that the business will be well worth the small initial investment to launch. Gross margins are very high (as is standard for the insurance brokerage industry) and overhead is rather low. The main costs will be payroll for the insurance agents. Lower salaries can be paid in the future for new associate agents as less experienced, but malleable, agents are brought into the business.


| Pro Forma Profit and Loss | |||
| Year 1 | Year 2 | Year 3 | |
| Sales | $151,300 | $214,825 | $305,725 |
| Direct Cost of Sales | $24,208 | $32,224 | $45,859 |
| Other Costs of Sales | $0 | $0 | $0 |
| Total Cost of Sales | $24,208 | $32,224 | $45,859 |
| Gross Margin | $127,092 | $182,601 | $259,866 |
| Gross Margin % | 84.00% | 85.00% | 85.00% |
| Expenses | |||
| Payroll | $49,000 | $85,000 | $150,000 |
| Marketing/Promotion | $24,000 | $15,000 | $15,000 |
| Depreciation | $0 | $5,000 | $5,000 |
| Rent | $2,400 | $12,000 | $12,600 |
| Utilities | $600 | $1,800 | $1,890 |
| Insurance | $2,400 | $3,000 | $3,500 |
| Payroll Taxes | $7,350 | $12,750 | $22,500 |
| Education | $4,800 | $5,000 | $7,500 |
| Total Operating Expenses | $90,550 | $139,550 | $217,990 |
| Profit Before Interest and Taxes | $36,542 | $43,051 | $41,876 |
| EBITDA | $36,542 | $48,051 | $46,876 |
| Interest Expense | $327 | $350 | $550 |
| Taxes Incurred | $10,864 | $12,810 | $12,398 |
| Net Profit | $25,350 | $29,891 | $28,928 |
| Net Profit/Sales | 16.75% | 13.91% | 9.46% |
Projected Cash Flow
The projected cash flow shows the business investing in additional assets (furniture, computers, equipment) in the second year and third year to equip the office. While the cash balance of the business is low, the salary paid to Kolem Plynthe will act as a safety valve and can be reduced if the cash is not currently available.

| Pro Forma Cash Flow | |||
| Year 1 | Year 2 | Year 3 | |
| Cash Received | |||
| Cash from Operations | |||
| Cash Sales | $0 | $0 | $0 |
| Cash from Receivables | $105,935 | $195,778 | $278,470 |
| Subtotal Cash from Operations | $105,935 | $195,778 | $278,470 |
| Additional Cash Received | |||
| Sales Tax, VAT, HST/GST Received | $0 | $0 | $0 |
| New Current Borrowing | $0 | $0 | $0 |
| New Other Liabilities (interest-free) | $0 | $0 | $0 |
| New Long-term Liabilities | $0 | $10,000 | $0 |
| Sales of Other Current Assets | $0 | $0 | $0 |
| Sales of Long-term Assets | $0 | $0 | $0 |
| New Investment Received | $0 | $0 | $0 |
| Subtotal Cash Received | $105,935 | $205,778 | $278,470 |
| Expenditures | Year 1 | Year 2 | Year 3 |
| Expenditures from Operations | |||
| Cash Spending | $49,000 | $85,000 | $150,000 |
| Bill Payments | $67,097 | $97,984 | $119,589 |
| Subtotal Spent on Operations | $116,097 | $182,984 | $269,589 |
| Additional Cash Spent | |||
| Sales Tax, VAT, HST/GST Paid Out | $0 | $0 | $0 |
| Principal Repayment of Current Borrowing | $4,000 | $0 | $0 |
| Other Liabilities Principal Repayment | $0 | $0 | $0 |
| Long-term Liabilities Principal Repayment | $0 | $3,000 | $3,000 |
| Purchase Other Current Assets | $0 | $5,000 | $5,000 |
| Purchase Long-term Assets | $0 | $15,000 | $5,000 |
| Dividends | $0 | $0 | $0 |
| Subtotal Cash Spent | $120,097 | $205,984 | $282,589 |
| Net Cash Flow | ($14,162) | ($206) | ($4,119) |
| Cash Balance | $9,838 | $9,632 | $5,513 |
Projected Balance Sheet
The balance sheet reflects that assets will not need to be purchased until the second year when the business moves from the home office of Kolem Plynthe to a small commercial office space in Peristyle Gardens.
| Pro Forma Balance Sheet | |||
| Year 1 | Year 2 | Year 3 | |
| Assets | |||
| Current Assets | |||
| Cash | $9,838 | $9,632 | $5,513 |
| Accounts Receivable | $45,365 | $64,412 | $91,667 |
| Other Current Assets | $0 | $5,000 | $10,000 |
| Total Current Assets | $55,203 | $79,044 | $107,180 |
| Long-term Assets | |||
| Long-term Assets | $0 | $15,000 | $20,000 |
| Accumulated Depreciation | $0 | $5,000 | $10,000 |
| Total Long-term Assets | $0 | $10,000 | $10,000 |
| Total Assets | $55,203 | $89,044 | $117,180 |
| Liabilities and Capital | Year 1 | Year 2 | Year 3 |
| Current Liabilities | |||
| Accounts Payable | $10,853 | $7,803 | $10,011 |
| Current Borrowing | $0 | $0 | $0 |
| Other Current Liabilities | $0 | $0 | $0 |
| Subtotal Current Liabilities | $10,853 | $7,803 | $10,011 |
| Long-term Liabilities | $0 | $7,000 | $4,000 |
| Total Liabilities | $10,853 | $14,803 | $14,011 |
| Paid-in Capital | $27,000 | $27,000 | $27,000 |
| Retained Earnings | ($8,000) | $17,350 | $47,241 |
| Earnings | $25,350 | $29,891 | $28,928 |
| Total Capital | $44,350 | $74,241 | $103,169 |
| Total Liabilities and Capital | $55,203 | $89,044 | $117,180 |
| Net Worth | $44,350 | $74,241 | $103,169 |
Business Ratios
The business rations for Plynthe Insurance are compared here against insurance agencies and brokerages (NAISC industry code 534210, SIC code 6411) of under $500,000 annual revenue. The accounts receivable ratio for the business is higher than the industry average as all accounts will be paid out of commissions from insurance providers after the policies have been processed and bills put through their systems. Also, the fact that the industry average S G & A expense and Advertising expense is much lower (as a percentage of sales) than that of Plynthe Insurance shows that the business can grow to a much greater scale, spreading its current relatively fixed costs over more agents and becoming more profitable in the process. As the business grows, this will be possible.
| Ratio Analysis | ||||
| Year 1 | Year 2 | Year 3 | Industry Profile | |
| Sales Growth | n.a. | 41.99% | 42.31% | 1.02% |
| Percent of Total Assets | ||||
| Accounts Receivable | 82.18% | 72.34% | 78.23% | 8.34% |
| Other Current Assets | 0.00% | 5.62% | 8.53% | 76.12% |
| Total Current Assets | 100.00% | 88.77% | 91.47% | 84.46% |
| Long-term Assets | 0.00% | 11.23% | 8.53% | 15.54% |
| Total Assets | 100.00% | 100.00% | 100.00% | 100.00% |
| Current Liabilities | 19.66% | 8.76% | 8.54% | 38.87% |
| Long-term Liabilities | 0.00% | 7.86% | 3.41% | 30.80% |
| Total Liabilities | 19.66% | 16.62% | 11.96% | 69.67% |
| Net Worth | 80.34% | 83.38% | 88.04% | 30.33% |
| Percent of Sales | ||||
| Sales | 100.00% | 100.00% | 100.00% | 100.00% |
| Gross Margin | 84.00% | 85.00% | 85.00% | 85.97% |
| Selling, General & Administrative Expenses | 67.25% | 71.09% | 75.54% | 38.55% |
| Advertising Expenses | 15.86% | 6.98% | 4.91% | 1.64% |
| Profit Before Interest and Taxes | 24.15% | 20.04% | 13.70% | 17.53% |
| Main Ratios | ||||
| Current | 5.09 | 10.13 | 10.71 | 1.27 |
| Quick | 5.09 | 10.13 | 10.71 | 1.27 |
| Total Debt to Total Assets | 19.66% | 16.62% | 11.96% | 69.67% |
| Pre-tax Return on Net Worth | 81.66% | 57.52% | 40.06% | 260.25% |
| Pre-tax Return on Assets | 65.60% | 47.96% | 35.27% | 78.92% |
| Additional Ratios | Year 1 | Year 2 | Year 3 | |
| Net Profit Margin | 16.75% | 13.91% | 9.46% | n.a |
| Return on Equity | 57.16% | 40.26% | 28.04% | n.a |
| Activity Ratios | ||||
| Accounts Receivable Turnover | 3.34 | 3.34 | 3.34 | n.a |
| Collection Days | 55 | 93 | 93 | n.a |
| Accounts Payable Turnover | 7.09 | 12.17 | 12.17 | n.a |
| Payment Days | 28 | 36 | 27 | n.a |
| Total Asset Turnover | 2.74 | 2.41 | 2.61 | n.a |
| Debt Ratios | ||||
| Debt to Net Worth | 0.24 | 0.20 | 0.14 | n.a |
| Current Liab. to Liab. | 1.00 | 0.53 | 0.71 | n.a |
| Liquidity Ratios | ||||
| Net Working Capital | $44,350 | $71,241 | $97,169 | n.a |
| Interest Coverage | 111.60 | 123.00 | 76.14 | n.a |
| Additional Ratios | ||||
| Assets to Sales | 0.36 | 0.41 | 0.38 | n.a |
| Current Debt/Total Assets | 20% | 9% | 9% | n.a |
| Acid Test | 0.91 | 1.88 | 1.55 | n.a |
| Sales/Net Worth | 3.41 | 2.89 | 2.96 | n.a |
| Dividend Payout | 0.00 | 0.00 | 0.00 | n.a |
Appendix
| Sales Forecast | |||||||||||||
| Month 1 | Month 2 | Month 3 | Month 4 | Month 5 | Month 6 | Month 7 | Month 8 | Month 9 | Month 10 | Month 11 | Month 12 | ||
| Unit Sales | |||||||||||||
| Propery Insurance | 25 | 29 | 32 | 37 | 42 | 48 | 55 | 63 | 71 | 81 | 93 | 106 | |
| Life Insurance | 12 | 13 | 15 | 17 | 20 | 22 | 25 | 28 | 37 | 38 | 42 | 49 | |
| Long Term Care/Disability | 0 | 0 | 0 | 0 | 0 | 1 | 1 | 2 | 3 | 5 | 6 | 8 | |
| Valuable Items | 13 | 15 | 17 | 20 | 23 | 26 | 29 | 33 | 38 | 43 | 49 | 57 | |
| Personal Liability | 0 | 0 | 0 | 0 | 0 | 0 | 2 | 4 | 7 | 11 | 15 | 18 | |
| Total Unit Sales | 50 | 57 | 64 | 74 | 85 | 97 | 112 | 130 | 156 | 178 | 205 | 238 | |
| Unit Prices | Month 1 | Month 2 | Month 3 | Month 4 | Month 5 | Month 6 | Month 7 | Month 8 | Month 9 | Month 10 | Month 11 | Month 12 | |
| Propery Insurance | $100.00 | $100.00 | $100.00 | $100.00 | $100.00 | $100.00 | $100.00 | $100.00 | $100.00 | $100.00 | $100.00 | $100.00 | |
| Life Insurance | $150.00 | $150.00 | $150.00 | $150.00 | $150.00 | $150.00 | $150.00 | $150.00 | $150.00 | $150.00 | $150.00 | $150.00 | |
| Long Term Care/Disability | $150.00 | $150.00 | $150.00 | $150.00 | $150.00 | $150.00 | $150.00 | $150.00 | $150.00 | $150.00 | $150.00 | $150.00 | |
| Valuable Items | $75.00 | $75.00 | $75.00 | $75.00 | $75.00 | $75.00 | $75.00 | $75.00 | $75.00 | $75.00 | $75.00 | $75.00 | |
| Personal Liability | $75.00 | $75.00 | $75.00 | $75.00 | $75.00 | $75.00 | $75.00 | $75.00 | $75.00 | $75.00 | $75.00 | $75.00 | |
| Sales | |||||||||||||
| Propery Insurance | $2,500 | $2,900 | $3,200 | $3,700 | $4,200 | $4,800 | $5,500 | $6,300 | $7,100 | $8,100 | $9,300 | $10,600 | |
| Life Insurance | $1,800 | $1,950 | $2,250 | $2,550 | $3,000 | $3,300 | $3,750 | $4,200 | $5,550 | $5,700 | $6,300 | $7,350 | |
| Long Term Care/Disability | $0 | $0 | $0 | $0 | $0 | $150 | $150 | $300 | $450 | $750 | $900 | $1,200 | |
| Valuable Items | $975 | $1,125 | $1,275 | $1,500 | $1,725 | $1,950 | $2,175 | $2,475 | $2,850 | $3,225 | $3,675 | $4,275 | |
| Personal Liability | $0 | $0 | $0 | $0 | $0 | $0 | $150 | $300 | $525 | $825 | $1,125 | $1,350 | |
| Total Sales | $5,275 | $5,975 | $6,725 | $7,750 | $8,925 | $10,200 | $11,725 | $13,575 | $16,475 | $18,600 | $21,300 | $24,775 | |
| Direct Unit Costs | Month 1 | Month 2 | Month 3 | Month 4 | Month 5 | Month 6 | Month 7 | Month 8 | Month 9 | Month 10 | Month 11 | Month 12 | |
| Propery Insurance | 16.00% | $16.00 | $16.00 | $16.00 | $16.00 | $16.00 | $16.00 | $16.00 | $16.00 | $16.00 | $16.00 | $16.00 | $16.00 |
| Life Insurance | 16.00% | $24.00 | $24.00 | $24.00 | $24.00 | $24.00 | $24.00 | $24.00 | $24.00 | $24.00 | $24.00 | $24.00 | $24.00 |
| Long Term Care/Disability | 16.00% | $24.00 | $24.00 | $24.00 | $24.00 | $24.00 | $24.00 | $24.00 | $24.00 | $24.00 | $24.00 | $24.00 | $24.00 |
| Valuable Items | 16.00% | $12.00 | $12.00 | $12.00 | $12.00 | $12.00 | $12.00 | $12.00 | $12.00 | $12.00 | $12.00 | $12.00 | $12.00 |
| Personal Liability | 16.00% | $12.00 | $12.00 | $12.00 | $12.00 | $12.00 | $12.00 | $12.00 | $12.00 | $12.00 | $12.00 | $12.00 | $12.00 |
| Direct Cost of Sales | |||||||||||||
| Propery Insurance | $400 | $464 | $512 | $592 | $672 | $768 | $880 | $1,008 | $1,136 | $1,296 | $1,488 | $1,696 | |
| Life Insurance | $288 | $312 | $360 | $408 | $480 | $528 | $600 | $672 | $888 | $912 | $1,008 | $1,176 | |
| Long Term Care/Disability | $0 | $0 | $0 | $0 | $0 | $24 | $24 | $48 | $72 | $120 | $144 | $192 | |
| Valuable Items | $156 | $180 | $204 | $240 | $276 | $312 | $348 | $396 | $456 | $516 | $588 | $684 | |
| Personal Liability | $0 | $0 | $0 | $0 | $0 | $0 | $24 | $48 | $84 | $132 | $180 | $216 | |
| Subtotal Direct Cost of Sales | $844 | $956 | $1,076 | $1,240 | $1,428 | $1,632 | $1,876 | $2,172 | $2,636 | $2,976 | $3,408 | $3,964 | |
| Personnel Plan | |||||||||||||
| Month 1 | Month 2 | Month 3 | Month 4 | Month 5 | Month 6 | Month 7 | Month 8 | Month 9 | Month 10 | Month 11 | Month 12 | ||
| Kolem Plynthe | $3,000 | $3,000 | $3,000 | $4,000 | $4,000 | $4,000 | $4,000 | $4,000 | $5,000 | $5,000 | $5,000 | $5,000 | |
| Associate Agent | $0 | $0 | $0 | $0 | $0 | $0 | $0 | $0 | $0 | $0 | $0 | $0 | |
| Total People | 1 | 1 | 1 | 1 | 1 | 1 | 1 | 1 | 1 | 1 | 1 | 1 | |
| Total Payroll | $3,000 | $3,000 | $3,000 | $4,000 | $4,000 | $4,000 | $4,000 | $4,000 | $5,000 | $5,000 | $5,000 | $5,000 | |
| Pro Forma Profit and Loss | |||||||||||||
| Month 1 | Month 2 | Month 3 | Month 4 | Month 5 | Month 6 | Month 7 | Month 8 | Month 9 | Month 10 | Month 11 | Month 12 | ||
| Sales | $5,275 | $5,975 | $6,725 | $7,750 | $8,925 | $10,200 | $11,725 | $13,575 | $16,475 | $18,600 | $21,300 | $24,775 | |
| Direct Cost of Sales | $844 | $956 | $1,076 | $1,240 | $1,428 | $1,632 | $1,876 | $2,172 | $2,636 | $2,976 | $3,408 | $3,964 | |
| Other Costs of Sales | $0 | $0 | $0 | $0 | $0 | $0 | $0 | $0 | $0 | $0 | $0 | $0 | |
| Total Cost of Sales | $844 | $956 | $1,076 | $1,240 | $1,428 | $1,632 | $1,876 | $2,172 | $2,636 | $2,976 | $3,408 | $3,964 | |
| Gross Margin | $4,431 | $5,019 | $5,649 | $6,510 | $7,497 | $8,568 | $9,849 | $11,403 | $13,839 | $15,624 | $17,892 | $20,811 | |
| Gross Margin % | 84.00% | 84.00% | 84.00% | 84.00% | 84.00% | 84.00% | 84.00% | 84.00% | 84.00% | 84.00% | 84.00% | 84.00% | |
| Expenses | |||||||||||||
| Payroll | $3,000 | $3,000 | $3,000 | $4,000 | $4,000 | $4,000 | $4,000 | $4,000 | $5,000 | $5,000 | $5,000 | $5,000 | |
| Marketing/Promotion | $2,000 | $2,000 | $2,000 | $2,000 | $2,000 | $2,000 | $2,000 | $2,000 | $2,000 | $2,000 | $2,000 | $2,000 | |
| Depreciation | $0 | $0 | $0 | $0 | $0 | $0 | $0 | $0 | $0 | $0 | $0 | $0 | |
| Rent | $200 | $200 | $200 | $200 | $200 | $200 | $200 | $200 | $200 | $200 | $200 | $200 | |
| Utilities | $50 | $50 | $50 | $50 | $50 | $50 | $50 | $50 | $50 | $50 | $50 | $50 | |
| Insurance | $200 | $200 | $200 | $200 | $200 | $200 | $200 | $200 | $200 | $200 | $200 | $200 | |
| Payroll Taxes | 15% | $450 | $450 | $450 | $600 | $600 | $600 | $600 | $600 | $750 | $750 | $750 | $750 |
| Education | $400 | $400 | $400 | $400 | $400 | $400 | $400 | $400 | $400 | $400 | $400 | $400 | |
| Total Operating Expenses | $6,300 | $6,300 | $6,300 | $7,450 | $7,450 | $7,450 | $7,450 | $7,450 | $8,600 | $8,600 | $8,600 | $8,600 | |
| Profit Before Interest and Taxes | ($1,869) | ($1,281) | ($651) | ($940) | $47 | $1,118 | $2,399 | $3,953 | $5,239 | $7,024 | $9,292 | $12,211 | |
| EBITDA | ($1,869) | ($1,281) | ($651) | ($940) | $47 | $1,118 | $2,399 | $3,953 | $5,239 | $7,024 | $9,292 | $12,211 | |
| Interest Expense | $48 | $45 | $42 | $39 | $35 | $32 | $27 | $23 | $18 | $12 | $6 | $0 | |
| Taxes Incurred | ($575) | ($398) | ($208) | ($294) | $3 | $326 | $712 | $1,179 | $1,566 | $2,103 | $2,786 | $3,663 | |
| Net Profit | ($1,342) | ($928) | ($485) | ($685) | $8 | $761 | $1,660 | $2,751 | $3,655 | $4,908 | $6,500 | $8,548 | |
| Net Profit/Sales | -25.44% | -15.54% | -7.21% | -8.84% | 0.09% | 7.46% | 14.16% | 20.27% | 22.18% | 26.39% | 30.52% | 34.50% | |
| Pro Forma Cash Flow | |||||||||||||
| Month 1 | Month 2 | Month 3 | Month 4 | Month 5 | Month 6 | Month 7 | Month 8 | Month 9 | Month 10 | Month 11 | Month 12 | ||
| Cash Received | |||||||||||||
| Cash from Operations | |||||||||||||
| Cash Sales | $0 | $0 | $0 | $0 | $0 | $0 | $0 | $0 | $0 | $0 | $0 | $0 | |
| Cash from Receivables | $0 | $176 | $5,298 | $6,000 | $6,759 | $7,789 | $8,968 | $10,251 | $11,787 | $13,672 | $16,546 | $18,690 | |
| Subtotal Cash from Operations | $0 | $176 | $5,298 | $6,000 | $6,759 | $7,789 | $8,968 | $10,251 | $11,787 | $13,672 | $16,546 | $18,690 | |
| Additional Cash Received | |||||||||||||
| Sales Tax, VAT, HST/GST Received | 0.00% | $0 | $0 | $0 | $0 | $0 | $0 | $0 | $0 | $0 | $0 | $0 | $0 |
| New Current Borrowing | $0 | $0 | $0 | $0 | $0 | $0 | $0 | $0 | $0 | $0 | $0 | $0 | |
| New Other Liabilities (interest-free) | $0 | $0 | $0 | $0 | $0 | $0 | $0 | $0 | $0 | $0 | $0 | $0 | |
| New Long-term Liabilities | $0 | $0 | $0 | $0 | $0 | $0 | $0 | $0 | $0 | $0 | $0 | $0 | |
| Sales of Other Current Assets | $0 | $0 | $0 | $0 | $0 | $0 | $0 | $0 | $0 | $0 | $0 | $0 | |
| Sales of Long-term Assets | $0 | $0 | $0 | $0 | $0 | $0 | $0 | $0 | $0 | $0 | $0 | $0 | |
| New Investment Received | $0 | $0 | $0 | $0 | $0 | $0 | $0 | $0 | $0 | $0 | $0 | $0 | |
| Subtotal Cash Received | $0 | $176 | $5,298 | $6,000 | $6,759 | $7,789 | $8,968 | $10,251 | $11,787 | $13,672 | $16,546 | $18,690 | |
| Expenditures | Month 1 | Month 2 | Month 3 | Month 4 | Month 5 | Month 6 | Month 7 | Month 8 | Month 9 | Month 10 | Month 11 | Month 12 | |
| Expenditures from Operations | |||||||||||||
| Cash Spending | $3,000 | $3,000 | $3,000 | $4,000 | $4,000 | $4,000 | $4,000 | $4,000 | $5,000 | $5,000 | $5,000 | $5,000 | |
| Bill Payments | $1,121 | $3,626 | $3,913 | $4,218 | $4,451 | $4,934 | $5,460 | $6,090 | $6,857 | $7,849 | $8,729 | $9,848 | |
| Subtotal Spent on Operations | $4,121 | $6,626 | $6,913 | $8,218 | $8,451 | $8,934 | $9,460 | $10,090 | $11,857 | $12,849 | $13,729 | $14,848 | |
| Additional Cash Spent | |||||||||||||
| Sales Tax, VAT, HST/GST Paid Out | $0 | $0 | $0 | $0 | $0 | $0 | $0 | $0 | $0 | $0 | $0 | $0 | |
| Principal Repayment of Current Borrowing | $175 | $218 | $238 | $259 | $282 | $307 | $335 | $365 | $398 | $434 | $473 | $516 | |
| Other Liabilities Principal Repayment | $0 | $0 | $0 | $0 | $0 | $0 | $0 | $0 | $0 | $0 | $0 | $0 | |
| Long-term Liabilities Principal Repayment | $0 | $0 | $0 | $0 | $0 | $0 | $0 | $0 | $0 | $0 | $0 | $0 | |
| Purchase Other Current Assets | $0 | $0 | $0 | $0 | $0 | $0 | $0 | $0 | $0 | $0 | $0 | $0 | |
| Purchase Long-term Assets | $0 | $0 | $0 | $0 | $0 | $0 | $0 | $0 | $0 | $0 | $0 | $0 | |
| Dividends | $0 | $0 | $0 | $0 | $0 | $0 | $0 | $0 | $0 | $0 | $0 | $0 | |
| Subtotal Cash Spent | $4,296 | $6,844 | $7,151 | $8,477 | $8,733 | $9,241 | $9,795 | $10,455 | $12,255 | $13,283 | $14,202 | $15,364 | |
| Net Cash Flow | ($4,296) | ($6,668) | ($1,853) | ($2,477) | ($1,974) | ($1,452) | ($828) | ($204) | ($468) | $388 | $2,344 | $3,326 | |
| Cash Balance | $19,704 | $13,036 | $11,183 | $8,706 | $6,732 | $5,280 | $4,452 | $4,248 | $3,779 | $4,168 | $6,512 | $9,838 | |
| Pro Forma Balance Sheet | |||||||||||||
| Month 1 | Month 2 | Month 3 | Month 4 | Month 5 | Month 6 | Month 7 | Month 8 | Month 9 | Month 10 | Month 11 | Month 12 | ||
| Assets | Starting Balances | ||||||||||||
| Current Assets | |||||||||||||
| Cash | $24,000 | $19,704 | $13,036 | $11,183 | $8,706 | $6,732 | $5,280 | $4,452 | $4,248 | $3,779 | $4,168 | $6,512 | $9,838 |
| Accounts Receivable | $0 | $5,275 | $11,074 | $12,501 | $14,251 | $16,417 | $18,827 | $21,585 | $24,909 | $29,598 | $34,526 | $39,280 | $45,365 |
| Other Current Assets | $0 | $0 | $0 | $0 | $0 | $0 | $0 | $0 | $0 | $0 | $0 | $0 | $0 |
| Total Current Assets | $24,000 | $24,979 | $24,110 | $23,684 | $22,957 | $23,149 | $24,107 | $26,037 | $29,157 | $33,377 | $38,694 | $45,792 | $55,203 |
| Long-term Assets | |||||||||||||
| Long-term Assets | $0 | $0 | $0 | $0 | $0 | $0 | $0 | $0 | $0 | $0 | $0 | $0 | $0 |
| Accumulated Depreciation | $0 | $0 | $0 | $0 | $0 | $0 | $0 | $0 | $0 | $0 | $0 | $0 | $0 |
| Total Long-term Assets | $0 | $0 | $0 | $0 | $0 | $0 | $0 | $0 | $0 | $0 | $0 | $0 | $0 |
| Total Assets | $24,000 | $24,979 | $24,110 | $23,684 | $22,957 | $23,149 | $24,107 | $26,037 | $29,157 | $33,377 | $38,694 | $45,792 | $55,203 |
| Liabilities and Capital | Month 1 | Month 2 | Month 3 | Month 4 | Month 5 | Month 6 | Month 7 | Month 8 | Month 9 | Month 10 | Month 11 | Month 12 | |
| Current Liabilities | |||||||||||||
| Accounts Payable | $1,000 | $3,496 | $3,773 | $4,070 | $4,287 | $4,753 | $5,258 | $5,863 | $6,596 | $7,559 | $8,402 | $9,473 | $10,853 |
| Current Borrowing | $4,000 | $3,825 | $3,607 | $3,369 | $3,110 | $2,828 | $2,521 | $2,186 | $1,821 | $1,423 | $989 | $516 | $0 |
| Other Current Liabilities | $0 | $0 | $0 | $0 | $0 | $0 | $0 | $0 | $0 | $0 | $0 | $0 | $0 |
| Subtotal Current Liabilities | $5,000 | $7,321 | $7,380 | $7,439 | $7,397 | $7,581 | $7,779 | $8,049 | $8,417 | $8,982 | $9,391 | $9,989 | $10,853 |
| Long-term Liabilities | $0 | $0 | $0 | $0 | $0 | $0 | $0 | $0 | $0 | $0 | $0 | $0 | $0 |
| Total Liabilities | $5,000 | $7,321 | $7,380 | $7,439 | $7,397 | $7,581 | $7,779 | $8,049 | $8,417 | $8,982 | $9,391 | $9,989 | $10,853 |
| Paid-in Capital | $27,000 | $27,000 | $27,000 | $27,000 | $27,000 | $27,000 | $27,000 | $27,000 | $27,000 | $27,000 | $27,000 | $27,000 | $27,000 |
| Retained Earnings | ($8,000) | ($8,000) | ($8,000) | ($8,000) | ($8,000) | ($8,000) | ($8,000) | ($8,000) | ($8,000) | ($8,000) | ($8,000) | ($8,000) | ($8,000) |
| Earnings | $0 | ($1,342) | ($2,270) | ($2,755) | ($3,440) | ($3,432) | ($2,672) | ($1,012) | $1,740 | $5,394 | $10,303 | $16,802 | $25,350 |
| Total Capital | $19,000 | $17,658 | $16,730 | $16,245 | $15,560 | $15,568 | $16,328 | $17,988 | $20,740 | $24,394 | $29,303 | $35,802 | $44,350 |
| Total Liabilities and Capital | $24,000 | $24,979 | $24,110 | $23,684 | $22,957 | $23,149 | $24,107 | $26,037 | $29,157 | $33,377 | $38,694 | $45,792 | $55,203 |
| Net Worth | $19,000 | $17,658 | $16,730 | $16,245 | $15,560 | $15,568 | $16,328 | $17,988 | $20,740 | $24,394 | $29,303 | $35,802 | $44,350 |


