
Wilson Family Peach Farm
Executive Summary
Introduction
The Wilson Family Peach Farm is a start-up venture for Dr. Jared Wilson and his wife, Susan. The Wilsons will be retiring from their regular professions starting in the spring of this year. The farm is intended to provide the Wilsons with an opportunity for post-retirement work and income, plus an opportunity for both of them to continue their individual research programs on agriculture and nutrition. Approximately 80 acres of prime stone fruit growing land is to be acquired, using owner’s equity and a federal farm assistance loan. The farm will be jointly owned by Dr. and Mrs. Wilson and will be set up as a Limited Liability Company chartered in Georgia.
The Farm and its Products
The farm has prime fruit growing land approximately 3.5 northwest of Gainesville, Georgia. This is one of the best areas in the state for growing peaches and other stone fruit. The land gets plenty of sunlight, has excellent drainage, and an optimum soil pH.
The Wilson Family Peach Farm is planning to grow seven varieties of peaches and nectarines in the first three years including the Redhaven, Ishtara, Tenn Natural, Lovell, Bailey, Montclar, Starks Redleaf, and the famous Elberta. Once profitability has been established, the farm will begin to expand into more rare varieties.
The attractiveness of this crop is that fresh, high-quality peaches and nectarines are sweet tasting and low in calories, with one medium peach furnishing only about 37 calories. These fruit are a good source of Vitamin C and yellow-fleshed varieties are a good source of Vitamin A.
The Market
The United States provides about one-fourth (25%) of the world’s total supply of fresh peaches.
Peaches are the third most popular fruit grown in America. They account for more than 70 percent of all stone fruit produced in the U.S. South Carolina and Georgia follow California’s 72 percent share of peach production at a far distance, averaging about 6 and 4 percent of the U.S. total over the past three years. Last year the Georgia peach crop totaled 115 million pounds and brought in $41.7 million. In addition to the Elberta, Georgia now produces more than 40 commercial varieties of peaches. Recent events has shown that the international market for peaches may be expanding, especially in Asia.
Wilson Family Peach Farm plans to sell its crop to three main buyers. In order to keep its profit margin high, the Wilsons will concentrate on selling the majority of its fruit to the local produce stands which are able to charge more for the higher quality fruit. Most of the rest of the fruit will be sold to local fruit packers and distributors that then resell the fruit to grocery stores. Finally any fruit that does not meet the quality/maturity standards of the other two buyers will be sold to canneries.
Financial Considerations
The farm will be financed with a farm assistance loan and a significant amount of owner’s equity. This will provide sufficient cash flow for the farm until it can start making revenue. Sales are expected to be sufficient to be profitable in year one, and have consistent growth through year three.

1.1 Objectives
The objectives over the next three years for the Wilson Family Peach Farm are:
- Achieve profitability in year one.
- Expand by purchasing an additional 50 acres of adjacent land by year three.
- Capitalize on the niche market for hybrid and specialty stone fruits.
- Increase yield per acre to achieve economies of scale.
1.2 Mission
The Mission of the Wilson Family Peach Farm is to provide a retirement occupation and supplemental income for the owners, Jared and Susan Wilson. In addition, the farm will provide a base for Dr. and Mrs. Wilson’s ongoing research in the agriculture and nutritional fields.
1.3 Keys to Success
Farming in the United States is a mature industry with very little growth and a very competitive market. Therefore the Wilsons will focus on the small niche market of hybrid and rare peaches, nectarines, and other stone fruit and also on quality so as to retain its supplier contracts with its chain distributors and local produce sellers. To this end the Wilsons have identified the following key elements to success.
- Become “first to market” through use of early harvest varieties of peaches and nectarines.
- Focus on marketing of hybrids to local distributors.
- Aggressively pursue cost analysis and reduction.
- Concentration on post harvest care of produce to enhance quality.
- Market to the high-end local produce stands that can demand higher prices.
- Capitalize on Dr. Jared Wilson’s close contacts with the University of Georgia’s Agriculture department faculty to introduce new scientific methods and procedures to growing stone fruit.
Company Summary
The Wilson Family Peach Farm is a start-up venture for Dr. Jared Wilson and his wife, Susan. The Wilsons will be retiring from their regular professions starting in the spring of this year. The farm is intended to provide the Wilsons with an opportunity for post-retirement work and income, plus an opportunity for both of them to continue their individual research programs on agriculture and nutrition. Approximately 80 acres of prime stone fruit growing land is to be acquired, with 60 acres being bought outright using owners equity and a federal farm assistance loan. The other 20 acres will be rented. All farmland will be centrally located. The farm will be jointly owned by Dr. and Mrs. Wilson and will be set up as a Limited Liability Company chartered in Georgia.
2.1 Start-up Summary
Farming is a capital intensive industry that requires significant investment in long-term assets such as land and farm equipment. In addition, farming by nature is a highly seasonal endeavor that experiences a profit during only a few months of the year, while expenses are spread out over the entire twelve months. Therefore it is necessary to have a significant amount of cash and cash equivalent assets at the start. The farm will be financed with a farm assistance loan and a significant amount of owner’s equity. This will provide sufficient cash flow for the farm until it can start making a profit.

| Start-up Funding | |
| Start-up Expenses to Fund | $57,000 |
| Start-up Assets to Fund | $268,000 |
| Total Funding Required | $325,000 |
| Assets | |
| Non-cash Assets from Start-up | $140,280 |
| Cash Requirements from Start-up | $127,720 |
| Additional Cash Raised | $0 |
| Cash Balance on Starting Date | $127,720 |
| Total Assets | $268,000 |
| Liabilities and Capital | |
| Liabilities | |
| Current Borrowing | $25,000 |
| Long-term Liabilities | $100,000 |
| Accounts Payable (Outstanding Bills) | $0 |
| Other Current Liabilities (interest-free) | $25,000 |
| Total Liabilities | $150,000 |
| Capital | |
| Planned Investment | |
| Dr. and Mrs. Wilson | $175,000 |
| Other | $0 |
| Additional Investment Requirement | $0 |
| Total Planned Investment | $175,000 |
| Loss at Start-up (Start-up Expenses) | ($57,000) |
| Total Capital | $118,000 |
| Total Capital and Liabilities | $268,000 |
| Total Funding | $325,000 |
| Start-up | |
| Requirements | |
| Start-up Expenses | |
| Legal | $2,000 |
| Repairs to facilities/equipment | $15,000 |
| Insurance | $5,000 |
| Rent | $5,000 |
| Research and development | $5,000 |
| Expensed equipment | $20,000 |
| Herbicides/pesticides | $5,000 |
| Total Start-up Expenses | $57,000 |
| Start-up Assets | |
| Cash Required | $127,720 |
| Start-up Inventory | $0 |
| Other Current Assets | $0 |
| Long-term Assets | $140,280 |
| Total Assets | $268,000 |
| Total Requirements | $325,000 |
2.2 Company Locations and Facilities
The Wilsons have made the down payment/rent on 80 acres of prime fruit growing land approximately 3.5 northwest of Gainesville, Georgia. This is one of the best areas in the state for growing peaches and other stone fruit. The acreage being sought has been a successful peach farm in the past and gets plenty of sunlight, especially early morning sunlight that dries the dew from the trees, thereby reducing the incidence of diseases. In addition the area has excellent drainage and an optimum soil pH of around 6.0.

The farm itself comes with a century old house, in good condition, barn and storage area, including large refrigeration facilities, and excellent irrigation equipment. Georgia has two commercial peach-growing regions. The central region is the largest with about 70 percent of the peach trees and 83 percent of the state’s production. The northeastern region has about 23 percent of the trees and produces 17 percent of the state’s harvest. The location of the farm is ideal as it straddles both regions.
Products
The Wilson Family Peach Farm is planning to grow seven varieties of peaches and nectarines in the first three years including the Redhaven, Ishtara, Tenn Natural, Lovell, Bailey, Montclar, Starks Redleaf, and the famous Elberta. Once profitability has been established, the farm will begin to expand into more rare varieties such as the new Guardian, which has been proven to be well suited to the local environment. In addition, the owners will dedicate approximately ten acres to the growing of hybrids such as pluots, which are a combination of apricots and plums. Trees will be spaced 16 ft apart within rows 20 ft apart. Average yield per tree is expected to initially be 132 lbs/tree. Considering the prime area and some of the proprietary methods the Wilsons plan to implement, yields are expected to go up to as much as 160 lbs/tree. Expected yields per acre will be around 500 bushels.
With the current trend toward high-density plantings of the dwarf, semi-dwarf and spur type trees, careful planning of cultivars (varieties), strains, rootstocks, and spacing will pay dividends.
Marketing will target the local produce stands that often concentrate on hybrids and are able to offer higher margins for high-quality fruits. In addition, Mrs. Wilson has started to establish contracts with distributors to local grocery stores. Any damaged fruit that is still edible will be sold to canning factories.
3.1 Product Description
Peaches are grown on fruit trees (Prunus persica) of the family Rosaceae (rose family) having decorative pink blossoms and a juicy, sweet fruit. Several of its horticultural varieties were brought by the Spanish to North America, where it became naturalized as far north as Pennsylvania by the late 17th century. The numerous varieties of peaches under cultivation are generally distinguished as clingstone or freestone; the latter include the famous Elberta peach. In the United States commercial peach production centers in California and in the southern Atlantic states. Elsewhere the peach is cultivated in southern Europe, Africa, Japan, and Australia. The tree is prey to frost and is attacked by various fungi, virus diseases, and insect pests, against all of which careful precautions must be taken by growers. Purple-leaved and double-flowering forms are cultivated as ornamentals. The peach is closely related to other species of Prunus e.g., the cherry, plum, and almond. *
The nectarine is a smooth-skinned peach with both freestone and clingstone varieties. It is a classical example of bud variation. The nectarine tree occasionally produces peaches, and the peach tree nectarines. In appearance, culture, and care the nectarine is almost identical to the peach.*
The attractiveness of this fruit is that fresh, high-quality peaches and nectarines are sweet tasting and low in calories, with one medium peach furnishing only about 37 calories. These fruit are a good source of Vitamin C and yellow-fleshed varieties are a good source of Vitamin A.
Peach/nectarine harvest begins in May, peaks in July, and ends in August.
One of the most critical aspects of fruit farming is the post-harvest treatment which can preserve or destroy its freshness and appeal. Peaches have a post-harvest life of 14 – 28 days if they are handled properly after harvest. During Dr. Wilson’s tenure at the University of Georgia as an professor of agriculture, he concentrated much of his research on the post-harvest treatment of stone fruit. In order to produce the fruit with the highest quality, Dr. Wilson will be devoting a great deal of effort to create the best environment for the preservation of the harvest. This includes monitoring of the fruit’s maturity and quality indices, optimum temperature and relative humidity of storage, and rates of respiration and ethylene production.
* Source: American Fruit Producers Almanac.
3.1.1 Sourcing
Site and Soil Requirements
Sunlight, and plenty of it, is the key to maximizing fruit production. An area is needed where the trees will be in the sun most or all of the day. The early morning sun is particularly important because it dries the dew from trees, thereby reducing the incidence of diseases. If the planting site does not get plenty of sun, then you can’t expect the best performance from the trees. Very steep or badly eroded hillsides and areas having poor air circulation and poor soil water drainage must be avoided. Although peach trees will grow well in a wide range of soil types, a deep soil ranging in texture from a sandy loam to a sandy clay loam is preferred. Peach trees are extremely sensitive to poorly drained soils. In areas of poor drainage, roots will die, resulting in stunted growth and eventual death of the tree.
Most fruit plants, including peaches, grow best when the soil pH is near 6.5. Since the natural pH of most Georgia soil is below this level, it is necessary to incorporate lime before planting to raise the pH to the desired level.
Purchasing Trees
The old adage “you get what you pay for” is an important consideration when buying peach trees. Often, bargain plants are not healthy or may not be a variety adapted to your area. The Wilson’s have a reliable source of trees, rootstocks and saplings that has been in operation for over thirty years.
The Wilsons plan to purchase trees that meet the following criteria:
- A healthy one-year-old tree, approximately three to four feet tall.
- All trees must have a good root system.
- Trees that are no more than two years old. Frequently, older trees do not have sufficient buds on the lower portion of the trunk to develop a good framework.
- No trees that appear stunted, poorly grown, diseased or insect injured.
Fertilization
Fertilizing peaches starts with adjusting the soil pH to 6.5 before planting. Additional fertilization using lime and calcium nitrate will occur in March and August.
Distribution
Farmers who are able to sell to the local produce stands usually are able to achieve a higher margin than other competitors since these stands are usually the place where buyers go to get the highest-quality produce and search for rare and new types of cultivars. In an area such as Georgia that has such a strong tradition of fruit farming, only the farmers offering the highest quality are able to break into this market. This requires excellent land, and most importantly, knowledgeable and sustained management on the part of the farmer. Based on previous acquaintance and Dr. Wilson’s reputation in the agriculture field, Mrs. Wilson has been able to establish tentative contracts with ten different local produce sellers and with a local distributor. Final approval of these contracts will depend on the tested quality of the farm’s produce.
3.2 Competitive Comparison
The peach farming industry is highly competitive. Each farm has high capital costs, low margins, and a high intensity of competition.
In addition, the produce is seen as undifferentiated and a “commodity” with little value separation between competitors, this means that buyer power is very high.
The barriers to entry and exit are moderately high in this industry. Switching costs between different types of produce are virtually non-existent. However, the costs to entry and exist the market are usually quite high. However, the advantages of producing at high volume and reaping the benefits of economies of scale are quite attractive. Once the farm reaches maximum production, these economies of scale will work toward the owner’s advantage.
The large number of competitors in this field including substitutes (which includes almost all other types of fruit and some vegetables) mean that the pricing for such produce is very competitive. The only way to have an advantage in this industry is either serving a niche or a low cost leadership principal applied aggressively to all aspects of the business.
3.3 Technology
During Dr. Wilson’s twenty years as a professor of Agriculture at the University of Georgia, he became involved in some of the most leading edge technological and biological developments in the stone fruit growing field. His monogram, Quantitative Maturity and Quality indices for Freestone Fruits (Bert, Wilson et. al, Agriculture Digest: Spring 1990) has established industry-wide standards for both farmers and suppliers. It is Dr. Wilson’s intention to continue introducing new procedures and processes in his farming in order to maintain a competitive advantage and to be an image for other fruit farmers to aspire toward. Much of this will be of an empirical and statistical nature in order to identify and establish various trends in disease and pest prevention (especially in the organic field). As an example of the technology to be used, Dr. Wilson will begin to utilize the new laser puff to measure the ripeness of peaches. The instrument, developed by University of Georgia agricultural and biological engineers, uses a puff of air and a laser beam to measure the firmness of fruit to help fruit growers and packers deliver a riper, more consistent product to market.
3.4 Future Products
At the beginning of operations the Wilson Family Peach Farm plans to grow established early harvest varieties of peaches and nectarines in order to be first to market during the year of American grown fruit. As the farm starts producing a profit (estimated sometime around year four) the farm will start producing some of the newer varieties such as the recently developed Guardian, which is far better suited for the local environmental conditions than other varieties, even the well established Elberta variety. The farm will also start producing hybrid for the small niche market of specialty fruits in order to produce a higher margin.
Market Analysis Summary
The United States provides about one-fourth (25%) of the world’s total supply of fresh peaches.
Peaches are the third most popular fruit grown in America. Peaches account for more than 70 percent of all stone fruit produced in the U.S. South Carolina and Georgia follow California’s 72 percent share of peach production at a far distance, averaging about 6 and 4 percent of the U.S. total over the past three years. In 2000, the Georgia peach crop totaled 115 million pounds and brought in $41.7 million. In addition to the Elberta, Georgia now produces more than 40 commercial varieties of peaches.
Domestic and export prices for stone fruit in 2002 depend on several factors and cannot be predicted with certainty. Last year, grower prices for plums and nectarines averaged lower than the previous year, while grower prices for peaches averaged 3 percent higher, even with the larger crop. Much of the increase sprang from higher prices for processing peaches, and prices for fresh-market peaches averaged slightly lower. Although supplies in Georgia this summer are expected to be ample to meet summer stone fruit demand, reduced production and good quality may push up stone fruit prices from last year.
What could also help boost prices are export markets as strong as last year’s, when U.S. exports of fresh peaches (including nectarines) and fresh plums were up 15 percent and 12 percent from the year before. Shipments to all three major U.S. markets for fresh peaches were up (Canada, 1 percent; Taiwan, 29 percent; and Mexico, 42 percent), as were shipments to the two major export markets for U.S. fresh plums (Canada, up 2 percent; and Taiwan, 16 percent). Plum exports to Hong Kong were steady. Although Japan opened its market last year for the first time to U.S. fresh nectarines, it did so late in the season; domestic supplies were already scarce and only a small volume was shipped. This summer, the Japanese market will open for U.S. nectarines around June 15, according to CTFA, when U.S. supplies are ample. On the downside, poor economic conditions in Japan and slower growth in Taiwan this year may weaken demand for U.S. stone fruit. Last summer’s retail prices for fresh-market peaches averaged 1 percent below 1999, but 8 percent above the average of the last five years (1995-99).
This year, freezing temperatures throughout the Southeast in early March damaged some peaches in northern Georgia. As of the last week of April, 70 percent of Georgia’s peach crop appeared to be in good condition; 81 percent of South Carolina’s peach crop appeared to be in fair to good condition. Harvesting of early peach varieties started the week of April 15, early nectarine varieties a week later, and early plum varieties around mid-May.
Source: USDA Agriculture Outlook, June/July 2002
4.1 Market Segmentation
Wilson Family Peach Farm plans to sell its crop to three main buyers. In order to keep its profit margin high, the Wilsons will concentrate on selling the majority of its fruit to the local produce stands which are able to charge more for the higher quality fruit. Most of the rest of the fruit will be sold to local fruit packers and distributors that then resell the fruit to grocery stores. Finally any fruit that does not meet the quality/maturity standards of the other two buyers will be sold to canneries.

| Market Analysis | |||||||
| Year 1 | Year 2 | Year 3 | Year 4 | Year 5 | |||
| Potential Customers | Growth | CAGR | |||||
| Local produce stands | 1% | 100 | 101 | 102 | 103 | 104 | 0.99% |
| Local distributors/grocery stores | 1% | 18 | 18 | 18 | 18 | 18 | 0.00% |
| Canning companies | 1% | 4 | 4 | 4 | 4 | 4 | 0.00% |
| Total | 0.81% | 122 | 123 | 124 | 125 | 126 | 0.81% |
4.2 Industry Analysis
The is a wide range of industry participants in the fruit business, from large corporations and co-ops to small farms specializing in fruit, to small farms that sell fruit directly to the buyer from a small number of trees. This makes for a very fragmented industry where it is difficult to generalize strengths, weaknesses, competitors, and opportunities. Attempts to consolidate the industry in the past have been of only limited success because of its capital intensive nature and government involvement in promoting family-style farming.
Distribution of fruits generally involves sale of large volumes to highly consolidated packers and canners who have a large influence on the individual farmer. Because any small farm is such a small percentage of the total volume that distributors deal with, switching costs for distributors are low and therefore small farmers use local groups such as co-ops to sell their produce. Small farms are able to direct sell through vertical integration (owning produce stands) or sell to small distributors.
4.2.1 Industry Participants
The stone fruit farming industry is highly fragmented with a large number of industry participants ranging in size from very large corporate farms with hundreds of acres and employing significant migrant workers during the harvest season to the small family farms that are often smaller than a hundred acres and have less than ten laborers per farm.
4.2.2 Main Competitors
There are approximately 1,300 different peach farmers of all sizes in the Georgia/South Carolina area. Due to this large number and the inability of any one industry participant to effect market price, the Wilson Family Peach Farm does not have any specific rivals to compete over market share or important customers.
Strategy and Implementation Summary
It is the strategy of the Wilson Family Peach Farm to capitalize on the extensive agricultural knowledge of Dr. Wilson and his well established reputation in order to produce and market high-quality peaches/nectarines. Furthermore the Wilson’s plan to develop and produce new varieties and hybrid fruit to introduce to the general public. This will be done through Dr. and Mrs. Wilson’s own research and by allowing University of Georgia staff to use limited acreage for experimental purposes.
Promotion of sales will be through the various local farmer’s co-ops and groups that will act as the brokers between the farm and the distributors.
5.1 Competitive Edge
Wilson Family Peach Farm’s competitive edge is the agricultural knowledge of Dr. Wilson and his close contacts at the University of Georgia Agriculture department that offers the opportunity to introduce new methods and processes in stone fruit farming well in advance of other local farmers.
5.2 Marketing Strategy
Marketing is the most important factor to be considered before venturing into the orchard business. The hard facts are that to be profitable, a small, new operation needs to be related to a retail sales outlet either on the farm or in a community nearby. In view of current retail and wholesale prices, the wholesale fruit business is too hazardous for a newcomer to justify the risk involved. There is a “jobber” market, in which you as a grower may sell directly to retail markets in nearby cities. While this is by definition “wholesale,” it provides better returns than the regular wholesale marketing channels.
The processing and juice markets are chronically too low priced to be considered, unless a specialty market is pursued. It is at present a way of salvaging off-grade fruit.
For retail sales or pick-your-own to be effective and profitable, the farm location in relation to an adequate population base is very important. Competition: Is there a window of opportunity in your community? Is there room for another retail orchard operation? Of course, aggressive marketing can make room, but sales are much easier when competition is reduced. A community will only consume so many apples. If more than that amount is produced, then the surplus must be “exported.”
Three of the primary success factors in this type of operation are: location, location, and location. Good, well-traveled roads – close to a population center – and an attractive, accessible, convenient site are all-important factors, too. Of course, these factors will not bring success without good management and marketing strategies.
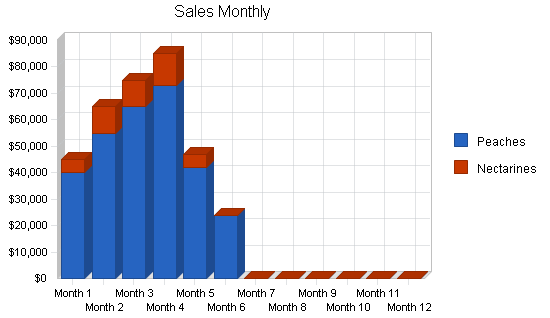
5.3 Sales Forecast
The forecasted yields are approximately 500 bushels per acre and the assumed price per bushel is $15.00 based on a five year average. These assumptions are also a conservative estimate based on yields averaged over a ten year timespan to incorporate variable weather patterns. All profits are earned in the late winter early fall months as the owners begin to sell 90-day futures contracts on the crop. Peach and nectarine harvest begins in May, peaks in July, and ends in August.
The following table and charts outlines the sales forecast for Wilson Family Peach Farm for the next three years.

| Sales Forecast | |||
| Year 1 | Year 2 | Year 3 | |
| Sales | |||
| Peaches | $299,000 | $310,960 | $322,776 |
| Nectarines | $42,000 | $43,680 | $45,340 |
| Total Sales | $341,000 | $354,640 | $368,116 |
| Direct Cost of Sales | Year 1 | Year 2 | Year 3 |
| Peaches | $89,700 | $93,288 | $96,833 |
| Nectarines | $12,600 | $13,104 | $13,602 |
| Subtotal Direct Cost of Sales | $102,300 | $106,392 | $110,435 |
Management Summary
The Wilson Family Peach Farm will be operated by Dr. Jared Wilson and his wife, Susan. During the harvest season and other times of need, the Wilsons will hire contract laborers at minimum wage to assist them. These laborers will probably number no more than six people at any one time. All accounting and bookkeeping will be outsourced.
Dr. Jared Wilson is a native of Georgia, having been born in White Creek in 1947. He attended the University of South Carolina where he obtained his Bachelors of Science in Horticulture in 1968. He subsequently did five years of research throughout the American Southeast, concentrating on upgrading soil testing techniques. In 1978 he completed his P.h.D in Agriculture at the University of California, Davis. He became assistant professor at the University of Georgia in 1980 and assumed the chair of the James F. Orcott Professor of Agriculture there in 1985. Throughout his career he has continually worked on fruit research, with his most important work being in creating quality and maturity standards for most stone and citrus produce. He has a large number of research papers to his credit and has an international reputation as one of the finest researchers in fruit production and methods. He has consulted for the U.S. Department of Agriculture at various times and is the president of the American Fruit Growers Association.
Mrs. Susan Wilson was born in San Jose, California and graduated from the University of California, Davis in 1979 with a degree in nutrition. She obtained her Masters degree in nutrition at the University of Georgia in 1981. She subsequently worked at Mercy Hospital in Athens, Georgia advising patients on eating disorders. Mrs. Wilson is a member of the American Nutritional Educator Society of America.
| Personnel Plan | |||
| Year 1 | Year 2 | Year 3 | |
| Payroll | $14,000 | $8,000 | $12,000 |
| Other | $0 | $0 | $0 |
| Total People | 1 | 1 | 1 |
| Total Payroll | $14,000 | $8,000 | $12,000 |
Financial Plan
The financial future looks healthy for Wilson Family Peach Farm. Margins are higher than for typical fruit farms, because the Wilsons are focusing on growing hybrid fruit that are more difficult to grow, but produce a tastier fruit. In addition they will sell to the local produce stands which are able to charge more for the higher quality fruit.
7.1 Break-even Analysis
The farm’s Break-even Analysis is based on its running costs, including payroll, and its present fixed costs, not including the expenses associated with the farm’s planned expansion in 2004. All units are in bushels.

| Break-even Analysis | |
| Monthly Revenue Break-even | $12,658 |
| Assumptions: | |
| Average Percent Variable Cost | 30% |
| Estimated Monthly Fixed Cost | $8,860 |
7.2 Projected Profit and Loss
The Projected Profit and Loss for the Wilson Family Peach Farm has an average gross margin of about 35-40%. Th expenditures are based on the following data provided by the Georgia State Agriculture Division.
Average Expenditures on Georgia Farms, Percent of Total Expenses by Category
| Capital | 8.5% |
| Energy | 4.5% |
| Feed & Hay | 23.0% |
| Fertilzer | 5.0% |
| Hired Labor | 9.0% |
| Interest | 7.0% |
| Landlords | 2.0% |
| Livestock | 6.5% |
| Marketing | 6.0% |
| Other Misc | 14.5% |
| Pesticides | 4.5% |
| Repairs | 4.0% |
| Seed | 3.0% |
| Tax & Fees | 2.5% |


| Pro Forma Profit and Loss | |||
| Year 1 | Year 2 | Year 3 | |
| Sales | $341,000 | $354,640 | $368,116 |
| Direct Cost of Sales | $102,300 | $106,392 | $110,435 |
| Other Production Expenses | $0 | $0 | $0 |
| Total Cost of Sales | $102,300 | $106,392 | $110,435 |
| Gross Margin | $238,700 | $248,248 | $257,681 |
| Gross Margin % | 70.00% | 70.00% | 70.00% |
| Expenses | |||
| Payroll | $14,000 | $8,000 | $12,000 |
| Sales and Marketing and Other Expenses | $36,625 | $41,000 | $41,000 |
| Depreciation | $3,200 | $5,000 | $5,000 |
| Leased Equipment | $8,000 | $8,000 | $8,000 |
| Utilities | $4,600 | $6,000 | $6,000 |
| Insurance | $13,800 | $14,400 | $14,400 |
| Rent | $24,000 | $24,000 | $24,000 |
| Payroll Taxes | $2,100 | $1,200 | $1,800 |
| Other | $0 | $0 | $0 |
| Total Operating Expenses | $106,325 | $107,600 | $112,200 |
| Profit Before Interest and Taxes | $132,375 | $140,648 | $145,481 |
| EBITDA | $135,575 | $145,648 | $150,481 |
| Interest Expense | $11,037 | $8,450 | $6,300 |
| Taxes Incurred | $36,401 | $39,659 | $41,754 |
| Net Profit | $84,936 | $92,539 | $97,427 |
| Net Profit/Sales | 24.91% | 26.09% | 26.47% |
7.3 Projected Cash Flow
The following is the projected Cash Flow for Wilson Family Peach Farm.

| Pro Forma Cash Flow | |||
| Year 1 | Year 2 | Year 3 | |
| Cash Received | |||
| Cash from Operations | |||
| Cash Sales | $51,150 | $53,196 | $55,217 |
| Cash from Receivables | $289,850 | $301,444 | $312,899 |
| Subtotal Cash from Operations | $341,000 | $354,640 | $368,116 |
| Additional Cash Received | |||
| Sales Tax, VAT, HST/GST Received | $0 | $0 | $0 |
| New Current Borrowing | $0 | $0 | $0 |
| New Other Liabilities (interest-free) | $0 | $0 | $0 |
| New Long-term Liabilities | $0 | $0 | $0 |
| Sales of Other Current Assets | $0 | $0 | $0 |
| Sales of Long-term Assets | $0 | $0 | $0 |
| New Investment Received | $20,000 | $0 | $0 |
| Subtotal Cash Received | $361,000 | $354,640 | $368,116 |
| Expenditures | Year 1 | Year 2 | Year 3 |
| Expenditures from Operations | |||
| Cash Spending | $14,000 | $8,000 | $12,000 |
| Bill Payments | $241,459 | $234,647 | $253,641 |
| Subtotal Spent on Operations | $255,459 | $242,647 | $265,641 |
| Additional Cash Spent | |||
| Sales Tax, VAT, HST/GST Paid Out | $0 | $0 | $0 |
| Principal Repayment of Current Borrowing | $12,000 | $12,000 | $1,000 |
| Other Liabilities Principal Repayment | $0 | $0 | $0 |
| Long-term Liabilities Principal Repayment | $15,000 | $15,000 | $15,000 |
| Purchase Other Current Assets | $0 | $40,000 | $10,000 |
| Purchase Long-term Assets | $24,000 | $50,000 | $0 |
| Dividends | $0 | $50,000 | $0 |
| Subtotal Cash Spent | $306,459 | $409,647 | $291,641 |
| Net Cash Flow | $54,541 | ($55,007) | $76,475 |
| Cash Balance | $182,261 | $127,254 | $203,729 |
7.4 Projected Balance Sheet
The following table shows the Projected Balance Sheet for Wilson Family Peach Farm.
| Pro Forma Balance Sheet | |||
| Year 1 | Year 2 | Year 3 | |
| Assets | |||
| Current Assets | |||
| Cash | $182,261 | $127,254 | $203,729 |
| Accounts Receivable | $0 | $0 | $0 |
| Inventory | $8,310 | $8,642 | $8,971 |
| Other Current Assets | $0 | $40,000 | $50,000 |
| Total Current Assets | $190,571 | $175,896 | $262,700 |
| Long-term Assets | |||
| Long-term Assets | $164,280 | $214,280 | $214,280 |
| Accumulated Depreciation | $3,200 | $8,200 | $13,200 |
| Total Long-term Assets | $161,080 | $206,080 | $201,080 |
| Total Assets | $351,651 | $381,976 | $463,780 |
| Liabilities and Capital | Year 1 | Year 2 | Year 3 |
| Current Liabilities | |||
| Accounts Payable | $5,715 | $20,501 | $20,878 |
| Current Borrowing | $13,000 | $1,000 | $0 |
| Other Current Liabilities | $25,000 | $25,000 | $25,000 |
| Subtotal Current Liabilities | $43,715 | $46,501 | $45,878 |
| Long-term Liabilities | $85,000 | $70,000 | $55,000 |
| Total Liabilities | $128,715 | $116,501 | $100,878 |
| Paid-in Capital | $195,000 | $195,000 | $195,000 |
| Retained Earnings | ($57,000) | ($22,064) | $70,475 |
| Earnings | $84,936 | $92,539 | $97,427 |
| Total Capital | $222,936 | $265,475 | $362,902 |
| Total Liabilities and Capital | $351,651 | $381,976 | $463,780 |
| Net Worth | $222,936 | $265,475 | $362,902 |
7.5 Business Ratios
Business ratios for the years of this plan are shown below. Industry profile ratios based on the Standard Industrial Classification (SIC) code 0175, [Other Noncitrus Fruit Farming (except apples, grapes, berries, and fruit(s) and tree nut(s) combinations)], are shown for comparison.
| Ratio Analysis | ||||
| Year 1 | Year 2 | Year 3 | Industry Profile | |
| Sales Growth | 0.00% | 4.00% | 3.80% | 1.65% |
| Percent of Total Assets | ||||
| Accounts Receivable | 0.00% | 0.00% | 0.00% | 8.36% |
| Inventory | 2.36% | 2.26% | 1.93% | 9.81% |
| Other Current Assets | 0.00% | 10.47% | 10.78% | 26.10% |
| Total Current Assets | 54.19% | 46.05% | 56.64% | 44.27% |
| Long-term Assets | 45.81% | 53.95% | 43.36% | 55.73% |
| Total Assets | 100.00% | 100.00% | 100.00% | 100.00% |
| Current Liabilities | 12.43% | 12.17% | 9.89% | 21.43% |
| Long-term Liabilities | 24.17% | 18.33% | 11.86% | 29.04% |
| Total Liabilities | 36.60% | 30.50% | 21.75% | 50.47% |
| Net Worth | 63.40% | 69.50% | 78.25% | 49.53% |
| Percent of Sales | ||||
| Sales | 100.00% | 100.00% | 100.00% | 100.00% |
| Gross Margin | 70.00% | 70.00% | 70.00% | 50.62% |
| Selling, General & Administrative Expenses | 35.83% | 35.32% | 35.03% | 36.01% |
| Advertising Expenses | 1.76% | 2.26% | 2.17% | 0.27% |
| Profit Before Interest and Taxes | 38.82% | 39.66% | 39.52% | 0.85% |
| Main Ratios | ||||
| Current | 4.36 | 3.78 | 5.73 | 1.35 |
| Quick | 4.17 | 3.60 | 5.53 | 0.67 |
| Total Debt to Total Assets | 36.60% | 30.50% | 21.75% | 60.87% |
| Pre-tax Return on Net Worth | 54.43% | 49.80% | 38.35% | 0.84% |
| Pre-tax Return on Assets | 34.51% | 34.61% | 30.01% | 2.14% |
| Additional Ratios | Year 1 | Year 2 | Year 3 | |
| Net Profit Margin | 24.91% | 26.09% | 26.47% | n.a |
| Return on Equity | 38.10% | 34.86% | 26.85% | n.a |
| Activity Ratios | ||||
| Accounts Receivable Turnover | 0.00 | 0.00 | 0.00 | n.a |
| Collection Days | 60 | 0 | 0 | n.a |
| Inventory Turnover | 7.54 | 12.55 | 12.54 | n.a |
| Accounts Payable Turnover | 43.25 | 12.17 | 12.17 | n.a |
| Payment Days | 27 | 19 | 30 | n.a |
| Total Asset Turnover | 0.97 | 0.93 | 0.79 | n.a |
| Debt Ratios | ||||
| Debt to Net Worth | 0.58 | 0.44 | 0.28 | n.a |
| Current Liab. to Liab. | 0.34 | 0.40 | 0.45 | n.a |
| Liquidity Ratios | ||||
| Net Working Capital | $146,856 | $129,395 | $216,822 | n.a |
| Interest Coverage | 11.99 | 16.64 | 23.09 | n.a |
| Additional Ratios | ||||
| Assets to Sales | 1.03 | 1.08 | 1.26 | n.a |
| Current Debt/Total Assets | 12% | 12% | 10% | n.a |
| Acid Test | 4.17 | 3.60 | 5.53 | n.a |
| Sales/Net Worth | 1.53 | 1.34 | 1.01 | n.a |
| Dividend Payout | 0.00 | 0.54 | 0.00 | n.a |
Appendix
| Sales Forecast | |||||||||||||
| Month 1 | Month 2 | Month 3 | Month 4 | Month 5 | Month 6 | Month 7 | Month 8 | Month 9 | Month 10 | Month 11 | Month 12 | ||
| Sales | |||||||||||||
| Peaches | 0% | $40,000 | $55,000 | $65,000 | $73,000 | $42,000 | $24,000 | $0 | $0 | $0 | $0 | $0 | $0 |
| Nectarines | 0% | $5,000 | $10,000 | $10,000 | $12,000 | $5,000 | $0 | $0 | $0 | $0 | $0 | $0 | $0 |
| Total Sales | $45,000 | $65,000 | $75,000 | $85,000 | $47,000 | $24,000 | $0 | $0 | $0 | $0 | $0 | $0 | |
| Direct Cost of Sales | Month 1 | Month 2 | Month 3 | Month 4 | Month 5 | Month 6 | Month 7 | Month 8 | Month 9 | Month 10 | Month 11 | Month 12 | |
| Peaches | $12,000 | $16,500 | $19,500 | $21,900 | $12,600 | $7,200 | $0 | $0 | $0 | $0 | $0 | $0 | |
| Nectarines | $1,500 | $3,000 | $3,000 | $3,600 | $1,500 | $0 | $0 | $0 | $0 | $0 | $0 | $0 | |
| Subtotal Direct Cost of Sales | $13,500 | $19,500 | $22,500 | $25,500 | $14,100 | $7,200 | $0 | $0 | $0 | $0 | $0 | $0 | |
| Personnel Plan | |||||||||||||
| Month 1 | Month 2 | Month 3 | Month 4 | Month 5 | Month 6 | Month 7 | Month 8 | Month 9 | Month 10 | Month 11 | Month 12 | ||
| Payroll | 0% | $0 | $0 | $500 | $1,500 | $3,000 | $3,000 | $3,000 | $2,000 | $1,000 | $0 | $0 | $0 |
| Other | 0% | $0 | $0 | $0 | $0 | $0 | $0 | $0 | $0 | $0 | $0 | $0 | $0 |
| Total People | 1 | 1 | 1 | 1 | 1 | 1 | 1 | 1 | 1 | 1 | 1 | 1 | |
| Total Payroll | $0 | $0 | $500 | $1,500 | $3,000 | $3,000 | $3,000 | $2,000 | $1,000 | $0 | $0 | $0 | |
| General Assumptions | |||||||||||||
| Month 1 | Month 2 | Month 3 | Month 4 | Month 5 | Month 6 | Month 7 | Month 8 | Month 9 | Month 10 | Month 11 | Month 12 | ||
| Plan Month | 1 | 2 | 3 | 4 | 5 | 6 | 7 | 8 | 9 | 10 | 11 | 12 | |
| Current Interest Rate | 10.00% | 10.00% | 10.00% | 10.00% | 10.00% | 10.00% | 10.00% | 10.00% | 10.00% | 10.00% | 10.00% | 10.00% | |
| Long-term Interest Rate | 10.00% | 10.00% | 10.00% | 10.00% | 10.00% | 10.00% | 10.00% | 10.00% | 10.00% | 10.00% | 10.00% | 10.00% | |
| Tax Rate | 30.00% | 30.00% | 30.00% | 30.00% | 30.00% | 30.00% | 30.00% | 30.00% | 30.00% | 30.00% | 30.00% | 30.00% | |
| Other | 0 | 0 | 0 | 0 | 0 | 0 | 0 | 0 | 0 | 0 | 0 | 0 | |
| Pro Forma Profit and Loss | |||||||||||||
| Month 1 | Month 2 | Month 3 | Month 4 | Month 5 | Month 6 | Month 7 | Month 8 | Month 9 | Month 10 | Month 11 | Month 12 | ||
| Sales | $45,000 | $65,000 | $75,000 | $85,000 | $47,000 | $24,000 | $0 | $0 | $0 | $0 | $0 | $0 | |
| Direct Cost of Sales | $13,500 | $19,500 | $22,500 | $25,500 | $14,100 | $7,200 | $0 | $0 | $0 | $0 | $0 | $0 | |
| Other Production Expenses | $0 | $0 | $0 | $0 | $0 | $0 | $0 | $0 | $0 | $0 | $0 | $0 | |
| Total Cost of Sales | $13,500 | $19,500 | $22,500 | $25,500 | $14,100 | $7,200 | $0 | $0 | $0 | $0 | $0 | $0 | |
| Gross Margin | $31,500 | $45,500 | $52,500 | $59,500 | $32,900 | $16,800 | $0 | $0 | $0 | $0 | $0 | $0 | |
| Gross Margin % | 70.00% | 70.00% | 70.00% | 70.00% | 70.00% | 70.00% | 0.00% | 0.00% | 0.00% | 0.00% | 0.00% | 0.00% | |
| Expenses | |||||||||||||
| Payroll | $0 | $0 | $500 | $1,500 | $3,000 | $3,000 | $3,000 | $2,000 | $1,000 | $0 | $0 | $0 | |
| Sales and Marketing and Other Expenses | $2,750 | $2,700 | $2,775 | $2,800 | $2,800 | $3,400 | $2,900 | $2,900 | $3,400 | $3,400 | $3,400 | $3,400 | |
| Depreciation | $200 | $200 | $200 | $200 | $200 | $200 | $200 | $200 | $400 | $400 | $400 | $400 | |
| Leased Equipment | $0 | $0 | $0 | $2,000 | $2,000 | $2,000 | $1,000 | $1,000 | $0 | $0 | $0 | $0 | |
| Utilities | $200 | $200 | $200 | $200 | $200 | $400 | $400 | $400 | $600 | $600 | $600 | $600 | |
| Insurance | $600 | $600 | $600 | $600 | $600 | $1,200 | $1,200 | $1,200 | $1,800 | $1,800 | $1,800 | $1,800 | |
| Rent | $2,000 | $2,000 | $2,000 | $2,000 | $2,000 | $2,000 | $2,000 | $2,000 | $2,000 | $2,000 | $2,000 | $2,000 | |
| Payroll Taxes | 15% | $0 | $0 | $75 | $225 | $450 | $450 | $450 | $300 | $150 | $0 | $0 | $0 |
| Other | $0 | $0 | $0 | $0 | $0 | $0 | $0 | $0 | $0 | $0 | $0 | $0 | |
| Total Operating Expenses | $5,750 | $5,700 | $6,350 | $9,525 | $11,250 | $12,650 | $11,150 | $10,000 | $9,350 | $8,200 | $8,200 | $8,200 | |
| Profit Before Interest and Taxes | $25,750 | $39,800 | $46,150 | $49,975 | $21,650 | $4,150 | ($11,150) | ($10,000) | ($9,350) | ($8,200) | ($8,200) | ($8,200) | |
| EBITDA | $25,950 | $40,000 | $46,350 | $50,175 | $21,850 | $4,350 | ($10,950) | ($9,800) | ($8,950) | ($7,800) | ($7,800) | ($7,800) | |
| Interest Expense | $1,023 | $1,004 | $985 | $967 | $948 | $929 | $910 | $892 | $873 | $854 | $835 | $817 | |
| Taxes Incurred | $7,418 | $11,639 | $13,549 | $14,703 | $6,211 | $966 | ($3,618) | ($3,267) | ($3,067) | ($2,716) | ($2,711) | ($2,705) | |
| Net Profit | $17,309 | $27,157 | $31,615 | $34,306 | $14,491 | $2,255 | ($8,442) | ($7,624) | ($7,156) | ($6,338) | ($6,325) | ($6,312) | |
| Net Profit/Sales | 38.46% | 41.78% | 42.15% | 40.36% | 30.83% | 9.39% | 0.00% | 0.00% | 0.00% | 0.00% | 0.00% | 0.00% | |
| Pro Forma Cash Flow | |||||||||||||
| Month 1 | Month 2 | Month 3 | Month 4 | Month 5 | Month 6 | Month 7 | Month 8 | Month 9 | Month 10 | Month 11 | Month 12 | ||
| Cash Received | |||||||||||||
| Cash from Operations | |||||||||||||
| Cash Sales | $6,750 | $9,750 | $11,250 | $12,750 | $7,050 | $3,600 | $0 | $0 | $0 | $0 | $0 | $0 | |
| Cash from Receivables | $0 | $1,275 | $38,817 | $55,533 | $64,033 | $71,173 | $39,298 | $19,720 | $0 | $0 | $0 | $0 | |
| Subtotal Cash from Operations | $6,750 | $11,025 | $50,067 | $68,283 | $71,083 | $74,773 | $39,298 | $19,720 | $0 | $0 | $0 | $0 | |
| Additional Cash Received | |||||||||||||
| Sales Tax, VAT, HST/GST Received | 0.00% | $0 | $0 | $0 | $0 | $0 | $0 | $0 | $0 | $0 | $0 | $0 | $0 |
| New Current Borrowing | $0 | $0 | $0 | $0 | $0 | $0 | $0 | $0 | $0 | $0 | $0 | $0 | |
| New Other Liabilities (interest-free) | $0 | $0 | $0 | $0 | $0 | $0 | $0 | $0 | $0 | $0 | $0 | $0 | |
| New Long-term Liabilities | $0 | $0 | $0 | $0 | $0 | $0 | $0 | $0 | $0 | $0 | $0 | $0 | |
| Sales of Other Current Assets | $0 | $0 | $0 | $0 | $0 | $0 | $0 | $0 | $0 | $0 | $0 | $0 | |
| Sales of Long-term Assets | $0 | $0 | $0 | $0 | $0 | $0 | $0 | $0 | $0 | $0 | $0 | $0 | |
| New Investment Received | $0 | $0 | $0 | $20,000 | $0 | $0 | $0 | $0 | $0 | $0 | $0 | $0 | |
| Subtotal Cash Received | $6,750 | $11,025 | $50,067 | $88,283 | $71,083 | $74,773 | $39,298 | $19,720 | $0 | $0 | $0 | $0 | |
| Expenditures | Month 1 | Month 2 | Month 3 | Month 4 | Month 5 | Month 6 | Month 7 | Month 8 | Month 9 | Month 10 | Month 11 | Month 12 | |
| Expenditures from Operations | |||||||||||||
| Cash Spending | $0 | $0 | $500 | $1,500 | $3,000 | $3,000 | $3,000 | $2,000 | $1,000 | $0 | $0 | $0 | |
| Bill Payments | $1,411 | $42,404 | $44,301 | $46,195 | $51,110 | $16,588 | $11,142 | $5,248 | $5,435 | $5,762 | $5,937 | $5,924 | |
| Subtotal Spent on Operations | $1,411 | $42,404 | $44,801 | $47,695 | $54,110 | $19,588 | $14,142 | $7,248 | $6,435 | $5,762 | $5,937 | $5,924 | |
| Additional Cash Spent | |||||||||||||
| Sales Tax, VAT, HST/GST Paid Out | $0 | $0 | $0 | $0 | $0 | $0 | $0 | $0 | $0 | $0 | $0 | $0 | |
| Principal Repayment of Current Borrowing | $1,000 | $1,000 | $1,000 | $1,000 | $1,000 | $1,000 | $1,000 | $1,000 | $1,000 | $1,000 | $1,000 | $1,000 | |
| Other Liabilities Principal Repayment | $0 | $0 | $0 | $0 | $0 | $0 | $0 | $0 | $0 | $0 | $0 | $0 | |
| Long-term Liabilities Principal Repayment | $1,250 | $1,250 | $1,250 | $1,250 | $1,250 | $1,250 | $1,250 | $1,250 | $1,250 | $1,250 | $1,250 | $1,250 | |
| Purchase Other Current Assets | $0 | $0 | $0 | $0 | $0 | $0 | $0 | $0 | $0 | $0 | $0 | $0 | |
| Purchase Long-term Assets | $2,000 | $2,000 | $2,000 | $2,000 | $2,000 | $2,000 | $2,000 | $2,000 | $2,000 | $2,000 | $2,000 | $2,000 | |
| Dividends | $0 | $0 | $0 | $0 | $0 | $0 | $0 | $0 | $0 | $0 | $0 | $0 | |
| Subtotal Cash Spent | $5,661 | $46,654 | $49,051 | $51,945 | $58,360 | $23,838 | $18,392 | $11,498 | $10,685 | $10,012 | $10,187 | $10,174 | |
| Net Cash Flow | $1,089 | ($35,629) | $1,016 | $36,338 | $12,723 | $50,936 | $20,906 | $8,222 | ($10,685) | ($10,012) | ($10,187) | ($10,174) | |
| Cash Balance | $128,809 | $93,179 | $94,195 | $130,533 | $143,256 | $194,192 | $215,098 | $223,320 | $212,635 | $202,623 | $192,435 | $182,261 | |
| Pro Forma Balance Sheet | |||||||||||||
| Month 1 | Month 2 | Month 3 | Month 4 | Month 5 | Month 6 | Month 7 | Month 8 | Month 9 | Month 10 | Month 11 | Month 12 | ||
| Assets | Starting Balances | ||||||||||||
| Current Assets | |||||||||||||
| Cash | $127,720 | $128,809 | $93,179 | $94,195 | $130,533 | $143,256 | $194,192 | $215,098 | $223,320 | $212,635 | $202,623 | $192,435 | $182,261 |
| Accounts Receivable | $0 | $38,250 | $92,225 | $117,158 | $133,875 | $109,792 | $59,018 | $19,720 | $0 | $0 | $0 | $0 | $0 |
| Inventory | $0 | $14,850 | $21,450 | $24,750 | $28,050 | $15,510 | $8,310 | $8,310 | $8,310 | $8,310 | $8,310 | $8,310 | $8,310 |
| Other Current Assets | $0 | $0 | $0 | $0 | $0 | $0 | $0 | $0 | $0 | $0 | $0 | $0 | $0 |
| Total Current Assets | $127,720 | $181,909 | $206,854 | $236,103 | $292,458 | $268,558 | $261,520 | $243,128 | $231,630 | $220,945 | $210,933 | $200,745 | $190,571 |
| Long-term Assets | |||||||||||||
| Long-term Assets | $140,280 | $142,280 | $144,280 | $146,280 | $148,280 | $150,280 | $152,280 | $154,280 | $156,280 | $158,280 | $160,280 | $162,280 | $164,280 |
| Accumulated Depreciation | $0 | $200 | $400 | $600 | $800 | $1,000 | $1,200 | $1,400 | $1,600 | $2,000 | $2,400 | $2,800 | $3,200 |
| Total Long-term Assets | $140,280 | $142,080 | $143,880 | $145,680 | $147,480 | $149,280 | $151,080 | $152,880 | $154,680 | $156,280 | $157,880 | $159,480 | $161,080 |
| Total Assets | $268,000 | $323,989 | $350,734 | $381,783 | $439,938 | $417,838 | $412,600 | $396,008 | $386,310 | $377,225 | $368,813 | $360,225 | $351,651 |
| Liabilities and Capital | Month 1 | Month 2 | Month 3 | Month 4 | Month 5 | Month 6 | Month 7 | Month 8 | Month 9 | Month 10 | Month 11 | Month 12 | |
| Current Liabilities | |||||||||||||
| Accounts Payable | $0 | $40,930 | $42,768 | $44,452 | $50,551 | $16,210 | $10,967 | $5,068 | $5,243 | $5,564 | $5,740 | $5,727 | $5,715 |
| Current Borrowing | $25,000 | $24,000 | $23,000 | $22,000 | $21,000 | $20,000 | $19,000 | $18,000 | $17,000 | $16,000 | $15,000 | $14,000 | $13,000 |
| Other Current Liabilities | $25,000 | $25,000 | $25,000 | $25,000 | $25,000 | $25,000 | $25,000 | $25,000 | $25,000 | $25,000 | $25,000 | $25,000 | $25,000 |
| Subtotal Current Liabilities | $50,000 | $89,930 | $90,768 | $91,452 | $96,551 | $61,210 | $54,967 | $48,068 | $47,243 | $46,564 | $45,740 | $44,727 | $43,715 |
| Long-term Liabilities | $100,000 | $98,750 | $97,500 | $96,250 | $95,000 | $93,750 | $92,500 | $91,250 | $90,000 | $88,750 | $87,500 | $86,250 | $85,000 |
| Total Liabilities | $150,000 | $188,680 | $188,268 | $187,702 | $191,551 | $154,960 | $147,467 | $139,318 | $137,243 | $135,314 | $133,240 | $130,977 | $128,715 |
| Paid-in Capital | $175,000 | $175,000 | $175,000 | $175,000 | $195,000 | $195,000 | $195,000 | $195,000 | $195,000 | $195,000 | $195,000 | $195,000 | $195,000 |
| Retained Earnings | ($57,000) | ($57,000) | ($57,000) | ($57,000) | ($57,000) | ($57,000) | ($57,000) | ($57,000) | ($57,000) | ($57,000) | ($57,000) | ($57,000) | ($57,000) |
| Earnings | $0 | $17,309 | $44,466 | $76,081 | $110,387 | $124,879 | $127,133 | $118,691 | $111,067 | $103,911 | $97,573 | $91,248 | $84,936 |
| Total Capital | $118,000 | $135,309 | $162,466 | $194,081 | $248,387 | $262,879 | $265,133 | $256,691 | $249,067 | $241,911 | $235,573 | $229,248 | $222,936 |
| Total Liabilities and Capital | $268,000 | $323,989 | $350,734 | $381,783 | $439,938 | $417,838 | $412,600 | $396,008 | $386,310 | $377,225 | $368,813 | $360,225 | $351,651 |
| Net Worth | $118,000 | $135,309 | $162,466 | $194,081 | $248,387 | $262,879 | $265,133 | $256,691 | $249,067 | $241,911 | $235,573 | $229,248 | $222,936 |

