
The Pasta Tree
Executive Summary
The Pasta Tree is the only fresh pasta retail producer in the city of Springfield. For the past three years, the company has sold its fresh pasta products out of its own storefront and in the city’s five natural food stores. The company has built a loyal consumer base with customers that have increased sales by 15% each year for the past three years. This year, The Pasta Tree will gross more than $300,000 in sales. This was generated from an initial investment of $80,000.
The Pasta Tree is planning to expand its operation to include distribution to the major supermarket chains within the entire city. There are fifteen major supermarkets that operate in Springfield and over thirty-five smaller grocery stores that serve the metro and expanding suburban communities. To meet the increased product demand, The Pasta Tree will have to double production. Owner funding and internally generated cash flow will enable only a portion of the expansion plan. The Pasta Tree will secure a $50,000 loan to fund the expansion of its production facility. Sales projections for the next three years are based on current sales success with the target customer base in Springfield.
This plan will result in sales revenues growing to almost $420,000 by Year 3.
The Pasta Tree is located in a 3,000 square feet facility that operates as a storefront and a production facility. With the expansion, 3/4 of the area will be dedicated to production. The preparation of the new production space will cost $10,000. The new equipment will cost an additional $30,000. The company will also have to upgrade its packaging equipment to meet the new demand. This will cost $10,000.
The Pasta Tree will embark on a new marketing program in supermarkets and grocery stores that will be carrying its products. Eye catching in-store displays have been created to attract new customers. The displays will also hold discount coupons to promote sales to new customers.
In conjunction with the introduction of the products, The Pasta Tree will be a major sponsor of the Canal Run which raises funds for children’s cancer research.
1.1 Objectives
The objectives of The Pasta Tree are the following:
- Expand production facility without compromising product quality.
- Establish strong sales in the city’s major supermarket chains.
- Maintain tight control of cost and operation during expansion.
1.2 Mission
The Pasta Tree’s mission is as follows:
- Quality: Our products are the highest quality and the freshest pasta available to the consumers.
- Value: We offer greater value to the consumer with nutritious products that have tremendous flavor.
- Integrity: Our customers depend on the quality of our pasta products. Our commitment to the highest standard is the foundation of our customers trust in The Pasta Tree. We promise our customer that they will never be disappointed with our products.
Company Summary
The Pasta Tree has built a reputation on offering the most delicious, nutritious pasta products. The business will operate as a general partnership with Jill Forman and John Wingate both performing management responsibilities.
2.1 Company Ownership
The Pasta Tree is owned by Jill Forman and John Wingate.
2.2 Company History
The Pasta Tree’s first products were created in the kitchen of Jill Forman. It was in her kitchen that she first created fresh pasta that was used in a part-time catering business operated by John Wingate and herself.
Customers quickly began to request special orders of the pasta products. They proved to be so popular that Jill and John pooled their resources and began The Pasta Tree. They opened a storefront and began to sell directly to the public.
After one year of operation, John was successful in getting the city’s natural food stores to carry The Pasta Tree products. Over the last two years, The Pasta Tree’s products have become popular in upscale natural food stores in Springfield.
The Pasta Tree’s operations has expanded dramatically over the past three years. What was initially a two person operation has expanded to now include a staff of four in production, delivery, and sales.
The following table and chart illustrates the sales success of The Pasta Tree.

| Past Performance | |||
| FY 2000 | FY 2001 | FY 2002 | |
| Sales | $155,000 | $178,250 | $200,000 |
| Gross Margin | $60,000 | $70,000 | $80,000 |
| Gross Margin % | 38.71% | 39.27% | 40.00% |
| Operating Expenses | $100,000 | $105,000 | $110,000 |
| Collection Period (days) | 35 | 35 | 39 |
| Inventory Turnover | 15.00 | 15.00 | 15.00 |
| Balance Sheet | |||
| FY 2000 | FY 2001 | FY 2002 | |
| Current Assets | |||
| Cash | $20,000 | $30,000 | $70,000 |
| Accounts Receivable | $10,000 | $12,000 | $14,000 |
| Inventory | $8,000 | $8,000 | $8,000 |
| Other Current Assets | $0 | $0 | $5,000 |
| Total Current Assets | $38,000 | $50,000 | $97,000 |
| Long-term Assets | |||
| Long-term Assets | $0 | $0 | $36,736 |
| Accumulated Depreciation | $0 | $0 | $5,248 |
| Total Long-term Assets | $0 | $0 | $31,488 |
| Total Assets | $38,000 | $50,000 | $128,488 |
| Current Liabilities | |||
| Accounts Payable | $3,000 | $7,000 | $10,000 |
| Current Borrowing | $2,000 | $4,000 | $3,000 |
| Other Current Liabilities (interest free) | $0 | $0 | $0 |
| Total Current Liabilities | $5,000 | $11,000 | $13,000 |
| Long-term Liabilities | $30,000 | $20,000 | $10,000 |
| Total Liabilities | $35,000 | $31,000 | $23,000 |
| Paid-in Capital | $20,000 | $10,000 | $0 |
| Retained Earnings | ($17,000) | $9,000 | $81,488 |
| Earnings | $0 | $0 | $24,000 |
| Total Capital | $3,000 | $19,000 | $105,488 |
| Total Capital and Liabilities | $38,000 | $50,000 | $128,488 |
| Other Inputs | |||
| Payment Days | 30 | 30 | 30 |
| Sales on Credit | $105,000 | $114,000 | $123,000 |
| Receivables Turnover | 10.50 | 9.50 | 8.79 |
2.3 Company Locations and Facilities
The Pasta Tree is located on 1234 Main St. The storefront is 3,000 square feet with 2/3 of the area dedicated to production. The location is perfect for foot traffic and there is quick access to the city’s freeway system.
Products
The Pasta Tree offers the following products:
- Fettuccine;
- Linguini;
- Spaghettini;
- Spinach linguini;
- Tomato fettuccine;
- Tricolor fusilli;
- New mexico chile linguini;
- Black linguini;
- Basil spaghettini;
- Cayenne tagliolini;
- Black and white spaghettini.
Market Analysis Summary
The population in Springfield has grown by 5% over the past five years. The current population stands at over 250,000. It is projected that the population will continue its growth pattern for the next three years and will eventually reach over 280,000.
There are fifteen major supermarkets that operate in Springfield and over thirty-five smaller grocery stores that serve the metro and expanding suburban communities. Approximately 60% of these stores serve communities that are made up predominantly of urban professionals. The Pasta Tree has identified the upscale shopper as the target customer for the fresh pasta products.
4.1 Market Segmentation
The Pasta Tree has identified two store types where the products will reach the target customers:
- Supermarkets: The volume of activity in these stores creates tremendous opportunity for The Pasta Tree. The supermarkets have been losing market share steadily to smaller stores that offer the customers products that the larger stores don’t carry. Though the price of the products ($3.00 for a serving for two) is higher than dry pasta products, it is still affordable to most shoppers.
- Smaller Grocery Stores: These stores serve customers in specific communities. These also include speciality stores like wine shops and fish markets where the product line would fit in nicely.
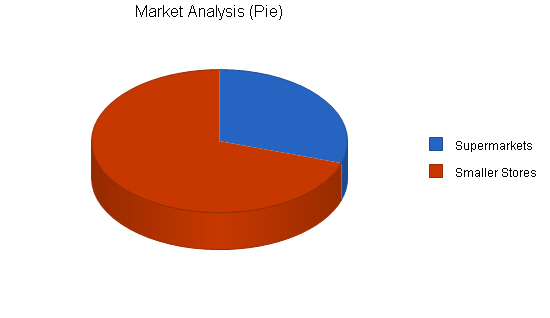
| Market Analysis | |||||||
| 2002 | 2003 | 2004 | 2005 | 2006 | |||
| Potential Customers | Growth | CAGR | |||||
| Supermarkets | 5% | 15 | 16 | 17 | 18 | 19 | 6.09% |
| Smaller Stores | 5% | 35 | 37 | 39 | 41 | 43 | 5.28% |
| Total | 5.53% | 50 | 53 | 56 | 59 | 62 | 5.53% |
4.2 Target Market Segment Strategy
The Pasta Tree’s marketing will focus on the urban professional segment, which has little time to prepare dinner and will be attracted to quality and freshness of The Pasta Tree products. The pasta products are ready to eat in half the time of dry pasta (one to three minutes) and are fresher than the competition. This gives The Pasta Tree products a decidedly better taste and consistency.
4.3 Service Business Analysis
Pasta is a staple in a supermarket with a number of products and brands to pick from. Most of the competition is in dry pasta. Fresh pasta has a much shorter shelf life (about 30 days) so there is less competition in products. Currently, several large food companies offer a limited line of fresh pasta products. Though fresh, these products are only slightly better than dry pasta and really only offer reduced preparation time. As a local product, The Pasta Tree can offer better quality and better packaging of fresh pasta.

4.3.1 Competition and Buying Patterns
The Pasta Tree products will be displayed in the deli case of the supermarkets. The only competition in this section are two other product lines whose packaging is boxy and unattractive. To improve the ability to transport the product, these pasta products have been folded into a small container. The Pasta Tree products are not folded and are wrapped in an air-tight colorful plastic package. Their presentation is similar to the dry pasta packaging which is important to consumers. No one wants their fettuccine folded.
Strategy and Implementation Summary
The strategy of The Pasta Tree will be to initially push our three most popular sellers; fettuccine, linguini, and spaghettini. Our plan is to introduce the rest of The Pasta Tree’s product line as sales increase and we can negotiate more cooler space for products.
5.1 Marketing Strategy
The Pasta Tree will advertise its products with a 20% off regular price coupon during the first month of the product being introduced into the supermarkets. The Pasta Tree will use in-store displays that will hold the coupons and attract customer attention.
In addition, The Pasta Tree will be a major sponsor of the city’s Canal Run that raises money for children’s cancer research. The run will occur the first weekend the products have been introduced into supermarkets. The Pasta Tree will distribute discount coupons at the event.
5.2 Sales Strategy
The sales strategy is to present our products as an affordable upscale dinner item that is quick to make and tastier than our dry competition.
5.2.1 Sales Forecast
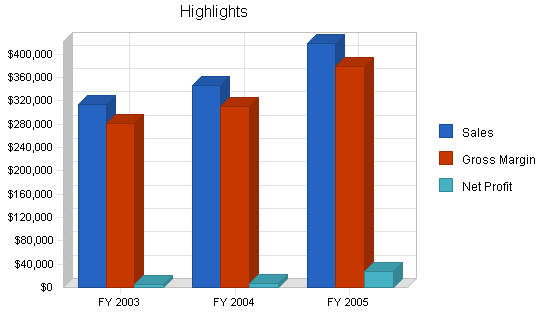
The following table and charts show the rapid ramp-up of sales during the next twelve months of operation.

| Sales Forecast | |||
| FY 2003 | FY 2004 | FY 2005 | |
| Sales | |||
| Supermarkets | $128,000 | $143,000 | $173,000 |
| Grocery Stores | $185,000 | $203,000 | $246,000 |
| Total Sales | $313,000 | $346,000 | $419,000 |
| Direct Cost of Sales | FY 2003 | FY 2004 | FY 2005 |
| Supermarkets | $12,800 | $15,000 | $16,400 |
| Grocery Stores | $18,500 | $20,300 | $23,900 |
| Subtotal Direct Cost of Sales | $31,300 | $35,300 | $40,300 |
5.3 Milestones
The accompanying table and chart shows specific milestones, with responsibilities assigned, dates, and budgets. We are focusing on a few key milestones that should be accomplished.
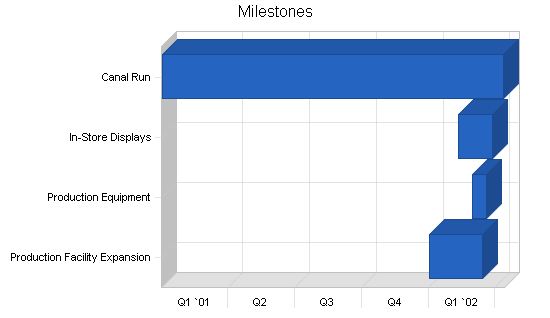
| Milestones | |||||
| Milestone | Start Date | End Date | Budget | Manager | Department |
| Production Facility Expansion | 1/1/2002 | 3/15/2002 | $10,000 | Jill Forman | Production |
| Production Equipment | 3/1/2002 | 3/20/2002 | $40,000 | Jill Forman | Production |
| In-Store Displays | 2/10/2002 | 3/28/2002 | $5,000 | John Wingate | Sales |
| Canal Run | 1/1/2001 | 4/12/2002 | $1,000 | John Wingate | Sales |
| Totals | $56,000 | ||||
Management Summary
Co-owners, Jill Forman and John Wingate, currently manage the daily operation of The Pasta Tree. Jill is responsible for production and distribution, while John works as the sales manager.
Jill and John have fifteen years of experience working in food production and sales.
Jill Forman was one of the owners of the Mason Peak Deli, 4th and Tyler. Jill managed the deli for five years, eventually starting a catering business with John Wingate in 1997.
John Wingate was a salesperson for Sunburst Natural Foods for ten years. At the time he started the catering business with Jill, John annual sales had reached $1 million dollars.
6.1 Personnel Plan
The personnel plan for The Pasta Tree is as follows:
- Production manager;
- Sales manager;
- Production staff (4 total, 2 new hires);
- Store staff (1 new hire);
- Delivery staff/sales (1 new hire).
| Personnel Plan | |||
| FY 2003 | FY 2004 | FY 2005 | |
| Production Manager | $36,000 | $38,880 | $44,712 |
| Sales Manager | $36,000 | $38,880 | $44,712 |
| Production Staff | $81,600 | $88,128 | $101,347 |
| Delivery | $24,000 | $25,920 | $29,808 |
| Store Staff | $21,600 | $23,328 | $26,827 |
| Total People | 8 | 8 | 8 |
| Total Payroll | $199,200 | $215,136 | $247,406 |
Financial Plan
The following is financial plan for The Pasta Tree.
7.1 Break-even Analysis
The monthly break-even point is $24,989.
.

| Break-even Analysis | |
| Monthly Revenue Break-even | $24,989 |
| Assumptions: | |
| Average Percent Variable Cost | 10% |
| Estimated Monthly Fixed Cost | $22,490 |
7.2 Projected Profit and Loss
The following table and charts are the projected profit and loss for three years.


| Pro Forma Profit and Loss | |||
| FY 2003 | FY 2004 | FY 2005 | |
| Sales | $313,000 | $346,000 | $419,000 |
| Direct Cost of Sales | $31,300 | $35,300 | $40,300 |
| Other Production Expenses | $0 | $0 | $0 |
| Total Cost of Sales | $31,300 | $35,300 | $40,300 |
| Gross Margin | $281,700 | $310,700 | $378,700 |
| Gross Margin % | 90.00% | 89.80% | 90.38% |
| Expenses | |||
| Payroll | $199,200 | $215,136 | $247,406 |
| Sales and Marketing and Other Expenses | $6,000 | $8,000 | $10,000 |
| Depreciation | $9,600 | $9,600 | $9,600 |
| Leased Equipment | $0 | $0 | $0 |
| Utilities | $3,600 | $12,000 | $12,000 |
| Insurance | $9,600 | $9,600 | $9,600 |
| Rent | $12,000 | $12,000 | $12,000 |
| Payroll Taxes | $29,880 | $32,270 | $37,111 |
| Other | $0 | $0 | $0 |
| Total Operating Expenses | $269,880 | $298,606 | $337,717 |
| Profit Before Interest and Taxes | $11,820 | $12,094 | $40,983 |
| EBITDA | $21,420 | $21,694 | $50,583 |
| Interest Expense | $4,760 | $3,405 | $1,715 |
| Taxes Incurred | $2,118 | $2,607 | $11,780 |
| Net Profit | $4,942 | $6,082 | $27,488 |
| Net Profit/Sales | 1.58% | 1.76% | 6.56% |
7.3 Projected Cash Flow
The following table and chart are the projected cash flow for three years.

| Pro Forma Cash Flow | |||
| FY 2003 | FY 2004 | FY 2005 | |
| Cash Received | |||
| Cash from Operations | |||
| Cash Sales | $78,250 | $86,500 | $104,750 |
| Cash from Receivables | $203,750 | $254,756 | $303,755 |
| Subtotal Cash from Operations | $282,000 | $341,256 | $408,505 |
| Additional Cash Received | |||
| Sales Tax, VAT, HST/GST Received | $0 | $0 | $0 |
| New Current Borrowing | $0 | $0 | $0 |
| New Other Liabilities (interest-free) | $0 | $0 | $0 |
| New Long-term Liabilities | $50,000 | $0 | $0 |
| Sales of Other Current Assets | $0 | $0 | $0 |
| Sales of Long-term Assets | $0 | $0 | $0 |
| New Investment Received | $0 | $0 | $0 |
| Subtotal Cash Received | $332,000 | $341,256 | $408,505 |
| Expenditures | FY 2003 | FY 2004 | FY 2005 |
| Expenditures from Operations | |||
| Cash Spending | $199,200 | $215,136 | $247,406 |
| Bill Payments | $94,829 | $115,954 | $133,454 |
| Subtotal Spent on Operations | $294,029 | $331,090 | $380,860 |
| Additional Cash Spent | |||
| Sales Tax, VAT, HST/GST Paid Out | $0 | $0 | $0 |
| Principal Repayment of Current Borrowing | $1,200 | $1,200 | $600 |
| Other Liabilities Principal Repayment | $0 | $0 | $0 |
| Long-term Liabilities Principal Repayment | $18,000 | $18,300 | $13,700 |
| Purchase Other Current Assets | $0 | $0 | $0 |
| Purchase Long-term Assets | $0 | $0 | $0 |
| Dividends | $0 | $0 | $0 |
| Subtotal Cash Spent | $313,229 | $350,590 | $395,160 |
| Net Cash Flow | $18,771 | ($9,335) | $13,345 |
| Cash Balance | $88,771 | $79,437 | $92,781 |
7.4 Projected Balance Sheet
The following table shows the projected balance sheet for three years.
| Pro Forma Balance Sheet | |||
| FY 2003 | FY 2004 | FY 2005 | |
| Assets | |||
| Current Assets | |||
| Cash | $88,771 | $79,437 | $92,781 |
| Accounts Receivable | $45,000 | $49,744 | $60,240 |
| Inventory | $3,410 | $3,846 | $4,391 |
| Other Current Assets | $5,000 | $5,000 | $5,000 |
| Total Current Assets | $142,181 | $138,027 | $162,412 |
| Long-term Assets | |||
| Long-term Assets | $36,736 | $36,736 | $36,736 |
| Accumulated Depreciation | $14,848 | $24,448 | $34,048 |
| Total Long-term Assets | $21,888 | $12,288 | $2,688 |
| Total Assets | $164,069 | $150,315 | $165,100 |
| Liabilities and Capital | FY 2003 | FY 2004 | FY 2005 |
| Current Liabilities | |||
| Accounts Payable | $9,839 | $9,503 | $11,100 |
| Current Borrowing | $1,800 | $600 | $0 |
| Other Current Liabilities | $0 | $0 | $0 |
| Subtotal Current Liabilities | $11,639 | $10,103 | $11,100 |
| Long-term Liabilities | $42,000 | $23,700 | $10,000 |
| Total Liabilities | $53,639 | $33,803 | $21,100 |
| Paid-in Capital | $0 | $0 | $0 |
| Retained Earnings | $105,488 | $110,430 | $116,512 |
| Earnings | $4,942 | $6,082 | $27,488 |
| Total Capital | $110,430 | $116,512 | $144,000 |
| Total Liabilities and Capital | $164,069 | $150,315 | $165,100 |
| Net Worth | $110,430 | $116,512 | $144,000 |
7.5 Business Ratios
Business ratios for the years of this plan are shown below. Industry profile ratios based on the Standard Industrial Classification (SIC) code 5149, Groceries and related products, are shown for comparison.
| Ratio Analysis | ||||
| FY 2003 | FY 2004 | FY 2005 | Industry Profile | |
| Sales Growth | 56.50% | 10.54% | 21.10% | 4.60% |
| Percent of Total Assets | ||||
| Accounts Receivable | 27.43% | 33.09% | 36.49% | 33.30% |
| Inventory | 2.08% | 2.56% | 2.66% | 26.00% |
| Other Current Assets | 3.05% | 3.33% | 3.03% | 20.90% |
| Total Current Assets | 86.66% | 91.83% | 98.37% | 80.20% |
| Long-term Assets | 13.34% | 8.17% | 1.63% | 19.80% |
| Total Assets | 100.00% | 100.00% | 100.00% | 100.00% |
| Current Liabilities | 7.09% | 6.72% | 6.72% | 45.20% |
| Long-term Liabilities | 25.60% | 15.77% | 6.06% | 10.00% |
| Total Liabilities | 32.69% | 22.49% | 12.78% | 55.20% |
| Net Worth | 67.31% | 77.51% | 87.22% | 44.80% |
| Percent of Sales | ||||
| Sales | 100.00% | 100.00% | 100.00% | 100.00% |
| Gross Margin | 90.00% | 89.80% | 90.38% | 44.10% |
| Selling, General & Administrative Expenses | 88.44% | 88.08% | 83.95% | 26.70% |
| Advertising Expenses | 1.92% | 2.31% | 2.39% | 0.70% |
| Profit Before Interest and Taxes | 3.78% | 3.50% | 9.78% | 0.80% |
| Main Ratios | ||||
| Current | 12.22 | 13.66 | 14.63 | 1.69 |
| Quick | 11.92 | 13.28 | 14.24 | 1.01 |
| Total Debt to Total Assets | 32.69% | 22.49% | 12.78% | 55.20% |
| Pre-tax Return on Net Worth | 6.39% | 7.46% | 27.27% | 3.60% |
| Pre-tax Return on Assets | 4.30% | 5.78% | 23.78% | 8.00% |
| Additional Ratios | FY 2003 | FY 2004 | FY 2005 | |
| Net Profit Margin | 1.58% | 1.76% | 6.56% | n.a |
| Return on Equity | 4.48% | 5.22% | 19.09% | n.a |
| Activity Ratios | ||||
| Accounts Receivable Turnover | 5.22 | 5.22 | 5.22 | n.a |
| Collection Days | 58 | 67 | 64 | n.a |
| Inventory Turnover | 9.76 | 9.73 | 9.79 | n.a |
| Accounts Payable Turnover | 9.62 | 12.17 | 12.17 | n.a |
| Payment Days | 30 | 31 | 28 | n.a |
| Total Asset Turnover | 1.91 | 2.30 | 2.54 | n.a |
| Debt Ratios | ||||
| Debt to Net Worth | 0.49 | 0.29 | 0.15 | n.a |
| Current Liab. to Liab. | 0.22 | 0.30 | 0.53 | n.a |
| Liquidity Ratios | ||||
| Net Working Capital | $130,542 | $127,924 | $151,312 | n.a |
| Interest Coverage | 2.48 | 3.55 | 23.90 | n.a |
| Additional Ratios | ||||
| Assets to Sales | 0.52 | 0.43 | 0.39 | n.a |
| Current Debt/Total Assets | 7% | 7% | 7% | n.a |
| Acid Test | 8.06 | 8.36 | 8.81 | n.a |
| Sales/Net Worth | 2.83 | 2.97 | 2.91 | n.a |
| Dividend Payout | 0.00 | 0.00 | 0.00 | n.a |
Appendix
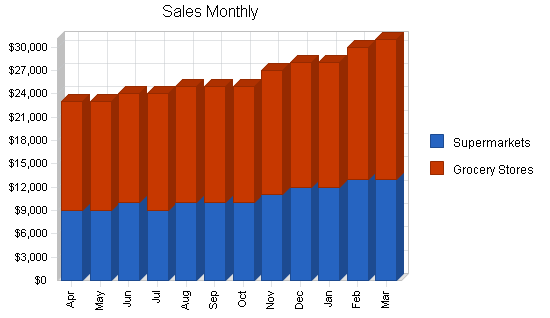
| Sales Forecast | |||||||||||||
| Apr | May | Jun | Jul | Aug | Sep | Oct | Nov | Dec | Jan | Feb | Mar | ||
| Sales | |||||||||||||
| Supermarkets | 0% | $9,000 | $9,000 | $10,000 | $9,000 | $10,000 | $10,000 | $10,000 | $11,000 | $12,000 | $12,000 | $13,000 | $13,000 |
| Grocery Stores | 0% | $14,000 | $14,000 | $14,000 | $15,000 | $15,000 | $15,000 | $15,000 | $16,000 | $16,000 | $16,000 | $17,000 | $18,000 |
| Total Sales | $23,000 | $23,000 | $24,000 | $24,000 | $25,000 | $25,000 | $25,000 | $27,000 | $28,000 | $28,000 | $30,000 | $31,000 | |
| Direct Cost of Sales | Apr | May | Jun | Jul | Aug | Sep | Oct | Nov | Dec | Jan | Feb | Mar | |
| Supermarkets | $900 | $900 | $1,000 | $900 | $1,000 | $1,000 | $1,000 | $1,100 | $1,200 | $1,200 | $1,300 | $1,300 | |
| Grocery Stores | $1,400 | $1,400 | $1,400 | $1,500 | $1,500 | $1,500 | $1,500 | $1,600 | $1,600 | $1,600 | $1,700 | $1,800 | |
| Subtotal Direct Cost of Sales | $2,300 | $2,300 | $2,400 | $2,400 | $2,500 | $2,500 | $2,500 | $2,700 | $2,800 | $2,800 | $3,000 | $3,100 | |
| Personnel Plan | |||||||||||||
| Apr | May | Jun | Jul | Aug | Sep | Oct | Nov | Dec | Jan | Feb | Mar | ||
| Production Manager | 0% | $3,000 | $3,000 | $3,000 | $3,000 | $3,000 | $3,000 | $3,000 | $3,000 | $3,000 | $3,000 | $3,000 | $3,000 |
| Sales Manager | 0% | $3,000 | $3,000 | $3,000 | $3,000 | $3,000 | $3,000 | $3,000 | $3,000 | $3,000 | $3,000 | $3,000 | $3,000 |
| Production Staff | 0% | $6,800 | $6,800 | $6,800 | $6,800 | $6,800 | $6,800 | $6,800 | $6,800 | $6,800 | $6,800 | $6,800 | $6,800 |
| Delivery | 0% | $2,000 | $2,000 | $2,000 | $2,000 | $2,000 | $2,000 | $2,000 | $2,000 | $2,000 | $2,000 | $2,000 | $2,000 |
| Store Staff | 0% | $1,800 | $1,800 | $1,800 | $1,800 | $1,800 | $1,800 | $1,800 | $1,800 | $1,800 | $1,800 | $1,800 | $1,800 |
| Total People | 8 | 8 | 8 | 8 | 8 | 8 | 8 | 8 | 8 | 8 | 8 | 8 | |
| Total Payroll | $16,600 | $16,600 | $16,600 | $16,600 | $16,600 | $16,600 | $16,600 | $16,600 | $16,600 | $16,600 | $16,600 | $16,600 | |
| General Assumptions | |||||||||||||
| Apr | May | Jun | Jul | Aug | Sep | Oct | Nov | Dec | Jan | Feb | Mar | ||
| Plan Month | 1 | 2 | 3 | 4 | 5 | 6 | 7 | 8 | 9 | 10 | 11 | 12 | |
| Current Interest Rate | 10.00% | 10.00% | 10.00% | 10.00% | 10.00% | 10.00% | 10.00% | 10.00% | 10.00% | 10.00% | 10.00% | 10.00% | |
| Long-term Interest Rate | 10.00% | 10.00% | 10.00% | 10.00% | 10.00% | 10.00% | 10.00% | 10.00% | 10.00% | 10.00% | 10.00% | 10.00% | |
| Tax Rate | 30.00% | 30.00% | 30.00% | 30.00% | 30.00% | 30.00% | 30.00% | 30.00% | 30.00% | 30.00% | 30.00% | 30.00% | |
| Other | 0 | 0 | 0 | 0 | 0 | 0 | 0 | 0 | 0 | 0 | 0 | 0 | |
| Pro Forma Profit and Loss | |||||||||||||
| Apr | May | Jun | Jul | Aug | Sep | Oct | Nov | Dec | Jan | Feb | Mar | ||
| Sales | $23,000 | $23,000 | $24,000 | $24,000 | $25,000 | $25,000 | $25,000 | $27,000 | $28,000 | $28,000 | $30,000 | $31,000 | |
| Direct Cost of Sales | $2,300 | $2,300 | $2,400 | $2,400 | $2,500 | $2,500 | $2,500 | $2,700 | $2,800 | $2,800 | $3,000 | $3,100 | |
| Other Production Expenses | $0 | $0 | $0 | $0 | $0 | $0 | $0 | $0 | $0 | $0 | $0 | $0 | |
| Total Cost of Sales | $2,300 | $2,300 | $2,400 | $2,400 | $2,500 | $2,500 | $2,500 | $2,700 | $2,800 | $2,800 | $3,000 | $3,100 | |
| Gross Margin | $20,700 | $20,700 | $21,600 | $21,600 | $22,500 | $22,500 | $22,500 | $24,300 | $25,200 | $25,200 | $27,000 | $27,900 | |
| Gross Margin % | 90.00% | 90.00% | 90.00% | 90.00% | 90.00% | 90.00% | 90.00% | 90.00% | 90.00% | 90.00% | 90.00% | 90.00% | |
| Expenses | |||||||||||||
| Payroll | $16,600 | $16,600 | $16,600 | $16,600 | $16,600 | $16,600 | $16,600 | $16,600 | $16,600 | $16,600 | $16,600 | $16,600 | |
| Sales and Marketing and Other Expenses | $500 | $500 | $500 | $500 | $500 | $500 | $500 | $500 | $500 | $500 | $500 | $500 | |
| Depreciation | $800 | $800 | $800 | $800 | $800 | $800 | $800 | $800 | $800 | $800 | $800 | $800 | |
| Leased Equipment | $0 | $0 | $0 | $0 | $0 | $0 | $0 | $0 | $0 | $0 | $0 | $0 | |
| Utilities | $300 | $300 | $300 | $300 | $300 | $300 | $300 | $300 | $300 | $300 | $300 | $300 | |
| Insurance | $800 | $800 | $800 | $800 | $800 | $800 | $800 | $800 | $800 | $800 | $800 | $800 | |
| Rent | $1,000 | $1,000 | $1,000 | $1,000 | $1,000 | $1,000 | $1,000 | $1,000 | $1,000 | $1,000 | $1,000 | $1,000 | |
| Payroll Taxes | 15% | $2,490 | $2,490 | $2,490 | $2,490 | $2,490 | $2,490 | $2,490 | $2,490 | $2,490 | $2,490 | $2,490 | $2,490 |
| Other | $0 | $0 | $0 | $0 | $0 | $0 | $0 | $0 | $0 | $0 | $0 | $0 | |
| Total Operating Expenses | $22,490 | $22,490 | $22,490 | $22,490 | $22,490 | $22,490 | $22,490 | $22,490 | $22,490 | $22,490 | $22,490 | $22,490 | |
| Profit Before Interest and Taxes | ($1,790) | ($1,790) | ($890) | ($890) | $10 | $10 | $10 | $1,810 | $2,710 | $2,710 | $4,510 | $5,410 | |
| EBITDA | ($990) | ($990) | ($90) | ($90) | $810 | $810 | $810 | $2,610 | $3,510 | $3,510 | $5,310 | $6,210 | |
| Interest Expense | $345 | $332 | $402 | $388 | $458 | $445 | $432 | $418 | $405 | $392 | $378 | $365 | |
| Taxes Incurred | ($641) | ($636) | ($388) | ($383) | ($135) | ($131) | ($127) | $418 | $692 | $696 | $1,240 | $1,514 | |
| Net Profit | ($1,495) | ($1,485) | ($904) | ($895) | ($314) | ($305) | ($295) | $974 | $1,614 | $1,623 | $2,892 | $3,532 | |
| Net Profit/Sales | -6.50% | -6.46% | -3.77% | -3.73% | -1.26% | -1.22% | -1.18% | 3.61% | 5.76% | 5.80% | 9.64% | 11.39% | |
| Pro Forma Cash Flow | |||||||||||||
| Apr | May | Jun | Jul | Aug | Sep | Oct | Nov | Dec | Jan | Feb | Mar | ||
| Cash Received | |||||||||||||
| Cash from Operations | |||||||||||||
| Cash Sales | $5,750 | $5,750 | $6,000 | $6,000 | $6,250 | $6,250 | $6,250 | $6,750 | $7,000 | $7,000 | $7,500 | $7,750 | |
| Cash from Receivables | $7,000 | $7,575 | $17,250 | $17,275 | $18,000 | $18,025 | $18,750 | $18,750 | $18,800 | $20,275 | $21,000 | $21,050 | |
| Subtotal Cash from Operations | $12,750 | $13,325 | $23,250 | $23,275 | $24,250 | $24,275 | $25,000 | $25,500 | $25,800 | $27,275 | $28,500 | $28,800 | |
| Additional Cash Received | |||||||||||||
| Sales Tax, VAT, HST/GST Received | 0.00% | $0 | $0 | $0 | $0 | $0 | $0 | $0 | $0 | $0 | $0 | $0 | $0 |
| New Current Borrowing | $0 | $0 | $0 | $0 | $0 | $0 | $0 | $0 | $0 | $0 | $0 | $0 | |
| New Other Liabilities (interest-free) | $0 | $0 | $0 | $0 | $0 | $0 | $0 | $0 | $0 | $0 | $0 | $0 | |
| New Long-term Liabilities | $30,000 | $0 | $10,000 | $0 | $10,000 | $0 | $0 | $0 | $0 | $0 | $0 | $0 | |
| Sales of Other Current Assets | $0 | $0 | $0 | $0 | $0 | $0 | $0 | $0 | $0 | $0 | $0 | $0 | |
| Sales of Long-term Assets | $0 | $0 | $0 | $0 | $0 | $0 | $0 | $0 | $0 | $0 | $0 | $0 | |
| New Investment Received | $0 | $0 | $0 | $0 | $0 | $0 | $0 | $0 | $0 | $0 | $0 | $0 | |
| Subtotal Cash Received | $42,750 | $13,325 | $33,250 | $23,275 | $34,250 | $24,275 | $25,000 | $25,500 | $25,800 | $27,275 | $28,500 | $28,800 | |
| Expenditures | Apr | May | Jun | Jul | Aug | Sep | Oct | Nov | Dec | Jan | Feb | Mar | |
| Expenditures from Operations | |||||||||||||
| Cash Spending | $16,600 | $16,600 | $16,600 | $16,600 | $16,600 | $16,600 | $16,600 | $16,600 | $16,600 | $16,600 | $16,600 | $16,600 | |
| Bill Payments | $10,160 | $4,794 | $4,850 | $6,769 | $7,512 | $8,020 | $7,904 | $7,927 | $8,854 | $9,093 | $9,009 | $9,936 | |
| Subtotal Spent on Operations | $26,760 | $21,394 | $21,450 | $23,369 | $24,112 | $24,620 | $24,504 | $24,527 | $25,454 | $25,693 | $25,609 | $26,536 | |
| Additional Cash Spent | |||||||||||||
| Sales Tax, VAT, HST/GST Paid Out | $0 | $0 | $0 | $0 | $0 | $0 | $0 | $0 | $0 | $0 | $0 | $0 | |
| Principal Repayment of Current Borrowing | $100 | $100 | $100 | $100 | $100 | $100 | $100 | $100 | $100 | $100 | $100 | $100 | |
| Other Liabilities Principal Repayment | $0 | $0 | $0 | $0 | $0 | $0 | $0 | $0 | $0 | $0 | $0 | $0 | |
| Long-term Liabilities Principal Repayment | $1,500 | $1,500 | $1,500 | $1,500 | $1,500 | $1,500 | $1,500 | $1,500 | $1,500 | $1,500 | $1,500 | $1,500 | |
| Purchase Other Current Assets | $0 | $0 | $0 | $0 | $0 | $0 | $0 | $0 | $0 | $0 | $0 | $0 | |
| Purchase Long-term Assets | $0 | $0 | $0 | $0 | $0 | $0 | $0 | $0 | $0 | $0 | $0 | $0 | |
| Dividends | $0 | $0 | $0 | $0 | $0 | $0 | $0 | $0 | $0 | $0 | $0 | $0 | |
| Subtotal Cash Spent | $28,360 | $22,994 | $23,050 | $24,969 | $25,712 | $26,220 | $26,104 | $26,127 | $27,054 | $27,293 | $27,209 | $28,136 | |
| Net Cash Flow | $14,390 | ($9,669) | $10,200 | ($1,694) | $8,538 | ($1,945) | ($1,104) | ($627) | ($1,254) | ($18) | $1,291 | $664 | |
| Cash Balance | $84,390 | $74,721 | $84,921 | $83,226 | $91,764 | $89,819 | $88,715 | $88,088 | $86,834 | $86,816 | $88,107 | $88,771 | |
| Pro Forma Balance Sheet | |||||||||||||
| Apr | May | Jun | Jul | Aug | Sep | Oct | Nov | Dec | Jan | Feb | Mar | ||
| Assets | Starting Balances | ||||||||||||
| Current Assets | |||||||||||||
| Cash | $70,000 | $84,390 | $74,721 | $84,921 | $83,226 | $91,764 | $89,819 | $88,715 | $88,088 | $86,834 | $86,816 | $88,107 | $88,771 |
| Accounts Receivable | $14,000 | $24,250 | $33,925 | $34,675 | $35,400 | $36,150 | $36,875 | $36,875 | $38,375 | $40,575 | $41,300 | $42,800 | $45,000 |
| Inventory | $8,000 | $5,700 | $3,400 | $2,640 | $2,640 | $2,750 | $2,750 | $2,750 | $2,970 | $3,080 | $3,080 | $3,300 | $3,410 |
| Other Current Assets | $5,000 | $5,000 | $5,000 | $5,000 | $5,000 | $5,000 | $5,000 | $5,000 | $5,000 | $5,000 | $5,000 | $5,000 | $5,000 |
| Total Current Assets | $97,000 | $119,340 | $117,046 | $127,236 | $126,266 | $135,664 | $134,444 | $133,340 | $134,433 | $135,489 | $136,196 | $139,207 | $142,181 |
| Long-term Assets | |||||||||||||
| Long-term Assets | $36,736 | $36,736 | $36,736 | $36,736 | $36,736 | $36,736 | $36,736 | $36,736 | $36,736 | $36,736 | $36,736 | $36,736 | $36,736 |
| Accumulated Depreciation | $5,248 | $6,048 | $6,848 | $7,648 | $8,448 | $9,248 | $10,048 | $10,848 | $11,648 | $12,448 | $13,248 | $14,048 | $14,848 |
| Total Long-term Assets | $31,488 | $30,688 | $29,888 | $29,088 | $28,288 | $27,488 | $26,688 | $25,888 | $25,088 | $24,288 | $23,488 | $22,688 | $21,888 |
| Total Assets | $128,488 | $150,028 | $146,934 | $156,324 | $154,554 | $163,152 | $161,132 | $159,228 | $159,521 | $159,777 | $159,684 | $161,895 | $164,069 |
| Liabilities and Capital | Apr | May | Jun | Jul | Aug | Sep | Oct | Nov | Dec | Jan | Feb | Mar | |
| Current Liabilities | |||||||||||||
| Accounts Payable | $10,000 | $4,635 | $4,626 | $6,519 | $7,245 | $7,756 | $7,641 | $7,632 | $8,551 | $8,793 | $8,678 | $9,597 | $9,839 |
| Current Borrowing | $3,000 | $2,900 | $2,800 | $2,700 | $2,600 | $2,500 | $2,400 | $2,300 | $2,200 | $2,100 | $2,000 | $1,900 | $1,800 |
| Other Current Liabilities | $0 | $0 | $0 | $0 | $0 | $0 | $0 | $0 | $0 | $0 | $0 | $0 | $0 |
| Subtotal Current Liabilities | $13,000 | $7,535 | $7,426 | $9,219 | $9,845 | $10,256 | $10,041 | $9,932 | $10,751 | $10,893 | $10,678 | $11,497 | $11,639 |
| Long-term Liabilities | $10,000 | $38,500 | $37,000 | $45,500 | $44,000 | $52,500 | $51,000 | $49,500 | $48,000 | $46,500 | $45,000 | $43,500 | $42,000 |
| Total Liabilities | $23,000 | $46,035 | $44,426 | $54,719 | $53,845 | $62,756 | $61,041 | $59,432 | $58,751 | $57,393 | $55,678 | $54,997 | $53,639 |
| Paid-in Capital | $0 | $0 | $0 | $0 | $0 | $0 | $0 | $0 | $0 | $0 | $0 | $0 | $0 |
| Retained Earnings | $81,488 | $105,488 | $105,488 | $105,488 | $105,488 | $105,488 | $105,488 | $105,488 | $105,488 | $105,488 | $105,488 | $105,488 | $105,488 |
| Earnings | $24,000 | ($1,495) | ($2,980) | ($3,884) | ($4,779) | ($5,092) | ($5,397) | ($5,692) | ($4,718) | ($3,104) | ($1,482) | $1,411 | $4,942 |
| Total Capital | $105,488 | $103,994 | $102,508 | $101,604 | $100,709 | $100,396 | $100,091 | $99,796 | $100,770 | $102,384 | $104,006 | $106,899 | $110,430 |
| Total Liabilities and Capital | $128,488 | $150,028 | $146,934 | $156,324 | $154,554 | $163,152 | $161,132 | $159,228 | $159,521 | $159,777 | $159,684 | $161,895 | $164,069 |
| Net Worth | $105,488 | $103,994 | $102,508 | $101,604 | $100,709 | $100,396 | $100,091 | $99,796 | $100,770 | $102,384 | $104,006 | $106,899 | $110,430 |

