
A Mother's Place
Executive Summary
A Mother’s Place is a new company targeted to open in downtown Santa Cruz. We will provide a family-friendly environment with high quality customer service to meet the daily emotional, physical and social well-being needs of mothers, young children and other family members.
The principal, Emili Willet, the proud mother of a nine-month-old son, wants to fulfill her passion to help and support other mothers in the community. Emili has a Master’s degree in Child Development from Harvard Graduate School and fifteen years of progressive management experience working with children and families. Most recently, she served as Chief of Operations of a childcare management company in the Silicon Valley, and as a Finance Account Manager for the largest corporate childcare center in California for Cisco Systems. The Cisco center was a start-up project to serve over 500 children, and employed 125 teachers and administrators. Emili wants to run a business that will provide a service to families, and that has a fun atmosphere, innovative and top of the line products, a supportive environment and high quality customer service. She feels that Santa Cruz lacks this service, and thus provides an excellent opportunity for her to utilize her skills, expertise and experience in child development and finance management, and at the same time, continue to exercise her passion for working with young children and families.
A Mother’s Place will provide a full range of services, including parenting and childbirthing classes, children’s play programs, “Mommy & Me” classes, fitness and yoga pre-natal classes and coordinated birthday parties. In addition, it will have a retail store with high-end products for babies and young children. All of these services and products will be provided by employees who are skilled and experienced with parenting and have child development knowledge. This place will be the ONLY company in Santa Cruz county that provides all of these services in ONE location with easy access from a freeway, convenient parking and high quality customer service.
Sales projections for A Mother’s Place are estimated to begin at $513,000 in the first year of operation, increasing to $863,000 by the end of the third year. Our net profit will increase over the next three years.

1.1 Objectives
The objectives for A Mother’s Place are outlined below:
- To demonstrate how quality juvenile products will benefit new mothers and families.
- To create a family-friendly space that provides pregnancy resources, parenting classes, playgroups and fitness programs.
- to obtain revenue of $860,000 by the end of third year of operation.
- To increase sales by 20% per year through superior customer service and word-of-mouth referrals.
- In retail sales: to have a customer return rate of 60% by the end of first year.
1.2 Goals
In order to achieve these objectives, A Mother’s Place has the following goals:
- With a strong and viable business:
- The first year of operation will bring in total revenue of $510,000.
- Second year of operation will bring in total revenue of $665,000.
- Third year of operation will bring in total revenue of $860,000.
- The company will provide services and products that have been rated as “top of the line”, and highly recommended by experts in the child development field.
- The environment of A Mother’s Place will be inviting, professional, and adhere to the highest quality customer care, promoting a strong customer base in all services the company provides.
- Sales will increase by 20% from first year to second year, through superior customer service and effective marketing strategies.
- The return rate of participants in the classes and play programs will be 15% annually.
1.3 Keys to Success
The keys to success in our business are:
- Superior Customer Service: Each employee will have experience with our products, and in parenting.
- Environment: We will provide a clean, upscale, odor-free, enjoyable environment conducive to giving professional trusting service.
- Feeding support: We will provide a nursing room to allow mothers to breastfeed or bottle feed their child in a supportive environment, thus allowing them to continue shopping.
- Convenience: We will offer clients a wide range of services in one environment.
- Location: We will provide an easily accessible location and parking for customer convenience.
- Reputation: The principal’s expertise, credibility, integrity, and knowledge from 15+ years experience of working with young children, her Master’s degree in Child Development, and her experience as a mother will establish our high reputation from the beginning.
1.4 Mission
For the community: A Mother’s Place will provide a family-friendly atmosphere in which customers will gain expertise, resources and emotional and social support through a wide range of services.
For the employees: The company will allow the staff to enjoy the satisfaction of providing quality services to young children and families.
For the business: A Mother’s Place will provide an economically viable business for the principal.
Company Summary
A Mother’s Place is a new company that will provide high-level customer service and a family-friendly environment in the following categories:
- Juvenile Products (diapers, strollers, car seats, developmentally appropriate toys & books)
- Baby registering service
- Yoga Pregnancy and childbirthing classes
- StrollerFit Franchise (Exercise with baby program)
- “Mommy & Me” and parenting support programs
- Birthday parties for children coordinated by a child development specialist
- Infant/Child Car Seat Installation provided by AAA CPS Certified Employees
- All employees can provide expertise & knowledge on each baby product
- Full-service nursing room provided
What will set A Mother’s Place apart from the competition is our commitment to provide these services in one convenient location, with expertise in child development, experience with each product and high-quality customer service.
2.1 Company Location
A Mother’s Place will be conveniently located in downtown Santa Cruz at 504 Front Street. Unlike many of the stores downtown with limited metered parking, this location has free on-site parking with a new outside lighting system. There is additional free public parking directly across the street with a stop light to provide safety for families who may need to cross the street. A Mother’s Place is one block from the Pacific Garden Mall that includes BabyGap, Cottontales (children clothing store) and Borders Books, all stores that are frequented by families. Down the street, two blocks away on Front Street, is a Long’s Drug Store, and a new Trader Joe’s is scheduled to open by November 2004. All of these stores draw families to this location.
This location is 4,000 square feet, providing ample room for retail space, a tumbling and gym room, a nursing room, inventory storage, and two restroom facilities. It’s currently being renovated by the building owner, and upon completion, the front of the building will have an inviting and upscale appearance. It’s scheduled to be completed by June 30, 2004 after which A Mother’s Place will begin to prepare the space for opening in September.
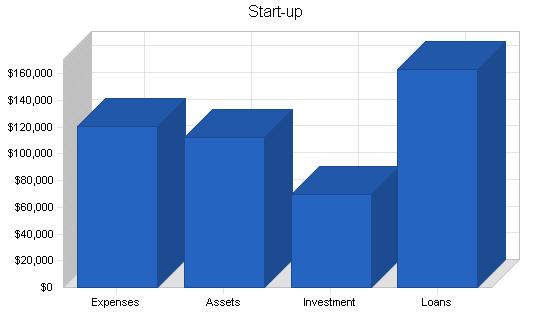
2.2 Start-up Summary
To achieve our objectives, Emili Willet will invest $70,000 cash into A Mother’s Place. In addition, A Mother’s Place is seeking $163,000 in loan financing. This loan will be repaid from the cash flow from the business, and will be secured by the assets of the company, and backed by the character, experience and personal guarantees of the owner.

The Start-up table, below, shows our start-up expenses and assets, including the following necessary current assets:
- Shelving
- (Gym Room): Mats, Tumbling Equipment and Mirror
- (Nursing Room): Chairs, Tables, Changing Table
| Start-up | |
| Requirements | |
| Start-up Expenses | |
| Business Plan Software | $90 |
| Legal (Incorporated, DBA, etc) | $450 |
| Flyers, promotional coupons, business cards, letterhead etc | $650 |
| Building permit & business license | $2,000 |
| Website | $2,000 |
| JPMA Trade Show (May 1 – 5, 2004) | $1,300 |
| Insurance | $2,200 |
| Rent (1st & last, security) | $15,000 |
| Utilities Start up paymt (6 months payment) | $1,200 |
| Bookkeeper Set up fees & software | $500 |
| StrollerFit Manual & Start Up fees | $2,500 |
| POS System | $5,250 |
| Expensed equipment (computer, fax, printer, copier) | $12,000 |
| Office & Paper Supplies | $500 |
| Building Renovation | $75,000 |
| Total Start-up Expenses | $120,640 |
| Start-up Assets | |
| Cash Required | $0 |
| Start-up Inventory | $65,000 |
| Other Current Assets | $47,360 |
| Long-term Assets | $0 |
| Total Assets | $112,360 |
| Total Requirements | $233,000 |
| Start-up Funding | |
| Start-up Expenses to Fund | $120,640 |
| Start-up Assets to Fund | $112,360 |
| Total Funding Required | $233,000 |
| Assets | |
| Non-cash Assets from Start-up | $112,360 |
| Cash Requirements from Start-up | $0 |
| Additional Cash Raised | $0 |
| Cash Balance on Starting Date | $0 |
| Total Assets | $112,360 |
| Liabilities and Capital | |
| Liabilities | |
| Current Borrowing | $0 |
| Long-term Liabilities | $163,000 |
| Accounts Payable (Outstanding Bills) | $0 |
| Other Current Liabilities (interest-free) | $0 |
| Total Liabilities | $163,000 |
| Capital | |
| Planned Investment | |
| Owner | $70,000 |
| other | $0 |
| Additional Investment Requirement | $0 |
| Total Planned Investment | $70,000 |
| Loss at Start-up (Start-up Expenses) | ($120,640) |
| Total Capital | ($50,640) |
| Total Capital and Liabilities | $112,360 |
| Total Funding | $233,000 |
2.3 Company Ownership
A Mother’s Place will be a privately held S corporation owned by Emili Willet, M.Ed.
Products and Services
A Mother’s Place will provide upscale baby products, parenting resources, children’s play programs, and fitness classes.
Services:
- Baby/Gift Registering: Families can register items for baby showers, birthday parties and other events.
- Girlfriends Buddy Program: Pregnant women can obtain an appointment with an experienced Child Specialist (employee of the company) to provide support and recommendations on the baby registration process. Many new moms are overwhelmed with the process, and this can be an inviting opportunity to help new moms make decisions on the needs of her new baby.
- Nursing Room: Moms can shop with peace of mind knowing that they can nurse their baby when needed without leaving the store. This room will be a full-service program with comfortable seating, soft instrumental music, changing facilities and drinking water available.
- Car Seat Installation: A Mother’s Place employees will be AAA CPS (Child Passenger Safety) Certified, and available to install car seats properly.
- Childbirthing Classes: We will offer classes for pregnant women (and a support person) in preparation for the birth of her child. Each session will include six weekly classes.
- Yoga Pregnancy Classes: Yoga classes for pregnant women will be taught by a certified Yoga instructor (specialized in pregnancy fitness).
- Mommy & Me Classes: New moms can bring their infants to classes that will offer support, guidance and parenting resources. Topics in the classes can include “Songs to sing to your little one”, “How to interact with your 2 week old infant,” “What can my baby see & hear?” and “What to expect from your 6 month old.” Each class will be guided by a trained Child Specialist Instructor.
- StrollerFit: A Mother’s Place will franchise this established program that is growing across the nation. This program provides a fitness class that allows both mom and the baby (4 weeks – 2 1/2 years of age) to exercise together, and have fun with other moms in the community. Currently there is no program that allows babies to exercise with their moms in Santa Cruz county. Franchising this program will allow A Mother’s Place to offer this program at other locations. As part of this plan, StrollerFit will be offered at A Mother’s Place, West Cliff Drive, Westlake Elementary School gymnasium (approval already obtained), and Seacliff Beach during the first year of operation.
- Winter Playgroups:
- Infant Playgroup (4 weeks old – 12 months old)
- Young Walkers Playgroup (12 months – 23 months old)
- Older Walkers Playgroup (24 months – 36 months old): During the winter months (November to March), moms can sign up for a weekly playgroup at a low monthly cost.This will allow moms to bring their infants or young children to an environment that will be set up appropriately with mats, tumbling equipment, soft toys, mirrors, and other soft indoor equipment. Frequently during the winter months, cold and wet weather prevents mothers from going to outdoor parks, and this provides an alternative option. In addition, it provides an opportunity for mothers to meet other moms in the community.
- Children’s Classes:
- Jr. Jumpers: This will provide toddlers (12 months – 20 months of age) an opportunity to build physical coordination through an educational program. This will be an instructed class that will provide fun with tunnels, slides, balance beams, obstacle courses, parachutes and bubbles to excite children of this age group.
- Jumper Time: This provides older toddlers (21 months – 36 months of age) a developmentally-appropriate educational program for older, more stable toddlers. In addition to building physical coordination through movement play, it will provide opportunities for children to explore through language with songs, finger plays and body movement games.
- Art Time: This will provide preschool aged children (3 – 5 years of age) opportunities for creative exploration through art play, projects and group art activities.
- Birthday Parties: Families can arrange birthday parties for their children at A Mother’s Place. A variety of packages and themes will be available, including choices of event type, (Magician, Balloon Maker, Face Painter, Animal Show etc), party bag type, dessert (cake, cupcakes, cookies, ice cream, popsicles etc), setup (gymnasium set up, art project set up, bubbles machine set up etc) and extent of service (set up & clean up service).
- Room available to contract out: A Mother’s Place will provide the room on a contractual basis for programs and/or events that are supported by this company.
Products:
Each product must receive high ratings from reviewers (parenting magazines, internet reviews, Baby Products books) in order to be sold at A Mother’s Place.
- Juvenile Equipment: Car seats, strollers, swings, joggers, exersaucers and high chairs will be among the selection of juvenile equipment available.
- Juvenile Feeding & Bathing Products: Bottles, diapers, sippy cups, bathing toys, stain removers and other feeding related products will be sold.
- Breastfeeding Products: Breast pumps, nursing pads, nursing creams, nursing bras and nursing pillows will be available.
- Young Infant Toys & Mobiles: A selection of developmentally appropriate infant toys and hanging mobiles will be available. In addition to meeting the highly rated criteria, toys will be selected by the owner, who has a Masters degree specialized in Infant/Child Development, for their ability to serve the growing intellectual needs of infants and young children.
- Books: A selection of board books will be provided. This will also help promote the importance of early reading for young infants and children.
- Layette clothing and blankets: A small selection of layette sets will be available for customers who would like to purchase layettes for baby shower gifts, or other gifts.
- Baby Gift Baskets: A variety of baskets will be available, filled with an assortment of baby products.
- Gift Items: A selection of photo albums, picture frames, handprint kits, and art prints will be available.
Market Analysis Summary
A Mother’s Place will focus on pregnant women, new moms and families with young children under age five in the community. In Santa Cruz county, there are currently a total of 21,670 children aged 0 – 5 years old with a 3.7% growth change from 1998 – 2003. In addition, in this same time period, the median family income increased 17.5% up to $69,000. This increase in the socioeconomic status can be reflected in the increases of retail sales. In the past five years, retail sales have climbed consistently with a net increase of 40%. There has been a steady increase in the number of people residing in Santa Cruz county who are also employed here, indicating that fewer residents are commuting to Silicon Valley.1
Overall, there has been a steady increase in the population of families with young children, and a steadily rising median income in Santa Cruz county. In addition, with more residents employed in Santa Cruz County and not commuting to Silicon Valley, more families are opting to shop for their household needs in Santa Cruz County.
It was reported at the Juvenile Products Manufacturing Association (JPMA) trade show in Dallas (May 2004) that there is growing interest in juvenile products, with an increase in sales of 5% to 6% percent annually. The president of a large juvenile product organization stated, “the industry is very healthy and birth rates are strong,” and “parents also are spending more than ever.” 2
1Comprehensive Economic Development Strategy, Prepared for the County of Santa Cruz County December 2002. Applied Survey Research, Watsonville, December 2003.
2“License! Where Concepts Come to Market,” April 2004 One Park Avenue, New York, New York 10016, made available at JPMA Trade Show, Dallas May 2004.
Strategy and Implementation Summary
In all areas of marketing, A Mother’s Place will implement consistent marketing and sales strategies from the beginning (prior to opening). The following sections outline our strategies for sales and marketing.
5.1 Competitive Edge
The advantages A Mother’s Place has over the competition are numerous:
- Toys ‘R Us and K-Mart are the only two places within a 10 mile radius from Santa Cruz city that carry juvenile products, and both are limited in their selection. Neither of these stores offers the small and family-friendly atmosphere or high quality customer service of A Mother’s Place.
- A Mother’s Place has a multitude of parenting resources: there are parenting classes, pregnancy support programs, children’s play programs and winter playgroups, as well as the wealth of child development knowledge that will be delivered by the principal and the employees of the company.
- A Mother’s Place offers a baby registering program with consulting at free of cost that is not available in Santa Cruz or Santa Clara County.
- A Mother’s Place will offer parents the convenience of purchasing multiple baby products (diapers, bottles, car seats, toys, books) in the same location where they can take parenting and/or fitness classes.
- A Mother’s Place will provide Installation of Car Seats by AAA CPS Certified(Child Passenger Safety) employees. The only place that provides this program currently is the local California Highway Patrol office, which has limited hours.
5.2 Marketing Strategy
A Mother’s Place will market the company in the following ways:
Giving brochures with a promotional discount offer to:
- Birthing Classes at Sutter Medical Center
- Childbirthing Classes at Dominican Hospital
- Breastfeeding Support Group at Dominican Hospital
- Mom’s Support Group at Dominican Hospital
Posting flyers at:
- OB/Gyn Examination rooms
- Area childcare centers
- Local children’s clothing stores (i.e. Lollipops, Cottontales, Hopscotch)
- Local stores that carry children’s items (i.e. Aptos Shoes & Apparel, Toy Chest, Farmer Exchange)
- Local children’s programs (Harvey West swimming classes, Simpson Swim Center, Loudon Nelson’s Center, Santa Cruz Gymnastics)
- Libraries ~ children’s books section
- Local bookstores ~ children’s book section (i.e. Santa Cruz Bookshop, Book Cafe Capitola)
- Fitness Centers ~ childcare area
Getting articles promoting A Mother’s Place grand opening printed in:
- Santa Cruz Sentinel Newspaper
- Growing Up in Santa Cruz: A newsletter serving families of Santa Cruz County
- Good Times
- San Jose Mercury News
All brochures, flyers and other marketing tools will promote our website, which will list the products and services this company can provide to the community. It will also have all schedules of classes, and a registration form for class enrollment can be printed from the website, as well.
5.3 Employee Incentive Program
Our employees will play a vital part in the success of the company. A Mother’s Place will allow the employees to be part of the company in the following ways:
- Each employee will have a job description and orientation that will provide clear expectations for their performances, and the company’s mission and goals. This will benefit both the employees and the principal as everyone will be working towards the same goal.
- Included in the job description and training, each employee will be given responsibility for moving us toward one of our company objectives, to develop a feeling of ownership in the company’s success. This will promote better work performances, as each employee will feel responsible for his/her actions, and will thus help to increase sales.
- Each month, if the company meets the sales forecast goal, each employee will be eligible for a bonus card that will provide cash towards any purchases at A Mother’s Place. The amount will be determined based on the performance of the employee.
- The company will introduce an “Star Employee” system based on reviews from customers, sales performance and employee performance. The employee of the month will earn a choice of an afternoon paid time off, or a bonus card (the bonuses/rewards can be modified to make it more suitable for the employee group).
- Each of the employees will have the satisfaction of providing quality products and services to families and children. They will be recognized for their high quality services, customer relations and “going beyond their job descriptions.”
5.4 Sales Strategy
The sales strategy of A Mother’s Place will be threefold:
- Products:
- “Shop for convenience” Products such as diapers, baby wipes, and bottlefeeding accessories will draw mothers to A Mother’s Place as they can shop “at one place” for all their needs, and may purchase other items at the retail store, and/or enroll in classes.
- Competitive Prices: Diapers and baby wipes will be offered at the lowest price among all competitors (including local supermarkets, drug stores, Costco, Target, and KMart). These items are not intended to make large profit, only as a marketing strategy to draw customers to the store.
- “Review & Save Program”: This program will allow customers to “rate” the products they have purchased, and receive a promotional coupon towards their next shopping trip at A Mother’s Place. All of the reviews will be posted, to help provide customers with additional information on the products, and to promote sales.
- Classes: The classes (Yoga Pregnancy, Parenting classes, StrollerFit, Playgroups) will also be an incentive to draw mothers into the store and enroll in additional classes.
- Environment:
- Nursing Room: The nurturing and comforting environment of this room will contribute to our family-friendly atmosphere, and the resultant high return rate of our customers.
- Upscale and inviting presentation: All products will be displayed in an organized and inviting fashion (i.e. there will be a “nursery room set up” with cribs fitted with coordinated beddings, pillows, art prints, mobiles and rugs), that will provide ideas for the customers, thus increasing sales.
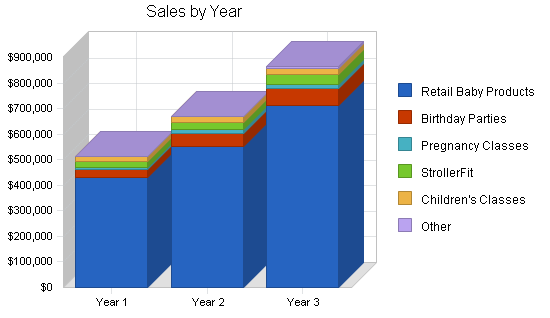
5.5 Sales Forecast
The strongest revenue during the first quarter of operation will be retail sales, until the classes begin to build enrollment by the second quarter of operation. In addition, we estimate that the birthday parties will begin to bring in stronger revenue during the holidays, with “holiday parties” offered.
Note: The financial assumptions can be found in section 8.0 of this plan, below.
| Sales Forecast | |||
| Year 1 | Year 2 | Year 3 | |
| Sales | |||
| Retail Baby Products | $429,400 | $552,000 | $713,495 |
| Birthday Parties | $31,060 | $52,000 | $65,000 |
| Pregnancy Classes | $9,120 | $12,480 | $16,640 |
| StrollerFit | $23,940 | $30,000 | $37,500 |
| Children’s Classes | $19,855 | $22,238 | $24,906 |
| Other | $0 | $1,000 | $6,000 |
| Total Sales | $513,375 | $669,718 | $863,541 |
| Direct Cost of Sales | Year 1 | Year 2 | Year 3 |
| Retail Products | $214,500 | $276,000 | $356,748 |
| Birthday Parties | $11,250 | $23,000 | $29,250 |
| Classes | $2,100 | $2,352 | $2,634 |
| Other | $0 | $0 | $0 |
| Subtotal Direct Cost of Sales | $227,850 | $301,352 | $388,632 |
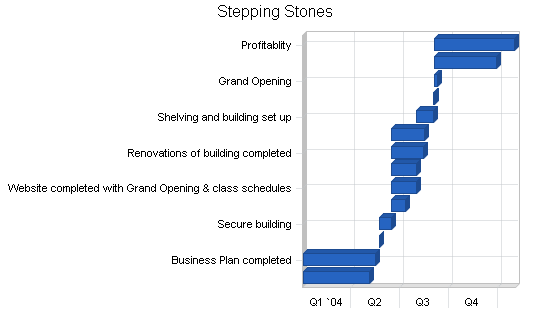
5.6 Stepping Stones
The JPMA (Juvenile Products Manufacturing Association) Trade Show is one of the largest trade shows in the industry of baby products, offered annually in May. The principal will attend to gain information on the products (current and new lines for 2005), meet the company representatives, and establish the strong relationships that will be vital to the success of A Mother’s Place.
The next step will be completion of the business plan, through the grand opening of the company, and the beginning of profitability in January 2005.
| Milestones | |||||
| Milestone | Start Date | End Date | Budget | Manager | Department |
| JPMA Trade Show | 1/1/2004 | 5/4/2004 | $1,300 | Emili | N/A |
| Business Plan completed | 1/1/2004 | 5/16/2004 | $90 | Emili | N/A |
| Application submitted to bank | 5/23/2004 | 5/23/2004 | $0 | Emili | Marketing |
| Secure building | 5/23/2004 | 6/15/2004 | $15,000 | Emili | Web |
| Inventory Ordering | 6/15/2004 | 7/12/2004 | $65,000 | Emili | Web |
| Website completed with Grand Opening & class schedules | 6/15/2004 | 8/1/2004 | $2,000 | Emili | Department |
| Marketing of A Mother’s Place | 6/15/2004 | 8/1/2004 | $650 | Emili | Department |
| Renovations of building completed | 6/15/2004 | 8/15/2004 | $75,000 | Emili | Department |
| Set Up StrollerFit Franchise | 6/15/2004 | 8/16/2004 | $2,500 | Emili | Web |
| Shelving and building set up | 8/1/2004 | 9/1/2004 | $59,860 | EW & Mgr. | Department |
| Company doors opens | 9/1/2004 | 9/4/2004 | $0 | Emili | Department |
| Grand Opening | 9/4/2004 | 9/10/2004 | $1,000 | Emili | Department |
| Monthly sales over 30K | 9/4/2004 | 12/30/2004 | $0 | EW & Mgr. | Department |
| Profitablity | 9/4/2004 | 2/1/2005 | $0 | Emili | Department |
| Totals | $222,400 | ||||
Web Plan Summary
A Mother’s Place will provide an informational website that will serve primarily as a resource for mothers, families and the community. The website will be developed by Erik Gundersen at EDesigns. The website will provide the following resources:
Class Schedules & Registration Form: The website will provide a current schedule, detailed class descriptions and a registration form for each of the classes provided:
- Yoga Prenatal Classes
- StrollerFitâ Classes
- Children’s Play Classes (Jr. Jumpers, Jumper Time, Art Time)
- Winter Play Groups (Infant, Young Walkers, Older Walkers)
- Childbirthing Classes
- “Mommy & Me” Classes
Birthday Party Packages: The website will provide detailed information on the packages available for the birthday parties. It will include the different themes, party bags, events and other birthday party options that families can choose.
Car Seat Installation Program: We will provide information on our car seat installation program intended to promote safety for the children, and convenience for their families.
Baby Shower/Gift Registering: Families and friends will be able to access baby shower/gift registering directly from our website.
General Information: In addition to providing information about all of our services, the website will provide directions on how to get to A Mother’s Place, post the hours of the company, and also provide an email link to allow customers to ask any questions regarding our services, our products or our company.
Management Summary
Emili graduated from Harvard with a Master’s Degree in Education & Child Development. She has 15 years experience as an administrator in the child development field. Most recently, she was Chief of Operations for a local, family owned childcare management company in the Silicon Valley. In this role, she was responsible for the day to day operations, including finance management, employee relations and customer service, for each of the 15 childcare centers.
Prior to this position, Emili had the opportunity to gain valuable fiscal management experience as the Director of Finance/Account Manager for the Cisco Systems corporate sponsored childcare center. This center was a start-up project to serve over 500 children, and employed 125 teachers and administrators. At this largest childcare center of California, Emili was responsible for the fiscal management, fiscal reporting, human resources and payroll and overseeing the day to day operations of the services the center provided. In addition, she has been a child development instructor at San Jose State University. She is also the proud mother of a young infant, which has taught her a great deal about purchasing juvenile products and parenting services.
7.1 Personnel Plan
A Mother’s Place will be looking for candidates who currently have young children, and want part-time hours. This team of parents will make our customers, who are also parents, feel more comfortable, and serve as a resource for many of our products and services.
The following personnel plan will be implemented completely when total sales exceeds $53,000 monthly at A Mother’s Place:
Start-Up Personnel:
- The principal, Emili Willet will be onsite full-time, responsible for day-to-day operations, all accounting/administrative tasks, and providing customer service.
- One full-time manager to oversee and fill in for all areas. In addition, due to the principal’s deafness, it’s vital to have an employee onsite at all hours to provide high quality customer service communications on the phone.
- One part-time manager to oversee and fill in all areas during the weekend hours (each manager will have additional responsibilities that will be specific to each manager to establish ownership of their jobs). (16 hrs/wk)
- One part-time StrollerFitâ instructor to teach the StrollerFitâ fitness classes (6 hrs/wk).
Near Term:
- One part-time class instructor and party coordinator to teach classes, and plan and organize birthday parties. Classes and birthday parties will start in October, and the hours for this position will be determined by the number of classes and parties that are served. (3 – 15 hrs/wk)
Long Term:
- One part-time retail specialist will be hired when total monthly sales have exceeded $45,000 in March, primarily to help on weekends to greet customers, provide expertise in products, inventory, keeping floor space organized and presentable, run cash register, answer phones and perform any other customer service related tasks. (16 hrs/wk)
- One full-time retail specialist will be hired when total monthly sales have exceeded $53,000 in May, to greet customers, provide expertise in products, inventory, keeping floor space organized and presentable, run cash register, answer phones and perform any other customer service related tasks.
The growth of the company will be determined by how accurately and efficiently the company is able to implement the facets of this business plan.
| Personnel Plan | |||
| Year 1 | Year 2 | Year 3 | |
| Emili, Principal | $49,600 | $65,625 | $70,000 |
| Manager | $31,200 | $37,411 | $39,281 |
| PT Manager | $12,048 | $11,790 | $12,380 |
| StrollerFit Fitness Certified Instructor | $9,880 | $12,480 | $15,600 |
| PT Class Instructor/Party Coordinator | $6,458 | $6,652 | $7,722 |
| PT Retail Specialist | $6,932 | $17,160 | $18,018 |
| FT Retail Specialist | $6,920 | $21,798 | $22,890 |
| Other | $0 | $0 | $0 |
| Total People | 7 | 7 | 7 |
| Total Payroll | $123,038 | $172,916 | $185,891 |
Financial Plan
The following sections will outline the important information on the financial aspects of A Mother’s Place.
8.1 Break-even Analysis
The following table and chart show our Break-even Analysis.

| General Assumptions | |||
| Year 1 | Year 2 | Year 3 | |
| Plan Month | 1 | 2 | 3 |
| Current Interest Rate | 8.00% | 8.00% | 8.00% |
| Long-term Interest Rate | 8.50% | 8.50% | 8.50% |
| Tax Rate | 30.00% | 30.00% | 30.00% |
| Other | 0 | 0 | 0 |
| Break-even Analysis | |
| Monthly Revenue Break-even | $41,323 |
| Assumptions: | |
| Average Percent Variable Cost | 44% |
| Estimated Monthly Fixed Cost | $22,983 |
8.2 Important Assumptions
Retail sales based on the following assumptions:
- Start-up growth
- Slow steady growth from September – December.
- The marketing strategies in this plan will be implemented prior to grand opening to build customer base for this period.
- Growth will slow down slightly post holiday season during the month of January.
- Steady growth will begins to pick up from February – August with the implementation of new class. sessions, and more marketing tools.
- Each time a new class begins each month, it’s assumed that the class participants will bring in additional sales revenue (see additional details below).
- StrollerFit® will begin in September.
- Children’s classes and birthday parties will begin in October.
- Holiday children’s parties will begin during the holiday season (Nov – Dec).
- These starting projections are based on the actual sales of opening month of a woman-owned shoe store in Capitola, and recent sales of a church/religious store in Santa Cruz. The starting projections are estimated lower than these two stores.
Classes sales based on the following assumptions:
- StrollerFit®
- StrollerFit® will begin in September at two locations (Westlake Elementary, and at Lighthouse, WestCliff Drive) and continue through December.
- During the holidays, there is no projection of increased enrollment.
- It’s a common trend that enrollment for exercise programs increases in January, and one more class will be added at A Mother’s Place.
- As the weather warms up again in March, we project increased enrollment will begin and stay steady throughout the summer months.
- One class revenue is based on $7.50 fee per person, 8 participants per class, and 3 sessions per week which equals $780/month. StrollerFitâ requires a 15% royalty fee of all sales which brings A Mother’s Place a total sales of $662/month.
- There is no direct cost of sales involved for StrollerFitâ
- Children’s Classes:
- Each children’s class is a 10-week session (Sept – mid Nov).
- One session will begin in September, restart every 10 weeks continuously.
- Another session will begin in October, restart every 10 weeks continuously.
- A total of 3 sessions will be offered starting in January.
- A total of 4 sessions will be offered starting in March.
- Each children’s class revenue is based on $9.00 per class, 11 participants, one class per week which is a total of $467/month.
- In addition, a Winter Playgroup will be offered each month from November – March (during the cold weather months). We project that each month will bring in an additional $200/month. This is based on $10 per month per child, 10 children each Playgroup session which equals $100/month. Each month will have 2 groups.
- Cost of all children’s classes combined is projected at $50/per class per month to maintain play and activity equipment.
- Pregnancy Classes:
- One childbirthing/pregnancy class will begin a 6-week session in October and restart continuously every 6 weeks. A second session will begin in November, and restart continuously every 6 weeks.
Birthday Parties sales based on the following assumptions:
- Several packages will be offered for Birthday parties, ranging from $500 – $800 per party.
- No birthday parties will be offered during the month of September.
- Two birthday parties will be offered during the month of October, and three parties in November.
- Holiday parties will be offered during the month of December, and a total of 5 parties is projected.
- We project that a total of 6 parties per month will be held from January – May. During summer months, a maximum of 7 per month will be offered.
Payroll is based on the following assumptions:
- In addition to the principal owner, a full-time manager (40hr/wk) and part-time manager (16hr/wk) will begin employment in September to cover a 7 day work week schedule. Due to the owner’s deafness, it’s vital for a manager to be on-staff at all times to provide customer service on the telephone.
- A part-time retail employee will be hired in March, when total gross sales reach $45,000, to work during busiest hours.
- A full-time employee will not be hired until total gross sales exceed $50,000, projected to occur in May.
- All instructors for StrollerFitâ are part-time, and work one hour per class at $20/hr.
- All instructors and party coordinators are part-time, and work per class/party at $12.75/hr. The party coordinator will be employed additional hour per party for set-up/clean-up, and planning. The additional hours in October are for training.
Expenses are based on the following assumptions:
- Loan repayment is estimated at $163,000 total borrowing, at 8.5% with 6 year term, equaling payments of $2897 per month (principal repayment listed in the Cash Flow, and interest expenses in the Profit and Loss, below).
- POS System, insurance, payroll processing fees, website, StrollerFit manual, shelving, tumbling equipment and all other equipment are based on actual bids from vendors.
- We do not expect to hire janitorial services during the first year of operation. The retail employee will assume the janitorial responsibilities to minimize cost.
- Rent is estimated at $5,000 per month for a 3,550 square foot space at $1.40 NNN.
- Space is estimated to provide 1600 sq ft for retail, 1150 sq ft for class/gym room, 400 sq ft for inventory storage and 400 sq ft for office, nursing room and bathroom.
8.3 Projected Profit and Loss
The following table and chart show the profit and loss projections for the first three years of operation.


| Pro Forma Profit and Loss | |||
| Year 1 | Year 2 | Year 3 | |
| Sales | $513,375 | $669,718 | $863,541 |
| Direct Cost of Sales | $227,850 | $301,352 | $388,632 |
| Other Costs of Goods | $2 | $0 | $0 |
| Total Cost of Sales | $227,852 | $301,352 | $388,632 |
| Gross Margin | $285,523 | $368,366 | $474,909 |
| Gross Margin % | 55.62% | 55.00% | 55.00% |
| Expenses | |||
| Payroll | $123,038 | $172,916 | $185,891 |
| Sales and Marketing and Other Expenses | $2,700 | $3,000 | $3,100 |
| Depreciation | $0 | $0 | $0 |
| Rent | $60,000 | $60,000 | $60,000 |
| Phone & DSL | $900 | $900 | $900 |
| Utilities | $4,800 | $4,800 | $4,800 |
| Insurance | $2,100 | $2,400 | $2,600 |
| Payroll Taxes | $24,608 | $34,583 | $37,178 |
| Payroll Processing fees | $1,280 | $1,290 | $1,300 |
| Loan payment | $33,600 | $33,600 | $33,600 |
| Bookkeeper | $1,000 | $1,000 | $1,500 |
| Office Supplies | $1,200 | $1,200 | $1,500 |
| Janitorial Service | $0 | $1,000 | $1,200 |
| Janitorial Supplies & Paper Products | $4,200 | $5,000 | $5,200 |
| Interest Expense | $13,020 | $11,097 | $9,005 |
| Other | $3,350 | $3,600 | $4,000 |
| Total Operating Expenses | $275,796 | $336,386 | $351,774 |
| Profit Before Interest and Taxes | $9,727 | $31,979 | $123,135 |
| EBITDA | $9,727 | $31,979 | $123,135 |
| Interest Expense | $12,853 | $10,999 | $8,898 |
| Taxes Incurred | $0 | $6,294 | $34,271 |
| Net Profit | ($3,126) | $14,686 | $79,966 |
| Net Profit/Sales | -0.61% | 2.19% | 9.26% |
8.4 Projected Cash Flow
The following table and chart show the projected cash flow for the first three years of operation. Please note that A Mother’s Place will receive cash for all purchases and services. All classes and birthday parties will be paid in advance upon registration.

| Pro Forma Cash Flow | |||
| Year 1 | Year 2 | Year 3 | |
| Cash Received | |||
| Cash from Operations | |||
| Cash Sales | $513,375 | $669,718 | $863,541 |
| Subtotal Cash from Operations | $513,375 | $669,718 | $863,541 |
| Additional Cash Received | |||
| Sales Tax, VAT, HST/GST Received | $0 | $0 | $0 |
| New Current Borrowing | $0 | $0 | $0 |
| New Other Liabilities (interest-free) | $0 | $0 | $0 |
| New Long-term Liabilities | $0 | $0 | $0 |
| Sales of Other Current Assets | $0 | $0 | $0 |
| Sales of Long-term Assets | $0 | $0 | $0 |
| New Investment Received | $0 | $0 | $0 |
| Subtotal Cash Received | $513,375 | $669,718 | $863,541 |
| Expenditures | Year 1 | Year 2 | Year 3 |
| Expenditures from Operations | |||
| Cash Spending | $123,038 | $172,916 | $185,891 |
| Bill Payments | $316,884 | $493,097 | $599,570 |
| Subtotal Spent on Operations | $439,922 | $666,013 | $785,461 |
| Additional Cash Spent | |||
| Sales Tax, VAT, HST/GST Paid Out | $0 | $0 | $0 |
| Principal Repayment of Current Borrowing | $0 | $0 | $0 |
| Other Liabilities Principal Repayment | $0 | $0 | $0 |
| Long-term Liabilities Principal Repayment | $21,756 | $23,677 | $25,770 |
| Purchase Other Current Assets | $0 | $0 | $0 |
| Purchase Long-term Assets | $0 | $0 | $0 |
| Dividends | $0 | $0 | $0 |
| Subtotal Cash Spent | $461,678 | $689,690 | $811,231 |
| Net Cash Flow | $51,697 | ($19,972) | $52,310 |
| Cash Balance | $51,697 | $31,725 | $84,035 |
8.5 Projected Balance Sheet
The following table indicates the Projected Balance for the first three years of operation.
| Pro Forma Balance Sheet | |||
| Year 1 | Year 2 | Year 3 | |
| Assets | |||
| Current Assets | |||
| Cash | $51,697 | $31,725 | $84,035 |
| Inventory | $30,113 | $39,826 | $51,361 |
| Other Current Assets | $47,360 | $47,360 | $47,360 |
| Total Current Assets | $129,170 | $118,911 | $182,756 |
| Long-term Assets | |||
| Long-term Assets | $0 | $0 | $0 |
| Accumulated Depreciation | $0 | $0 | $0 |
| Total Long-term Assets | $0 | $0 | $0 |
| Total Assets | $129,170 | $118,911 | $182,756 |
| Liabilities and Capital | Year 1 | Year 2 | Year 3 |
| Current Liabilities | |||
| Accounts Payable | $41,692 | $40,424 | $50,073 |
| Current Borrowing | $0 | $0 | $0 |
| Other Current Liabilities | $0 | $0 | $0 |
| Subtotal Current Liabilities | $41,692 | $40,424 | $50,073 |
| Long-term Liabilities | $141,244 | $117,567 | $91,797 |
| Total Liabilities | $182,936 | $157,991 | $141,870 |
| Paid-in Capital | $70,000 | $70,000 | $70,000 |
| Retained Earnings | ($120,640) | ($123,766) | ($109,080) |
| Earnings | ($3,126) | $14,686 | $79,966 |
| Total Capital | ($53,766) | ($39,080) | $40,886 |
| Total Liabilities and Capital | $129,170 | $118,911 | $182,756 |
| Net Worth | ($53,766) | ($39,080) | $40,886 |
8.6 Business Ratios
A Mother’s Place does not fit neatly into any one existing industry. We are a fitness and educational center; we offer children’s entertainment (birthday parties, playgroups), and social space for mothers; and we have a retail component, in our gift store. It is, therefore, difficult to compare our projected overall business ratios to any one industry standard, because our revenue stream and costs are mixed.
The following table lists our business ratios, and includes a comparison with standard ratios from the “Children’s Goods,” Industry (SIC Code 5137.05). These industry ratios obviously reflect only the retail side of our operations.
| Ratio Analysis | ||||
| Year 1 | Year 2 | Year 3 | Industry Profile | |
| Sales Growth | 0.00% | 30.45% | 28.94% | 3.65% |
| Percent of Total Assets | ||||
| Inventory | 23.31% | 33.49% | 28.10% | 34.08% |
| Other Current Assets | 36.66% | 39.83% | 25.91% | 27.86% |
| Total Current Assets | 100.00% | 100.00% | 100.00% | 89.32% |
| Long-term Assets | 0.00% | 0.00% | 0.00% | 10.68% |
| Total Assets | 100.00% | 100.00% | 100.00% | 100.00% |
| Current Liabilities | 32.28% | 34.00% | 27.40% | 37.41% |
| Long-term Liabilities | 109.35% | 98.87% | 50.23% | 9.72% |
| Total Liabilities | 141.62% | 132.86% | 77.63% | 47.13% |
| Net Worth | -41.62% | -32.86% | 22.37% | 52.87% |
| Percent of Sales | ||||
| Sales | 100.00% | 100.00% | 100.00% | 100.00% |
| Gross Margin | 55.62% | 55.00% | 55.00% | 26.48% |
| Selling, General & Administrative Expenses | 56.23% | 52.81% | 45.74% | 16.06% |
| Advertising Expenses | 0.00% | 0.00% | 0.00% | 0.69% |
| Profit Before Interest and Taxes | 1.89% | 4.78% | 14.26% | 1.40% |
| Main Ratios | ||||
| Current | 3.10 | 2.94 | 3.65 | 2.16 |
| Quick | 2.38 | 1.96 | 2.62 | 0.95 |
| Total Debt to Total Assets | 141.62% | 132.86% | 77.63% | 52.09% |
| Pre-tax Return on Net Worth | 5.81% | -53.68% | 279.40% | 3.86% |
| Pre-tax Return on Assets | -2.42% | 17.64% | 62.51% | 8.05% |
| Additional Ratios | Year 1 | Year 2 | Year 3 | |
| Net Profit Margin | -0.61% | 2.19% | 9.26% | n.a |
| Return on Equity | 0.00% | 0.00% | 195.58% | n.a |
| Activity Ratios | ||||
| Inventory Turnover | 7.78 | 8.62 | 8.52 | n.a |
| Accounts Payable Turnover | 8.60 | 12.17 | 12.17 | n.a |
| Payment Days | 27 | 30 | 27 | n.a |
| Total Asset Turnover | 3.97 | 5.63 | 4.73 | n.a |
| Debt Ratios | ||||
| Debt to Net Worth | 0.00 | 0.00 | 3.47 | n.a |
| Current Liab. to Liab. | 0.23 | 0.26 | 0.35 | n.a |
| Liquidity Ratios | ||||
| Net Working Capital | $87,478 | $78,487 | $132,683 | n.a |
| Interest Coverage | 0.76 | 2.91 | 13.84 | n.a |
| Additional Ratios | ||||
| Assets to Sales | 0.25 | 0.18 | 0.21 | n.a |
| Current Debt/Total Assets | 32% | 34% | 27% | n.a |
| Acid Test | 2.38 | 1.96 | 2.62 | n.a |
| Sales/Net Worth | 0.00 | 0.00 | 21.12 | n.a |
| Dividend Payout | 0.00 | 0.00 | 0.00 | n.a |
Appendix
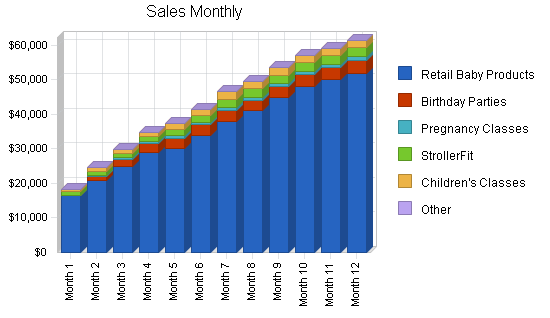
| Sales Forecast | |||||||||||||
| Month 1 | Month 2 | Month 3 | Month 4 | Month 5 | Month 6 | Month 7 | Month 8 | Month 9 | Month 10 | Month 11 | Month 12 | ||
| Sales | |||||||||||||
| Retail Baby Products | 0% | $16,400 | $21,000 | $25,000 | $29,000 | $30,000 | $34,000 | $38,000 | $41,000 | $45,000 | $48,000 | $50,000 | $52,000 |
| Birthday Parties | 0% | $0 | $1,000 | $1,800 | $2,500 | $3,000 | $3,000 | $3,000 | $3,000 | $3,000 | $3,500 | $3,560 | $3,700 |
| Pregnancy Classes | 0% | $0 | $300 | $600 | $760 | $760 | $800 | $900 | $900 | $900 | $1,000 | $1,000 | $1,200 |
| StrollerFit | 0% | $1,300 | $1,300 | $1,300 | $1,300 | $1,870 | $1,870 | $2,500 | $2,500 | $2,500 | $2,500 | $2,500 | $2,500 |
| Children’s Classes | 0% | $450 | $935 | $1,135 | $1,135 | $1,800 | $1,800 | $2,100 | $2,100 | $2,100 | $2,100 | $2,100 | $2,100 |
| Other | 0% | $0 | $0 | $0 | $0 | $0 | $0 | $0 | $0 | $0 | $0 | $0 | $0 |
| Total Sales | $18,150 | $24,535 | $29,835 | $34,695 | $37,430 | $41,470 | $46,500 | $49,500 | $53,500 | $57,100 | $59,160 | $61,500 | |
| Direct Cost of Sales | Month 1 | Month 2 | Month 3 | Month 4 | Month 5 | Month 6 | Month 7 | Month 8 | Month 9 | Month 10 | Month 11 | Month 12 | |
| Retail Products | $8,000 | $10,500 | $12,500 | $14,500 | $15,000 | $17,000 | $19,000 | $20,500 | $22,500 | $24,000 | $25,000 | $26,000 | |
| Birthday Parties | $0 | $450 | $675 | $900 | $1,350 | $1,125 | $1,125 | $1,125 | $1,125 | $1,125 | $1,125 | $1,125 | |
| Classes | $50 | $100 | $150 | $150 | $150 | $150 | $200 | $200 | $200 | $250 | $250 | $250 | |
| Other | $0 | $0 | $0 | $0 | $0 | $0 | $0 | $0 | $0 | $0 | $0 | $0 | |
| Subtotal Direct Cost of Sales | $8,050 | $11,050 | $13,325 | $15,550 | $16,500 | $18,275 | $20,325 | $21,825 | $23,825 | $25,375 | $26,375 | $27,375 | |
| Personnel Plan | |||||||||||||
| Month 1 | Month 2 | Month 3 | Month 4 | Month 5 | Month 6 | Month 7 | Month 8 | Month 9 | Month 10 | Month 11 | Month 12 | ||
| Emili, Principal | 0% | $3,200 | $3,200 | $3,200 | $4,000 | $4,000 | $4,000 | $4,000 | $4,500 | $4,500 | $5,000 | $5,000 | $5,000 |
| Manager | 0% | $2,600 | $2,600 | $2,600 | $2,600 | $2,600 | $2,600 | $2,600 | $2,600 | $2,600 | $2,600 | $2,600 | $2,600 |
| PT Manager | 0% | $1,004 | $1,004 | $1,004 | $1,004 | $1,004 | $1,004 | $1,004 | $1,004 | $1,004 | $1,004 | $1,004 | $1,004 |
| StrollerFit Fitness Certified Instructor | 0% | $520 | $520 | $520 | $520 | $780 | $780 | $1,040 | $1,040 | $1,040 | $1,040 | $1,040 | $1,040 |
| PT Class Instructor/Party Coordinator | 0% | $0 | $350 | $350 | $484 | $550 | $600 | $600 | $600 | $600 | $724 | $780 | $820 |
| PT Retail Specialist | 0% | $0 | $0 | $0 | $0 | $0 | $0 | $866 | $866 | $1,300 | $1,300 | $1,300 | $1,300 |
| FT Retail Specialist | 0% | $0 | $0 | $0 | $0 | $0 | $0 | $0 | $0 | $1,730 | $1,730 | $1,730 | $1,730 |
| Other | 0% | $0 | $0 | $0 | $0 | $0 | $0 | $0 | $0 | $0 | $0 | $0 | $0 |
| Total People | 4 | 5 | 5 | 5 | 5 | 5 | 6 | 6 | 7 | 7 | 7 | 7 | |
| Total Payroll | $7,324 | $7,674 | $7,674 | $8,608 | $8,934 | $8,984 | $10,110 | $10,610 | $12,774 | $13,398 | $13,454 | $13,494 | |
| Pro Forma Profit and Loss | |||||||||||||
| Month 1 | Month 2 | Month 3 | Month 4 | Month 5 | Month 6 | Month 7 | Month 8 | Month 9 | Month 10 | Month 11 | Month 12 | ||
| Sales | $18,150 | $24,535 | $29,835 | $34,695 | $37,430 | $41,470 | $46,500 | $49,500 | $53,500 | $57,100 | $59,160 | $61,500 | |
| Direct Cost of Sales | $8,050 | $11,050 | $13,325 | $15,550 | $16,500 | $18,275 | $20,325 | $21,825 | $23,825 | $25,375 | $26,375 | $27,375 | |
| Other Costs of Goods | $0 | $0 | $0 | $0 | $0 | $2 | $0 | $0 | $0 | $0 | $0 | $0 | |
| Total Cost of Sales | $8,050 | $11,050 | $13,325 | $15,550 | $16,500 | $18,277 | $20,325 | $21,825 | $23,825 | $25,375 | $26,375 | $27,375 | |
| Gross Margin | $10,100 | $13,485 | $16,510 | $19,145 | $20,930 | $23,193 | $26,175 | $27,675 | $29,675 | $31,725 | $32,785 | $34,125 | |
| Gross Margin % | 55.65% | 54.96% | 55.34% | 55.18% | 55.92% | 55.93% | 56.29% | 55.91% | 55.47% | 55.56% | 55.42% | 55.49% | |
| Expenses | |||||||||||||
| Payroll | $7,324 | $7,674 | $7,674 | $8,608 | $8,934 | $8,984 | $10,110 | $10,610 | $12,774 | $13,398 | $13,454 | $13,494 | |
| Sales and Marketing and Other Expenses | $250 | $250 | $250 | $250 | $250 | $100 | $100 | $250 | $250 | $250 | $250 | $250 | |
| Depreciation | $0 | $0 | $0 | $0 | $0 | $0 | $0 | $0 | $0 | $0 | $0 | $0 | |
| Rent | $5,000 | $5,000 | $5,000 | $5,000 | $5,000 | $5,000 | $5,000 | $5,000 | $5,000 | $5,000 | $5,000 | $5,000 | |
| Phone & DSL | $75 | $75 | $75 | $75 | $75 | $75 | $75 | $75 | $75 | $75 | $75 | $75 | |
| Utilities | $400 | $400 | $400 | $400 | $400 | $400 | $400 | $400 | $400 | $400 | $400 | $400 | |
| Insurance | $175 | $175 | $175 | $175 | $175 | $175 | $175 | $175 | $175 | $175 | $175 | $175 | |
| Payroll Taxes | 20% | $1,465 | $1,535 | $1,535 | $1,722 | $1,787 | $1,797 | $2,022 | $2,122 | $2,555 | $2,680 | $2,691 | $2,699 |
| Payroll Processing fees | $100 | $100 | $100 | $100 | $100 | $100 | $100 | $100 | $120 | $120 | $120 | $120 | |
| Loan payment | $2,800 | $2,800 | $2,800 | $2,800 | $2,800 | $2,800 | $2,800 | $2,800 | $2,800 | $2,800 | $2,800 | $2,800 | |
| Bookkeeper | $400 | $0 | $0 | $200 | $0 | $0 | $0 | $200 | $0 | $0 | $0 | $200 | |
| Office Supplies | $100 | $100 | $100 | $100 | $100 | $100 | $100 | $100 | $100 | $100 | $100 | $100 | |
| Janitorial Service | $0 | $0 | $0 | $0 | $0 | $0 | $0 | $0 | $0 | $0 | $0 | $0 | |
| Janitorial Supplies & Paper Products | $350 | $350 | $350 | $350 | $350 | $350 | $350 | $350 | $350 | $350 | $350 | $350 | |
| Interest Expense | 15% | $1,085 | $1,085 | $1,085 | $1,085 | $1,085 | $1,085 | $1,085 | $1,085 | $1,085 | $1,085 | $1,085 | $1,085 |
| Other | $250 | $100 | $200 | $200 | $200 | $300 | $300 | $300 | $300 | $400 | $400 | $400 | |
| Total Operating Expenses | $19,774 | $19,644 | $19,744 | $21,065 | $21,256 | $21,266 | $22,617 | $23,567 | $25,984 | $26,833 | $26,900 | $27,148 | |
| Profit Before Interest and Taxes | ($9,674) | ($6,159) | ($3,234) | ($1,920) | ($326) | $1,927 | $3,558 | $4,108 | $3,691 | $4,892 | $5,885 | $6,977 | |
| EBITDA | ($9,674) | ($6,159) | ($3,234) | ($1,920) | ($326) | $1,927 | $3,558 | $4,108 | $3,691 | $4,892 | $5,885 | $6,977 | |
| Interest Expense | $1,142 | $1,129 | $1,116 | $1,103 | $1,090 | $1,078 | $1,065 | $1,052 | $1,039 | $1,026 | $1,013 | $1,000 | |
| Taxes Incurred | $0 | $0 | $0 | $0 | $0 | $0 | $0 | $0 | $0 | $0 | $0 | $0 | |
| Net Profit | ($10,816) | ($7,288) | ($4,350) | ($3,023) | ($1,416) | $850 | $2,493 | $3,056 | $2,652 | $3,866 | $4,872 | $5,977 | |
| Net Profit/Sales | -59.59% | -29.70% | -14.58% | -8.71% | -3.78% | 2.05% | 5.36% | 6.17% | 4.96% | 6.77% | 8.24% | 9.72% | |
| Pro Forma Cash Flow | |||||||||||||
| Month 1 | Month 2 | Month 3 | Month 4 | Month 5 | Month 6 | Month 7 | Month 8 | Month 9 | Month 10 | Month 11 | Month 12 | ||
| Cash Received | |||||||||||||
| Cash from Operations | |||||||||||||
| Cash Sales | $18,150 | $24,535 | $29,835 | $34,695 | $37,430 | $41,470 | $46,500 | $49,500 | $53,500 | $57,100 | $59,160 | $61,500 | |
| Subtotal Cash from Operations | $18,150 | $24,535 | $29,835 | $34,695 | $37,430 | $41,470 | $46,500 | $49,500 | $53,500 | $57,100 | $59,160 | $61,500 | |
| Additional Cash Received | |||||||||||||
| Sales Tax, VAT, HST/GST Received | 0.00% | $0 | $0 | $0 | $0 | $0 | $0 | $0 | $0 | $0 | $0 | $0 | $0 |
| New Current Borrowing | $0 | $0 | $0 | $0 | $0 | $0 | $0 | $0 | $0 | $0 | $0 | $0 | |
| New Other Liabilities (interest-free) | $0 | $0 | $0 | $0 | $0 | $0 | $0 | $0 | $0 | $0 | $0 | $0 | |
| New Long-term Liabilities | $0 | $0 | $0 | $0 | $0 | $0 | $0 | $0 | $0 | $0 | $0 | $0 | |
| Sales of Other Current Assets | $0 | $0 | $0 | $0 | $0 | $0 | $0 | $0 | $0 | $0 | $0 | $0 | |
| Sales of Long-term Assets | $0 | $0 | $0 | $0 | $0 | $0 | $0 | $0 | $0 | $0 | $0 | $0 | |
| New Investment Received | $0 | $0 | $0 | $0 | $0 | $0 | $0 | $0 | $0 | $0 | $0 | $0 | |
| Subtotal Cash Received | $18,150 | $24,535 | $29,835 | $34,695 | $37,430 | $41,470 | $46,500 | $49,500 | $53,500 | $57,100 | $59,160 | $61,500 | |
| Expenditures | Month 1 | Month 2 | Month 3 | Month 4 | Month 5 | Month 6 | Month 7 | Month 8 | Month 9 | Month 10 | Month 11 | Month 12 | |
| Expenditures from Operations | |||||||||||||
| Cash Spending | $7,324 | $7,674 | $7,674 | $8,608 | $8,934 | $8,984 | $10,110 | $10,610 | $12,774 | $13,398 | $13,454 | $13,494 | |
| Bill Payments | $453 | $13,575 | $13,102 | $13,232 | $15,076 | $30,156 | $33,674 | $36,196 | $37,577 | $40,316 | $41,554 | $41,974 | |
| Subtotal Spent on Operations | $7,777 | $21,249 | $20,776 | $21,840 | $24,010 | $39,140 | $43,784 | $46,806 | $50,351 | $53,714 | $55,008 | $55,468 | |
| Additional Cash Spent | |||||||||||||
| Sales Tax, VAT, HST/GST Paid Out | $0 | $0 | $0 | $0 | $0 | $0 | $0 | $0 | $0 | $0 | $0 | $0 | |
| Principal Repayment of Current Borrowing | $0 | $0 | $0 | $0 | $0 | $0 | $0 | $0 | $0 | $0 | $0 | $0 | |
| Other Liabilities Principal Repayment | $0 | $0 | $0 | $0 | $0 | $0 | $0 | $0 | $0 | $0 | $0 | $0 | |
| Long-term Liabilities Principal Repayment | $1,813 | $1,813 | $1,813 | $1,813 | $1,813 | $1,813 | $1,813 | $1,813 | $1,813 | $1,813 | $1,813 | $1,813 | |
| Purchase Other Current Assets | $0 | $0 | $0 | $0 | $0 | $0 | $0 | $0 | $0 | $0 | $0 | $0 | |
| Purchase Long-term Assets | $0 | $0 | $0 | $0 | $0 | $0 | $0 | $0 | $0 | $0 | $0 | $0 | |
| Dividends | $0 | $0 | $0 | $0 | $0 | $0 | $0 | $0 | $0 | $0 | $0 | $0 | |
| Subtotal Cash Spent | $9,590 | $23,062 | $22,589 | $23,653 | $25,823 | $40,953 | $45,597 | $48,619 | $52,164 | $55,527 | $56,821 | $57,281 | |
| Net Cash Flow | $8,560 | $1,473 | $7,246 | $11,042 | $11,607 | $517 | $903 | $881 | $1,336 | $1,573 | $2,339 | $4,219 | |
| Cash Balance | $8,560 | $10,033 | $17,279 | $28,322 | $39,929 | $40,446 | $41,349 | $42,230 | $43,566 | $45,139 | $47,478 | $51,697 | |
| Pro Forma Balance Sheet | |||||||||||||
| Month 1 | Month 2 | Month 3 | Month 4 | Month 5 | Month 6 | Month 7 | Month 8 | Month 9 | Month 10 | Month 11 | Month 12 | ||
| Assets | Starting Balances | ||||||||||||
| Current Assets | |||||||||||||
| Cash | $0 | $8,560 | $10,033 | $17,279 | $28,322 | $39,929 | $40,446 | $41,349 | $42,230 | $43,566 | $45,139 | $47,478 | $51,697 |
| Inventory | $65,000 | $56,950 | $45,900 | $32,575 | $18,025 | $18,150 | $20,103 | $22,358 | $24,008 | $26,208 | $27,913 | $29,013 | $30,113 |
| Other Current Assets | $47,360 | $47,360 | $47,360 | $47,360 | $47,360 | $47,360 | $47,360 | $47,360 | $47,360 | $47,360 | $47,360 | $47,360 | $47,360 |
| Total Current Assets | $112,360 | $112,870 | $103,293 | $97,214 | $93,707 | $105,439 | $107,909 | $111,067 | $113,597 | $117,134 | $120,412 | $123,851 | $129,170 |
| Long-term Assets | |||||||||||||
| Long-term Assets | $0 | $0 | $0 | $0 | $0 | $0 | $0 | $0 | $0 | $0 | $0 | $0 | $0 |
| Accumulated Depreciation | $0 | $0 | $0 | $0 | $0 | $0 | $0 | $0 | $0 | $0 | $0 | $0 | $0 |
| Total Long-term Assets | $0 | $0 | $0 | $0 | $0 | $0 | $0 | $0 | $0 | $0 | $0 | $0 | $0 |
| Total Assets | $112,360 | $112,870 | $103,293 | $97,214 | $93,707 | $105,439 | $107,909 | $111,067 | $113,597 | $117,134 | $120,412 | $123,851 | $129,170 |
| Liabilities and Capital | Month 1 | Month 2 | Month 3 | Month 4 | Month 5 | Month 6 | Month 7 | Month 8 | Month 9 | Month 10 | Month 11 | Month 12 | |
| Current Liabilities | |||||||||||||
| Accounts Payable | $0 | $13,138 | $12,662 | $12,746 | $14,074 | $29,036 | $32,469 | $34,947 | $36,234 | $38,931 | $40,156 | $40,536 | $41,692 |
| Current Borrowing | $0 | $0 | $0 | $0 | $0 | $0 | $0 | $0 | $0 | $0 | $0 | $0 | $0 |
| Other Current Liabilities | $0 | $0 | $0 | $0 | $0 | $0 | $0 | $0 | $0 | $0 | $0 | $0 | $0 |
| Subtotal Current Liabilities | $0 | $13,138 | $12,662 | $12,746 | $14,074 | $29,036 | $32,469 | $34,947 | $36,234 | $38,931 | $40,156 | $40,536 | $41,692 |
| Long-term Liabilities | $163,000 | $161,187 | $159,374 | $157,561 | $155,748 | $153,935 | $152,122 | $150,309 | $148,496 | $146,683 | $144,870 | $143,057 | $141,244 |
| Total Liabilities | $163,000 | $174,325 | $172,036 | $170,307 | $169,822 | $182,971 | $184,591 | $185,256 | $184,730 | $185,614 | $185,026 | $183,593 | $182,936 |
| Paid-in Capital | $70,000 | $70,000 | $70,000 | $70,000 | $70,000 | $70,000 | $70,000 | $70,000 | $70,000 | $70,000 | $70,000 | $70,000 | $70,000 |
| Retained Earnings | ($120,640) | ($120,640) | ($120,640) | ($120,640) | ($120,640) | ($120,640) | ($120,640) | ($120,640) | ($120,640) | ($120,640) | ($120,640) | ($120,640) | ($120,640) |
| Earnings | $0 | ($10,816) | ($18,103) | ($22,453) | ($25,476) | ($26,892) | ($26,042) | ($23,549) | ($20,493) | ($17,841) | ($13,975) | ($9,103) | ($3,126) |
| Total Capital | ($50,640) | ($61,456) | ($68,743) | ($73,093) | ($76,116) | ($77,532) | ($76,682) | ($74,189) | ($71,133) | ($68,481) | ($64,615) | ($59,743) | ($53,766) |
| Total Liabilities and Capital | $112,360 | $112,870 | $103,293 | $97,214 | $93,707 | $105,439 | $107,909 | $111,067 | $113,597 | $117,134 | $120,412 | $123,851 | $129,170 |
| Net Worth | ($50,640) | ($61,456) | ($68,743) | ($73,093) | ($76,116) | ($77,532) | ($76,682) | ($74,189) | ($71,133) | ($68,481) | ($64,615) | ($59,743) | ($53,766) |

