
Advanced Technology Pallets
Executive Summary
The scrap tire recycling industry has been around for many years, but uses for recycled scrap tire rubber are in the initial stage, as less than 20% of scrap tires are processed. Approximately 10% are incinerated, generally for power generation, although air quality issues are always a concern as scrap tires, like coal, are dirty fuel. Approximately 4% of our scrap tires are exported to other countries where the casings are used in retread plants or the used tires are sold as is. Currently about 2% are processed into crumb rubber and used in molded products and for modified rubberized asphalt applications, which provides a longer lasting and more durable asphalt surface.
Stockpiles of scrap tires create health problems as they become breeding grounds for rodents, snakes, and mosquitoes, and also are serious fire hazards. With approximately 250 million scrap tires being generated annually in the United States and the existing piles estimated at between 2-3 billion, this represents a serious problem.
ATP-Advanced Technology Pallets a Nevada Corporation (ATP), is proud to present its unique and patented product the RST-PAL Pallet, a new pallet made from recycled scrap tire rubber. The “RST-PAL Pallet” is strong, durable and reusable, providing an alternative to wooden pallets and the expense associated with replacing, repairing and discarding wooden pallets. RST-PAL Pallets might be serial numbered and bar-coded to insure tracking and retrieval so that they can be used over and over again for many years.
The inventor, Dan Radke, has assigned to ATP all patent rights (to the approved and issued patent USPTO # 08/680,476) to manufacture and market the RST-PAL pallets worldwide, in perpetuity.
OUR MISSION
To provide cost effective and durable pallets to all industries and manufacturing.
THE EXISTING PROBLEM
- Wood and plastic pallet life cycle is short and the cost is very high.
- Wood pallets break and need repair or replacement every one or two trips.
- Wood absorbs liquids, gains weight, breaks and splinters, and is difficult to clean.
- Industries demand more durable and long lasting pallets.
- Scrap tire stockpiles are an environmental hazard.
- Current pallets made of wood, are consuming over 3.5 million trees annually.
THE SOLUTION
- RST-PAL pallets are less costly to buy and maintain.
- RST-PAL pallets are more durable and indestructible.
- RST-PAL pallets can support 15 times the load of a similar wooden pallet.
- RST-PAL pallets are rackable, stackable, more durable and longer lasting.
- RST-PAL pallets are unique, made from recycled scrap tire rubber using a newly patented process that includes rubber, recycled plastics and a binder system.
- RST-PAL pallets are guaranteed for years.
- RST-PAL pallets have no competition worldwide.
TECHNOLOGY AND PROCESS
- The materials process and the manufacturing of pallets are based on an approved and issued patent (USPTO # 08/680,476).
- International (PCT) patent protection filed.
- Production line machinery is available and has been sourced.
- Raw materials are readily available and have been sourced.
- Flexible production line allows for building various pallet sizes, with high yield and quality.
- Product is production “ready”. All R&D and qualification complete.
- Process based on modular capacity that allows for quick manufacturing expansion.
- Factory is environmentally “clean” with no waste stream.
- Prototypes have been built, tested, and qualified.
THE MARKET
- U.S. consumption of pallets is 800 million a year (National Wooden Pallet and Container Association, NWPCA).
- RST-PAL pallets have the lowest life cycle cost compared to wood, aluminum, and plastic.
- Global Pallets-leasing options available.
- Marketing to focus on both closed and open loop distribution systems.
- Worldwide markets and licensing opportunities (Internationally protected patents).
- U.S. Government Agencies and Contractors markets.
- U.S. government has mandated product replacement with recycled products first.
MARKET QUOTATIONS
- “Quality, reusable multi-trip pallets instead of poorly constructed single user pallets” is needed ASAP. (Reference: NWPCA)
- Contractors doing business with the government are required to purchase “environmentally friendly” and “recycled products” products first. (Reference: President Clinton Executive order)
SALES
- Prototypes were evaluated by different industries, including military and government agencies with positive feedback.
- Potential sales pending investment and production ramp up.
- Environmental incentives to certain markets (Government sub-contractors).
- All licenses, permits, governmental agencies acquired and in support of project.
PALLET COST COMPARISON – OVER FIVE YEARS
- Use of RST-PAL pallets demonstrates substantial savings, $22 for RST-PAL pallet vs. $133 for total cost for wooden pallet, over 5 years. (See Topic 4.2 and 4.3.1).
INVESTMENT REQUIRED AND USE OF FUNDS
- $6M investment for 35% ownership estimated to reach profitability within 12-18 months.
- From the second year forward, 50% of the net profit after tax will be distributed as dividends to the shareholders (as long as it will not affect the planned expansion). The other 50% will be dedicated to growth.
- Funds raised will be used for plant setup, operations, equipment, marketing and sales.
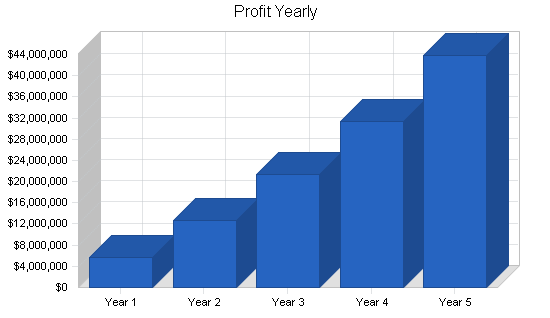
First year operation with two production lines is expected to produce 1,137,000 units, with a projected net profit of over $8 million.
INVESTOR DISCUSSION
- Projections reflect the return of the original investment in less than two years.
- Approximately six times valuation, based on discounting of five years of net earnings to present value.
- Present Value of five years of projected net earnings at a 25% discount (incl. risk factor) is $98 million.
- Reaching less than 1% of the market share with five plants within five years.
- Projected revenue of approximately $402 million.
- Projected net profit (before taxes) of approximately $178 million.
- Management Team – Strong and professional with highly specialized consultants.
- Exit Strategy alternatives: (a) IPO after two years; (b) Acquisition; (c) Private ownership with a long horizon of profits.
RST-PAL Pallets — MANUFACTURED FROM RECYCLED SCRAP TIRE RUBBER
HELPING TO CLEAN UP AMERICA’S SCRAP TIRES
1.1 Mission
ATP is a manufacturing and marketing company dedicated to providing to all industries cost effective and durable pallets made from recycled scrap tires. The manufacturing process and the product are patent protected worldwide with no existing competition.
Pallet users, both manufacturers of commodities and industries that use pallets for their main distribution, demand a more durable and longer lasting pallet to replace wooden pallets that require constant repairing, replacing and discarding. The National Wooden Pallet and Container Association states that a wooden pallet gives service for only one to two trips before having to be repaired or replaced. Because of the short life cycle of wood (and plastic) pallets, pallet users are forced to purchase pallets more often.
Scrap tire stockpiles throughout the United States represent dangerous environmental hazards as they are breeding grounds for mosquitoes, rodents, and snakes, and create potential hazards for fires, which are extremely dangerous and expensive to extinguish.
ATP will reduce scrap tire stockpiles hazards and will help to conserve some of the 3.5 million trees harvested each year to manufacture wooden pallets. ATP will locate its manufacturing plants in rural towns, near large metropolitan areas, where employment is needed the most.
ATP will earn profits and provide excellent return to its investors while at the same time financing an aggressive growth of the company to increase production each year. ATP will also maintain a friendly, fair, and creative work environment, which respects diversity, product improvement, and hard work.
1.2 Objectives
- To establish two production lines at the first plant in Stamford, Texas in order to produce 1.2 million pallets annually, with projected net income (before taxes) in excess of $8 million.
- To expand production annually by opening a plant with two additional lines of production each year for years two through five.
- Achieve targeted market share of 0.15% in the first production year to 0.75% by the end of year five. (800 million pallets are manufactured and sold annually in the U.S.)
- First year projected market share of 0.15% is expected to bring net profits of $8 million (before taxes), and 0.75% of the market share in year five is projected to bring net profits of $66 million. Accumulated profits (before taxes) are projected to be $173 million for the first five years of production.
- ATP will take advantage of the acute need for solutions to America’s scrap tire problems, and establish plants in different locations where scrap tires are abundantly available, while taking advantage of benefits and subsidies offered by different State Government programs for the remediation of scrap tires.
- Develop foreign markets, through licensing agreements, especially in Europe and the Far East, where similar acute problems of scrap tires exist.
1.3 Keys to Success
ATP will succeed for the following reasons:

- An existing pallet market in the U.S. of over 800 million pallets sold annually. It is estimated that approximately 60% are hardwood pallets; these users are ATP’s targeted customers.
- RST-PAL pallets have the lowest life cycle costs compared to wooden or plastic pallets.
- RST-PAL pallets are patent protected, are durable and virtually indestructible, and can carry in excess of 15 times the load of wooden pallets.
- RST-PAL pallets are guaranteed for years.
- Pallets are a well-known, necessary and established product; therefore there is no need to penetrate the market with a totally new product. In fact, RST-PAL pallets are not a new product at all, but are far superior, durable and longer lasting than anything comparable in the market place. The advertising and marketing costs will remain low as the RST-PAL pallets are introduced to pallet users through trade shows and conventions, with ATP’s sales representatives located in targeted marketing regions. The first targeted marketing region is Dallas/Fort Worth, Texas, near the first plant in Stamford, Texas.
- The U.S. government has mandated, through an executive order, a “buy recycled first” for all government agencies and contractors, including the Department of Defense and Department of Transportation. ATP will target federal and state agencies to market RST-PAL pallets.
Company Summary
A.T.P.-Advanced Technology Pallets (ATP) a Nevada Corporation was formed to create a joint venture with the participation of the new investors and the current owners: RST Manufacturing LLC and Elie Banensohn, ATP’s Vice President.
ATP will manufacture and market worldwide the RST-PAL Pallet, made from a patent protected new material that includes the use of recycled scrap tire rubber. The pallet will be an affordable alternative to the high cost of purchasing, repairing, replacing, and discarding wooden pallets. Pallet users purchasing RST-PAL pallets will realize substantial savings in their pallet costs.
ATP is a new entity with RST Manufacturing LLC, becoming a shareholder. RST Manufacturing has invested in excess of $1 million to date, to complete research and development, prototypes, and pre-production marketing of the pallets. Plant property in Stamford, Texas, initial machinery, materials and supplies were purchased to bring the project to where it is today so that we can move into production and marketing of the RST-PAL Pallets through ATP. RST will transfer all assets to ATP. These efforts include the issuance of USPTO #08/680,476 in July 2002, a Utility Patent that will protect the unique material, and the product, RST-PAL Pallets.
All patent rights to manufacture and market the RST-PAL Pallets worldwide, are assigned in perpetuity to ATP by the inventor and ATP’s president, Dan Radke.
The Company’s was formed as a Standard C Corporation under the laws of the State of Nevada. The principal offices are presently located in Las Vegas, NV.
2.1 Company Ownership
Upon completion of the offering ATP a Nevada Corporation, will be owned by:
- RST Manufacturing, LLC – 50%,
- ATP’s V.P.- Elie Banensohn – 15%,
- The new investors (up to) – 35%
ATP is offering 35% of its shares to raise $6 million as additional capital needed for starting the first plant (with two production lines), in Stamford, Texas. ATP National Headquarters is in Las Vegas, Nevada and sales representatives will be positioned in targeted marketing areas.
The majority owner of RST Manufacturing LLC, is the inventor of the new material and the RST-PAL pallet, Mr. Dan R. Radke, the President of ATP.
The inventor, Dan Radke, has assigned all patent rights to ATP to manufacture and market the RST-PAL pallets worldwide in perpetuity.
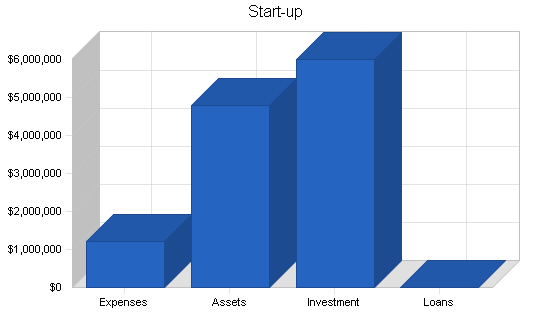
2.2 Start-up Summary
The following summary table shows the projected start-up costs during the seven months needed to get into production. It includes the supply of specific machinery and equipment needed for the production lines. The start-up costs are to be financed by the money raised through this Private Placement Memorandum Offer.
The funds sought for opening the plant with two production lines is $6 million with projected net profits, in the first year of over $7 million. Alternatively, as a minimum plan, we could open with one line of production with funds of $4 million. In this case, the projected net profit, in the first year is over $3 million. In either case, about $750,000 will be available as working capital for the first six months of operations (after the plant is in production).
Management expects to begin production in approximately 180-200 days from funding as detailed in the Start-Up table.
| Long-term Assets | |
| Equipment and Machinery | $3,827,800 |
| Plant Improvements | $200,000 |
| LV Truck | $3,000 |
| Plant Vehicle | $2,400 |
| Total Equipment and Plant | $4,033,200 |
| Start-up | |
| Requirements | |
| Start-up Expenses | |
| Legal | $37,000 |
| Fees & Commissions | $720,000 |
| Management (2) | $117,300 |
| Employee Salaries (office, plant, sales) | $51,500 |
| Consultants (up to 5) | $57,000 |
| Accounting | $7,500 |
| Travel (airfare/rentals/hotels, etc.) | $75,000 |
| Office supply & equipment | $15,000 |
| Insurance | $7,500 |
| Telephone | $4,100 |
| House Rental | $3,000 |
| Plant Utilities | $4,000 |
| Marketing | $45,000 |
| Expensed Office Equipment | $15,000 |
| Other (incl. overseas) | $54,000 |
| Total Start-up Expenses | $1,212,900 |
| Start-up Assets | |
| Cash Required | $753,900 |
| Start-up Inventory | $0 |
| Other Current Assets | $0 |
| Long-term Assets | $4,033,200 |
| Total Assets | $4,787,100 |
| Total Requirements | $6,000,000 |
| Start-up Funding | |
| Start-up Expenses to Fund | $1,212,900 |
| Start-up Assets to Fund | $4,787,100 |
| Total Funding Required | $6,000,000 |
| Assets | |
| Non-cash Assets from Start-up | $4,033,200 |
| Cash Requirements from Start-up | $753,900 |
| Additional Cash Raised | $0 |
| Cash Balance on Starting Date | $753,900 |
| Total Assets | $4,787,100 |
| Liabilities and Capital | |
| Liabilities | |
| Current Borrowing | $0 |
| Long-term Liabilities | $0 |
| Accounts Payable (Outstanding Bills) | $0 |
| Other Current Liabilities (interest-free) | $0 |
| Total Liabilities | $0 |
| Capital | |
| Planned Investment | |
| P.P.M. Offering | $6,000,000 |
| Investor 2 | $0 |
| Other | $0 |
| Additional Investment Requirement | $0 |
| Total Planned Investment | $6,000,000 |
| Loss at Start-up (Start-up Expenses) | ($1,212,900) |
| Total Capital | $4,787,100 |
| Total Capital and Liabilities | $4,787,100 |
| Total Funding | $6,000,000 |
Products
ATP’s product – the RST-PAL pallet is a unique and revolutionary pallet made from a new, patent protected, material of recycled scrap tires, a small amount of recycled plastic and a bonding process. The function specifications of our pallets are identical to the existing wooden pallets (e.g. sizes, four ways entry, upper deck coverage etc.) except that RST-PAL pallets are much more durable and longer lasting which makes penetration into the existing markets less difficult. The patented process and product gives our RST-PAL pallets the following advantages over the existing pallets:
- RST-PAL pallets are less costly to buy and maintain.
- RST-PAL pallets are more durable and indestructible.
- RST-PAL pallets carry 15 times the load of a similar wood pallet.
- RST-PAL pallets are rackable, stackable, and longer lasting than wooden pallets.
- RST-PAL pallets do not absorb liquids and are easy to clean.
- RST-PAL pallets are guaranteed for years.
- RST-PAL pallets have NO competition.
- RST-PAL pallets are environmentally friendly and are, themselves, a recyclable product.
- RST-PAL pallets are made of recycled scrap tire rubber material using a newly patented process which includes rubber, recycled plastics, and a binder system.
It is a rare occasion when a company can make a significant contribution to our environment as well as create an important long awaited product that will provide substantial cost savings for its users and allow them the opportunity to use and promote environmentally friendly, recycled products.
According to a study by the Business Communications Services, Norwalk, CT., wooden pallets will come under increasing challenges from alternative pallet materials such as corrugated cardboard, plastic, and metal. The study, titled “The Changing Competitive Pallet Industry”, states the lost market share for wood “will be a direct result of environmental concerns, and the successful introduction of pallet leasing and alternative pallets made from new materials”. The study said corrugated pallets were chosen “because of their easy disposal and their light weight, although they are slightly more expensive and more susceptible to damage than wood. The study predicts market share growth for corrugated to jump from 5.6 million units in 1991 to 20 million by 2001. It predicts plastic pallets will grow from 0.9 million units to 1.5 million in 2001. Growth for wood pallets was estimated at 1.4% per year over the next ten years.
According to the National Wooden Pallet Container Association (NWPCA), its Strategic Planning Committee suggests that its members educate pallet users toward using higher quality, reusable multi-trip pallets instead of cheaper single use pallets. From a list of 62 potential threats to the wooden pallet industry, the committee chose lumber supply/raw material availability as the top threat. Other top threats identified by the committee include frozen thinking on the part of the industry, demonstrated by an unwillingness to recognize or adapt to the new realities of the marketplace, and environmentalists, a threat recently demonstrated by the draft Executive Order which would have banned wood pallets from use by the Federal Government.
A Clinton Administration Executive Order entitled “Federal Recycling, Acquisition and Use of Environmentally Preferable Products and Services” requires government agencies and those doing business under government contract to begin using “environmentally preferable” products made from recycled materials.
Paul Evanko, principal and vice president, St. Orge Company, York, PA, stated, “Pallets must adhere to a high quality standard”. “Poor quality pallets carry a hidden cost beyond the price paid and customers should be encouraged to purchase the best quality they can”. “Alternative materials including plastic, recycled and composite materials will emerge and pallet users will seek these pallets because of limited storage space, efficient handling weight and full four-way entry,” Evanko contends. “Wood will still be predominant,” Evanko said, “but there is a niche for alternative materials in the distribution flows”.
The Earth Works Group, Berkeley, CA states; “U.S. companies could be spending up to $1.75 billion dollars a year just to throw wooden pallets into landfills”. The Pallet Container Research Laboratory at Virginia Polytechnic Institute and State University, Blacksburg, VA states “calculations show the annual wooden pallet production in the U.S. is using in excess of 3.5 million trees”.
3.1 Innovative Technology
Background (*)
A major technological obstacle, which the recycled rubber market must overcome, is the nature of the rubber itself. Rubber used in the manufacturing of tires is vulcanized (rubber + sulfur) combined in the presence of heat and thermo set (formed into shape by steam and pressure – also referred to as a “cured” product). To date, no technology has been able to devulcanize rubber (break the carbon-sulfur bonds).
As such, thermo set rubber cannot chemically bond with any other polymer (rubber or plastic) to a degree anywhere approaching the uncured rubber. If, however current research is able to remove this obstacle, a very significant market will be opened.
(*) Scrap Tire Management Council, 1400 K Street, Washington, D.C.
Current usage
Today’s usage of scrap tire rubber reaches about 7% of the annually accumulated scrap tires. Each year, about 250 million scrap tires accumulate throughout the U.S. This quantity of tires represents 3.75 billion pounds of crumb rubber from which only 262 million pounds (7%) are recycled and another 187 million pounds (5%) are used as tire derived fuel (TDF), which is a dirty fuel like coal, and requires strict EPA controls, is only being burned in a few states.
According to the Scrap Tire Management Council there were seven markets listed for recycled scrap tire rubber. These markets without exception utilize crumb rubber with all of the steel, wire, and textile removed, as an additive to rubber-modified asphalt (25%); pneumatic tires (25%); athletic fields (20%); bound rubber products (15%); friction material (5%); molded rubber products (5%); and molded rubber/plastic products (5%).
The new technology and the patent
Mr. Dan Radke has overcome the obstacle mentioned in the article, (para.1) above. Mr. Radke’s invention of this “unique new material” through formulation and different particle sized recycled scrap tire rubber has created a tough, durable, hard and rigid material from which RST-PAL pallets are manufactured. The process is absolutely unique as proven by the issue of the utility patent protecting the pallet and process of making thereof. This unique and strong material and the usage of it for making pallets will save pallet users throughout the world millions of dollars annually in costs associated with purchasing, repairing, replacing and discarding broken wooden pallets.
Market Analysis Summary
U.S. yearly consumption of pallets is 800 million a year, costing over $10 billion (according to National Wooden Pallet and Container Association). Our first market will be a 200 miles radius area around Dallas/Fort Worth in which the yearly consumption is 60 million pallets. Our markets for the RST-PAL pallets are all industries and users of pallets. About 300 interested users for our RST-PAL pallets (each of them buying over 100,000 pallets/yr) were contacted.
- RST-PAL pallets have the lowest life cycle cost compared to hard wood and plastic.
- Global Pallets leasing.
- Closed and open loop systems.
- Worldwide markets and licensing opportunities (Internationally patent protection filed).
- U.S. Defense and Transportation Departments market. U.S. government has mandated product replacement with recycled products.
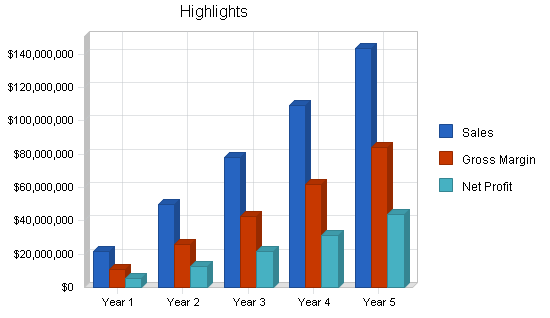
ATP’s target in the first year is to produce 1.14 million pallets with two lines of production (constitutes 0.15% of the market), reach sales of $22 million, and ATP projects to earn profits of over $8 million (before tax).
The growth projection for the next five years is to add a new plant with two lines each year, reaching production in excess of six million pallets by the fifth year, (0.75% of the market), with sales projected at $143 million and profits before taxes of over $66 million.
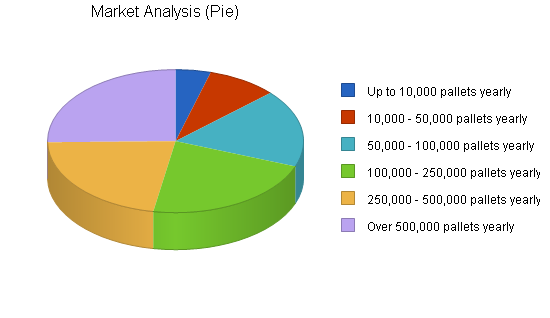
4.1 Market Segmentation
Due to the fact that ATP’s projected plan is to open a new plant each year over the next five years, and to capture 0.15% to 0.75% of the U.S. pallet market, our main growth problem will be the limited abilities to supply the potential demand. Although we segmented the market into six groups we cannot indicate the percentage of growth for each segment, as the growth is not linear. The percentage represents our relative emphasis of this segment.
Yearly Pallet Users – Potential Customers
|
Total Yearly Production |
1,137,024 |
2,467,584 |
3,701,376 |
4,935,168 |
6,168960 |
| % of the Pallet Market |
0.143 |
0.308 |
0.463 |
0.617 |
0.771 |
Total: Five year production =18,410,112. % of the pallet market =0.46
| Market Analysis | |||||||
| Year 1 | Year 2 | Year 3 | Year 4 | Year 5 | |||
| Potential Customers | Growth | CAGR | |||||
| Up to 10,000 pallets yearly | 5% | 50,000 | 150,000 | 250,000 | 400,000 | 500,000 | 77.83% |
| 10,000 – 50,000 pallets yearly | 5% | 100,000 | 200,000 | 450,000 | 450,000 | 500,000 | 49.53% |
| 50,000 – 100,000 pallets yearly | 10% | 200,000 | 220,000 | 700,000 | 800,000 | 900,000 | 45.65% |
| 100,000 – 250,000 pallets yearly | 20% | 250,000 | 500,000 | 700,000 | 1,000,000 | 1,250,000 | 49.53% |
| 250,000 – 500,000 pallets yearly | 25% | 250,000 | 650,000 | 750,000 | 1,100,000 | 1,250,000 | 49.53% |
| Over 500,000 pallets yearly | 35% | 287,024 | 747,584 | 851,376 | 1,185,168 | 1,768,960 | 57.56% |
| Total | 52.62% | 1,137,024 | 2,467,584 | 3,701,376 | 4,935,168 | 6,168,960 | 52.62% |
4.2 Target Market Segment Strategy
The following table demonstrates the cost savings that will be realized when a company converts its wooden pallet inventory to RST-PAL pallets.
Currently new hardwood pallets, (example: 40″x48″, four-way entry, 80% top deck coverage) are sold from $12 to $24 per pallet depending on the geographical area where you are purchasing your pallets, and the always fluctuating cost of hardwood. For the purpose of this chart we show the lowest price for large quantities of hardwood pallets at $10.
CHEP Pallet, Inc., the largest pallet leasing company in the world currently pays $23.50 to construct its pallets.
A pallet user of 100,000 new pallets per year will be saving over $3 million within 5 years using our RST-PAL pallets.
| Year 1 | Year 2 | Year 3 | Year 4 | Year 5 | Total 5 year | |
| Company A buys 100,000 pallets/year @$10.00 | $1,000,000 | $1,000,000 | $1,000,000 | $1,000,000 | $1,000,000 | $5,000,000 |
| Company B buys 100,000 RST-PAL pallets @$18.50 (One time purchase) | $1,850,000 | $0 | $0 | $0 | $0 | $1,850,000 |
| TOTAL SAVINGS | $3,150,000 |
The table demonstrates that big users will realize huge savings. For example, one poultry processing plant that purchases one million pallets per year (about the production of one ATP plant) will realize savings of over $31 million within five years which will encourage them to convert their wooden pallet inventory to RST-PAL pallets.
Big users, as mentioned above, might accelerate our growth plan even quicker. This is the reason that strategically, our marketing efforts will concentrate towards the big users. Our marketing effort will be directed also to all government agencies including the U.S. military. Contractors doing business with the government should be using “environmentally preferable” products, (President Clinton Executive order).
4.2.1 Sample of Advertisment Content
RST-PAL PALLETS
COMING SOON
THE NEW SOLUTION TO COSTLY
REPAIRS AND REPLACEMENT OF
WOODEN PALLETS
RST-PAL pallets are not affected by heat or cold. Won’t rot, split or mildew
STRONG & IMPACT RESISTANT, No more rusty nails, splinters, broken boards and runners
RST-PAL PALLETS are 100% Recyclable, made from post consumer waste. No disposal costs
RST-PAL pallets, offering a new solution to an old problem
- RST-PAL pallets made from new tough materials = virtually indestructible.
- RST-PAL pallets are tougher, longer lasting pallets.
- Many years of repeated usage make RST-PAL pallets the best buy.
- Close your pallet repair facilities, our pallets don’t break.
- Stronger and more durable than wood or plastic.
- Easily trackable with bar coding or electronic chip.
RECYCLE / RE-USE of RST-PAL pallets represents a great innovation to the pallet industry with a major cost savings.
RST-PAL pallets address important environmental issues; help clean up America’s growing scrap tire problem and conserve valuable timber resources by using old tires to transport America’s commodities to consumers.
4.3 Industry Analysis
The pallet industry’s computation of the cost of a pallet includes the costs of production, maintenance and repairs, and discarding of the broken pallet. In the last decade, materials other than wood were introduced to the pallet industry like plastic, metal and corrugated cardboard, but still over 90% remain wood.
More than eight hundred million wooden pallets are constructed each year in the U.S., according to the National Wooden Pallet and Container Association (NWPCA). Most wooden pallets must be replaced or repaired after only one to two trips. It is estimated that over 3.5 million trees are used each year for pallet production, and most of these pallets end up in landfills, burned, or composted.
For years pallet users have been asking NWPCA members to build stronger and more durable pallets that would last longer, but nothing has changed. Pallet manufacturers favor the ongoing replacement prevalent in the industry.
The Recycled Scrap Tire industry generates more than two hundred fifty million scrap tires annually in the United States, one scrap tire for every American. These scrap tires are piling up, adding to the existing stockpile of an estimated two to three billion scrap tires located across the nation causing dangerous environmental hazards. Most states have adopted emergency scrap tire programs to help solve the growing problem of accumulations of scrap tires. The state of Texas has a scrap tire program; collecting and processing more than two hundred thousand tons of scrap tire rubber annually. Currently Texas has more than three million tons of shredded scrap tire rubber on the ground, available to end-users.
ATP with its RST-PAL pallet product will utilize Texas’ scrap tires to manufacture pallets at its first plant in Stamford, TX. The RST-PAL pallets will provide tough and durable pallets to pallet users while helping clean up the scrap tire problem.
ATP’s patented material and the manufacturing process to make pallets from scrap tires is the ultimate solution to the problems presented above: a) stronger and more durable pallets; b) reducing scrap tire stockpiles; c) saving trees. The use of RST-PAL pallets provides an excellent cost effective price, competitive to hardwood pallet prices.
The table in Topic 4.2 demonstrates the savings for a pallet user that purchases 100,000 pallets annually, when converting from wood to RST-PAL pallets. It shows savings over a five year period of more than $3 million. This saving comes on top of other benefits of using the RST-PAL pallets including: more durable and indestructible, carries 15 times the load of wooden pallets, rackable and stackable, will not absorb liquids (can be stored outside), and guaranteed for years. ATP’s first plant is located in Stamford, Texas, a rural community that is badly in need of economic development and new jobs. Stamford is approximately 150 miles from our first targeted marketing area the Dallas/Ft.Worth Metroplex.
4.3.1 Competition and Buying Patterns
There is NO direct competition to RST-PAL pallets and no similar pallets exist today. The inventor, Dan Radke, has granted, in perpetuity, to ATP Corp the sole rights of utilizing the patent worldwide. This patent (USPTO # 08/680,476) gives very wide protection to the revolutionary invention of special material and to the process of making pallets.
The “competition” comes from pallets made of other materials like wood and plastic. Pallet users that use hardwood pallets do not use pallets made of corrugated cardboard. The table below demonstrates the cost comparison among the different pallets:
PALLET COST COMPARISONS – OVER 5 YEARS (in USD)
| Pallet: Made of | Unit Price | Repair Cost/yr* | Replace. u/p x 4 | Recycle $1/yr | Total Cost | Average Cost |
| Hardwood | 12 – 24 | 120* | 48 – 96 | 5 | 185 – 245 | 215 |
| Plastic | 39 – 89 | 0 | 156 – 356 | 5 | 200 – 450 | 325 |
| RST-PAL | 19 – 25 | 0 | 0 | 0 | 19 – 25 | 22 |
(*) Six repairs per year costing $4 each x 5 years.
The table clearly shows that costs over five years of the hardwood pallet is almost ten times that of RST-PAL pallets. In addition to the savings, there are other advantages such as the guarantee, no need to repair, can be stored outside (no liquids are absorbed), washable (important in the food industry), rackable and stackable, strong and indestructible. Bar-coding and electronic chips can be molded into the pallet to allow for specific inventory information regarding what is loaded on the pallet and for tracking.
There is no competition to RST-PAL pallets. There is no competitor making pallets from recycled rubber. ATP anticipates that our limited production will cause our five years expansion plan to be revised in order to meet the demand. Our first plant is expected to produce approximately 1.14 million pallets in the first year and 1.23 million from the second year forward. While the market for pallets is in excess of 800 million annually, ATP expects to capture about 0.15% of the market in the first year, and 0.75% after five years to meet our projections. This takes a great part of the risk out of the project.
ATP has already explored opening a subsidiary company that will lease or lease to own pallets to companies. This will enable ATP to compete with CHEP Pallet Corporation, which leases wooden pallets. CHEP has about 300 branches in the U.S. and also operates in foreign countries. Leasing RST-PAL pallets would be very profitable, as our pallets do not require repairs.
Strategy and Implementation Summary
Due to the increased lifecycle and interchangeability of the RST-PAL pallets with existing wooden pallets, ATP’s customers derive value from utilizing these innovative products in a number of ways. First and foremost, using and replacing the user’s wooden pallet inventory with RST-PAL pallets eliminates ongoing maintenance and replacement costs.
Another value is the longevity RST-PAL pallets offer. RST-PAL pallets have the longest life-cycle regardless of hot, cold, or wet climates or in environments where maintenance is difficult. RST-PAL Pallets will not rot, which is a common problem for wooden pallets.
RST-PAL pallets are manufactured from recycled materials mainly scrap automotive tires. Each 1,000 pallets use 25 tons of scrap tires from landfills, (31,000 tons or 62,000 pounds per plant per year).
RST-PAL pallets will help save hardwood forests currently used to manufacture wooden pallets, reduce greenhouse gases, use significant amounts of waste plastics and scrap tires from landfills and storage facilities, and reduce pallet users costs while increasing profits.
5.1 Competitive Edge
ATP’s most important competitive edge is based on the unique and patented material used to manufacture the RST-PAL pallets. The process, the unique material, and the use of the material to manufacture pallets are protected by the issued utility patent that will prevent duplication or “copycat” competition.
RST-PAL pallets are manufactured from recycled scrap tires. Federal law and most State Governments require agencies and contractors to purchase recycled products first, as mandated by “buy recycled products first”. ATP has already presented RST-PAL pallets to the Army, Air Force Exchange System, (AAFES) located in Texas and throughout the Pacific Rim, and AAFES is interested in purchasing pallets, which will increase their pallet lifecycle, which in the long run is less costly than wooden pallets. We will focus on different government agencies including the Department of Defense and Department of Transportation to introduce and market RST-PAL pallets.
RST-PAL pallets can be power washed or steam cleaned which is a critical factor in the food industry, such as in poultry and meat processing plants, which must maintain sanitized production areas. RST-PAL pallets do not absorb liquids as wooden pallets and they can be stored outside without occupying expensive indoor space.
The RST-PAL pallets are a “triple green” product. They are manufactured from recycled materials, and can be recycled in the event they ever wear out, and they will help conserve our nation’s forests while helping clean up America’s scrap tire problems.
The RST-PAL pallets will be the best cost/performance pallets in the market. The summary of advantages that our pallets have in comparison to existing material pallets such as hardwood, plastic, corrugated cardboard, and aluminum, are:
- Much less cost to buy and maintain.
- More durable and indestructible.
- Carries 15x the load of a similar wood pallet.
- The pallets are rackable and stackable.
- Made of recycled material.
- The pallet and the process are patent protected worldwide.
- Guaranteed for years.
- The supply of the raw material (scrap tires) is available and accessible throughout the country, and most States have legislated scrap tire cleanup programs that offer subsidies and grants to help remediate their scrap tire problems.
- An electronic chip for pallet identification and load identification will be available with RST-PAL pallets, and this can be done because of the strength and rigidity of the pallet, which is practically indestructible.
5.2 Marketing Strategy
The RST-PAL pallet is positioned uniquely as all industries and manufacturers use pallets to transport everything from commodities to equipment and parts. The main segmentation among the users is found in how they use pallets. The Power industry uses in excess of twenty million pallets annually, government owned poultry processing plants use more than ten million pallets annually, 3M Corporation purchased seven million pallets in one year alone, and the beverage industry uses in excess of fifty million pallets annually. There are also thousands of companies using anywhere from hundreds of thousands to millions of pallets annually including, chemical companies, bag cement, building materials, grocery, paint companies, and many others.
Our first targeted customers are those that use a “closed loop” distribution system, where they manufacture and/or distribute products using their own fleet, where loaded pallets can be dropped and returned when unloaded, to be utilized over and over again. We also will target government entities, agencies, and contractors both Federal and State.
Our marketing strategy is based on informing and introducing the RST-PAL pallet to pallet buyers across the country and in different industries. We can accomplish this at a rapid pace by showcasing the pallets at selected trade shows and conventions. Samples will be available as well as brochures and videotapes explaining the benefits of the RST-PAL pallet. Our first targeted marketing territory will be the Dallas/Ft.Worth Metroplex, concentrating on those companies using a “closed loop” system for distribution.
The marketing will convey the advantages, benefits and the quality of our product in every picture, every promotion, and every publication. Pallet users have been screaming for years for the wooden pallet industry to make a longer lasting more durable pallet, but their request has fallen on deaf ears, as the pallet builders would rather build a less sturdy pallet so that it will fail after only a few trips, requiring the customer to purchase more pallets. The RST-PAL pallet is a solution to the high cost of purchasing, maintaining and discarding wooden pallets. Our marketing efforts will not only focus on educating purchasing agents of companies, but also in making presentations to company board of directors, demonstrating the cost savings and benefits of using RST-PAL pallets. As was shown in a previous example, a company purchasing 100,000 pallets per year when converting to RST-PAL pallets will save in excess of $3 million over five years. With such convincing statistics, we anticipate universal acceptance of RST-PAL pallets.
5.3 Sales Strategy
As stated, ATP will sell pallets as they are manufactured. Pre-production marketing efforts have been on going for the last year. We have established a sales plan, however our production will dictate how quickly our sales team will expand. One company we have contacted expects to purchase 22 million pallets during the next two years. If we were to capture a large contract, our production schedule would be sold out for a number of years. Another sales company that markets products exclusively to the power industry, would like to have an exclusive to sell our pallets to power companies, and they estimate they can sell a minimum of 1.2 million pallets annually. We have approached many companies on the benefits of using RST-PAL pallets, including; 3-M Corporation, Coca-Cola, Pepsi, Snapple, Anhauser Busch, Hunts Wesson, Kraft Foods, S.E. Rycoff, Albertsons, Kroger Foods, Associated Foods, H.E.B. Foods, Purina Pet Foods, manufacturers of charcoal briquettes, flour and cereal mills, salt processors, building materials, including bagged sand and cement, plaster and even chemical companies.
Our concept is to introduce the RST-PAL pallets to many industries, and ATP will do that from our National Marketing Headquarters in Las Vegas, Nevada. The Las Vegas Visitors and Convention Authority will provide a great arena in which to showcase and demonstrate the RST-PAL pallets, as virtually every important convention and trade show now meets in Las Vegas.
This business plan calls for the company to grow itself. The Texas plant will be the first, and we expect new plants to be opened in years two, three, four and five. Some future plant site work has been completed, however we will locate the plants in States with positive scrap tire programs, some of which may provide subsidies for using scrap tire rubber to manufacture new products. In addition, our company policy will be to establish plants near massive scrap tire piles, and in rural communities where a good labor force exists but jobs are not plentiful and economic development will benefit the community.
ATP Corp. is the worldwide licensee to manufacture and market pallets. We have already had several foreign entities show interest in either becoming distributors or manufacturers through a foreign license arrangement. We have held discussions with a group from China, Japan, Taiwan and South Africa and are in contact with a group in Spain that is interested in our technology.
It is our intent to move our Stamford, TX plant into full production, and utilize the same team of key employees and consultants to open new plants over the next five years. Whereas our Business Plan provides for future plants being financed internally from company profits, additional capital can be raised through the licensing of foreign companies wishing to manufacture and market pallets in those countries.
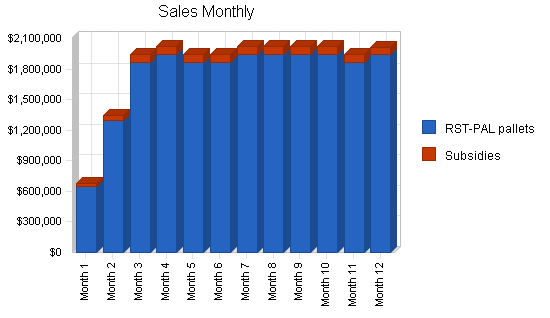
5.3.1 Sales Forecast
Our sales forecast is based on the following assumptions. We expect our production will be sold as soon as it is ready, as the forecasted production is much less than the anticipated demand. Our product is not seasonal and will be continually manufactured throughout the year. We will operate in three shifts (except during training in first two months).
Our sales force will start taking orders sixty days prior to production. The initial selling price is low in order to introduce the pallets to many different manufacturers and industries. However we expect to raise prices at the rate of 5% per year (which is less than the rate of increase of the wooden pallets).
Regarding the “direct cost of sales” (COG), we assume the costs of materials will remain the same for us, due to discounts we will receive for the quantities of materials that we consume which should offset rising costs. We can also reduce our costs by doing some manufacturing processes ourselves, such as mixing and batching the binders at our plant, and by cutting the scrap tire rubber from chips to our required specifications.
We’ve calculated production labor costs, including salaries, taxes, and benefits to be $1.31 per pallet. The break down of production personnel is presented in the Personnel table, Production Personnel category, and the resultant figures appear in the Profit and Loss table under Sales, Production Payroll.
The Sales Forecast table for the first 12 months appears in the appendix.
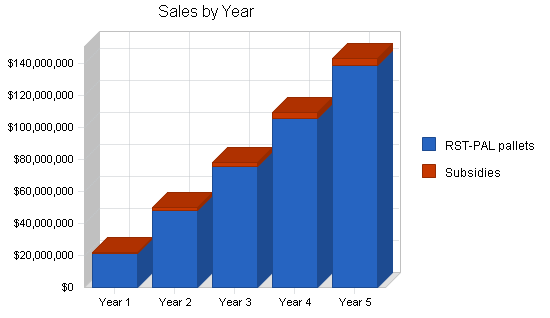
| Sales Forecast | |||||
| Year 1 | Year 2 | Year 3 | Year 4 | Year 5 | |
| Sales | |||||
| RST-PAL pallets | $21,034,944 | $47,932,819 | $75,494,190 | $105,691,866 | $138,720,574 |
| Subsidies | $852,768 | $1,850,688 | $2,776,032 | $3,701,376 | $4,626,720 |
| Total Sales | $21,887,712 | $49,783,507 | $78,270,222 | $109,393,242 | $143,347,294 |
| Direct Cost of Sales | Year 1 | Year 2 | Year 3 | Year 4 | Year 5 |
| Recycled Rubber | $1,421,305 | $3,084,480 | $4,626,720 | $6,168,960 | $7,711,200 |
| Recycled Plastic | $1,023,341 | $2,220,826 | $3,331,238 | $4,441,651 | $5,552,064 |
| Binders System | $7,390,786 | $16,039,296 | $24,058,944 | $32,078,592 | $40,098,240 |
| Subtotal Direct Cost of Sales | $9,835,432 | $21,344,602 | $32,016,902 | $42,689,203 | $53,361,504 |
5.3.2 Pallet Users
PALLET USERS, Dallas / FT. Worth Area
ANNUAL PALLET USAGE.
The following list of pallet users was contacted and the new RST-PAL Pallet was introduced to each user, receiving excellent interest. Another 22 users were also visited. The Total yearly estimated usage of pallets in the DFW area is 60 million.
| American Home Food | 185,000 | Paris Business Forms | 25,000 |
| Purina Mills Inc. | 180,000 | Texas Ready Mix | 55,000 |
| S.E. Raycoff & Co. | 130,000 | Dr. Pepper | 300,000 |
| Pepsico | 75,000 | Coca-Cola bottling | 130,000 |
| Winn-Dixie | 130,000 | Miller Brewing Co. | 95,000 |
| Dannon Yogurt | 45,000 | Ardmore Food | 20,000 |
| Mrs. Crocketts | 15,000 | Champion Dairy Pack | 25,000 |
| Bunge Foods | 60,000 | DAP Inc. | 9,000 |
| K-Klean Chemicals Co. | 22,000 | HPC Lab. | 40,000 |
| First Food Inc. | 11,000 | Featherlite Build Prod. | 55,000 |
| DSC Inc | 10,000 | Dal-Tile Corp | 20,000 |
| Dallas City Packing | 8,000 | Borden Inc. | 30,000 |
| Athena Products | 16,000 | Ashland Chemical | 39,000 |
| Americana Inc. | 45,000 | Texas Instruments | 130,000 |
| Speaco Foods | 17,000 | State Fair Foods | 78,000 |
| Quaker Oats | 345,000 | Bartush-Shnltfu | 7,000 |
| AutoWax | 10,000 | Frito Lay | 55,000 |
| Pilgrims Pride | 35,000 | Oakfarm Dairies | 30,000 |
| Builders Concrete | 15,000 | Hardros Chemicals | 50,000 |
| GAF Corp. | 60,000 | Alpine Frozen | 50,000 |
PALLET USERS, HOUSTON Area
| General Foods Mfg | 91,000 | Gardner Asphalt Corp. | 60,000 |
| Fastner Mfg. Co. | 30,000 | Erie Mfg.Corp. | 70,000 |
| Ella Crew Production | 40,000 | Distribution Int’l | 100,000 |
| Diamond-Kuhn Paint | 40,000 | L&H Packing | 60,000 |
| Lone Star Brewing | 435,000 | CSA Ltd. Inc | 90,000 |
| Uncle Ben’s | 325,000 | Vaneco Products | 20,000 |
| Cal-Tex Citrus | 20,000 | Corev America | 10,000 |
| Cordell Brick | 50,000 | Champion Coating | 40,000 |
| Colorex Co. | 130,000 | Celotex Corp. | 260,000 |
| Cellcote Co. | 10,000 | BTL Speciality Resins | 40,000 |
| BJ Industrial | 20,000 | Baby’s Natural | 20,000 |
| Amy’s Foods | 30,000 | American Rice | 110,000 |
| Advetech Int. | 20,000 | Adams Valves | 30,000 |
| Anheuser Busch | 100,000 |
5.4 Milestones
The following table lists important project milestones during the pre-production start-up period, with dates and managers in charge, and budgets for each milestone. The milestone schedule indicates our emphasis on planning for implementation.
The production schedule is based on three shifts. During the first month only one shift will be in operation, in the second month, two shifts, and from the third month, a full three shifts of production. During the start-up period, the employees will be located and trained.
The municipality of Stamford, Texas will assist us in recruiting about seventy employees. There is an adequate work force within the surrounding communities, which will enable us to choose quality people.
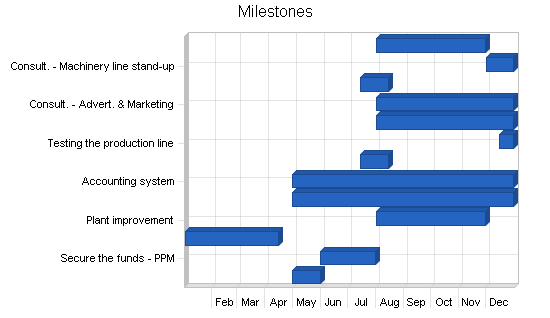
| Milestones | |||||
| Milestone | Start Date | End Date | Budget | Manager | Department |
| Updating the Business Plan | 5/1/2003 | 5/31/2003 | $1,000 | Radke-Banensohn | Management |
| Secure the funds – PPM | 6/1/2003 | 7/31/2003 | $70,000 | Radke-Banensohn | Management |
| Site selection | 1/2/2003 | 4/15/2003 | $0 | Radke-Banensohn | Management |
| Plant improvement | 8/1/2003 | 11/30/2003 | $200,000 | TBA | Operations |
| Legal Agreements | 5/1/2003 | 12/31/2003 | $37,000 | Lyne Rushforth | Legal |
| Accounting system | 5/1/2003 | 12/31/2003 | $7,500 | Richard Dickinson | Accounting |
| Ordering equipment | 7/15/2003 | 8/15/2003 | $3,827,800 | Radke-Banensohn | Management |
| Testing the production line | 12/15/2003 | 12/31/2003 | $7,000 | Richard Turner | Consultant |
| Consult. – Government affairs | 8/1/2003 | 12/31/2003 | $10,000 | Shayne Del Cohen | Consultant |
| Consult. – Advert. & Marketing | 8/1/2003 | 12/31/2003 | $10,000 | William Welter | Consultant |
| Consult. – Machinery acquisition | 7/15/2003 | 8/15/2003 | $10,000 | Gene Pitzer | Consultant |
| Consult. – Machinery line stand-up | 12/1/2003 | 12/31/2003 | $10,000 | Richard Turner | Consultant |
| Consult. – Binder system | 8/1/2003 | 11/30/2003 | $10,000 | Steven Garbukas | Consultant |
| Totals | $4,200,300 | ||||
Management Summary
THE MANAGEMENT TEAM
ATP’s management team and its consultants are qualified professionals with vast experience with plant installation and operations, purchasing and marketing. ATP’s consultants will be employed during the start-up period (see Start-up table). ATP welcomes any additional person from our investor’s group that can contribute to the success of the company.
Dan R. Radke, President: SUMMARY OF QUALIFICATIONS
- Inventor of the material and the product RST-PAL Pallets. Utility patent issued in July 2002, number USPTO 08/680,476.
- Dan Radke, the inventor of the unique material for making the RST-PAL Pallets, has been involved in scrap tire recycling issues for ten years by offering his expertise to government agencies, municipalities, individuals and companies wishing to enter the emerging scrap tire recycling industry, Radke has earned a reputation for his knowledge of the scrap tire industry. Assisted States, Counties and Municipalities to remediate scrap tire problems. Contributed to California Integrated Waste Management Board to develop rules, regulations and guidelines for the States scrap tire program.
- Process, technology inventor, business owner and manager, sales, marketing, production line machinery and equipment, business operations, training and management
- More than 30 years owning and operating start-up companies.
- Three years, international business transactions, as a consultant bringing American Companies to Eastern Europe, primarily Hungary to form U.S./Hungarian Joint Ventures.
- Authored the Hungarian Small Business Foundation to establish loan guarantees for privatization and start up Hungarian Small Businesses, working directly with the Hungarian Banks and Government.
Eliezer Banensohn, Vice President: SUMMARY OF QUALIFICATIONS
- Aeronautical Engineer – B.Sc. degree. Experience in R & D for new products.
- 12 years extensive experience as an expert in marketing of new and revolutionary products in new markets.
- Eight years experience as a specialist in putting up new franchise organizations and licensing operations.
- Won prizes for best business in South-Africa and Argentina (as VP Marketing & Engineering).
- Participated, in engineering capacity, in the development and marketing of revolutionary advanced building system – “Domecrete” in many countries worldwide.
- Participated, in engineering capacity, in the development of Hi-Tech product (Baby-Sense S.I.D.S. detector, medical industry).
- Plant design and Manufacturing experience in plastic, rubber, and metal products, injection molds and machinery. Inventor and patent owner for the product “non-electrical hand operated washing machine”.
- 25 years experience as computer software and hardware analyst.
- 15 years experience in marketing software and hardware computer systems.
- Owned several computer service bureaus using IBM mainframe
Shayne Del Cohen, (Consultant) Public Relations, Government Affairs
- Business and economic development, government relations, grant writing, bid preparation, business trade representations, lobbying, employee relations, training and staff planning.
Gene Pitzer, (Consultant) Machinery & Equipment Acquisitions
- Contract acquisition for machinery and equipment for Stamford, Texas plant, 25 years experience, retired No.1 tool and die manager for General Motors, Owner; Tool Consulting Corporation, developed tire recycling machinery.
Steven Garbukas, (Consultant) Chemical, Epoxy Binder Systems Acquisitions
- Contract acquisition for all special binder systems developed by Dan Radke and Steven Garbukas, source and supply plants with materials at best possible price, provide all injection and delivery systems to material during batching.
Richard Turner, (Consultant) Machinery and Equipment Line Standup, Plant Engineer
- Supervise and install all production line machinery and equipment at the first plant, in Stamford, Texas and all subsequent plants. Initial plant manager, over production and safety, will train employees, including plant manager.
Layne T. Rushforth, (Attorney)
Richard Dickinson, (CPA)
* (Resumes of any of the above people are available on request.)
6.1 Personnel Plan
Our first plant will be located in Stamford, Texas, a rural area close to a large metropolitan city, where large scrap tire stockpiles are located within less than one mile of our plant. The area has a large workforce in desperate need of jobs, which will help ATP recruit qualified and devoted workers, that will be paid more than the average wages for this area, which are less than in more populated areas. The direct labor cost shows that each plant will require approximately 70 workers in three shifts.
The team for the first manufacturing plant is currently being interviewed with the help of Stamford’s Mayor and City Manager. The Personnel table shows the position and salary of the 68 employees that will work in three shifts of eight hours each. Production is based on seven working hours with one hour budgeted for maintenance and crew change. To facilitate training, during the first month one shift will be in operation, in the second month, two shifts and from the third month forward the plant will operate at full production capacity with three shifts.
The Profit & Loss table shows the payroll burden as 23% of the salary, which covers the taxes and benefits for the employees. No increase in wages and salaries have been forecasted, however, it is assumed that as the company grows, employees will receive increases in their wages, salaries and benefits.
The Personnel table shows the direct and active involvement of the company President (the inventor) and the V.P. in all stages of the start up, purchasing of the machinery and running the business. The team includes highly qualified professionals as consultants in different areas that will enable a smooth and efficient entry to production. As the projected expansion takes place, ATP will begin a search for highly qualified management candidates that will manage the company in the future.
ATP will also investigate foreign licensing that will bring additional revenue streams to the company. ATP’s V.P. has already made contacts with foreign entities and has found great interest from foreign companies. Elie (VP) spearheads negotiations for foreign licensing and manufacturing.
The Personnel table for the first 12 months appears in the appendix.
| Personnel Plan | |||||
| Year 1 | Year 2 | Year 3 | Year 4 | Year 5 | |
| Production Personnel | |||||
| Texas plant manager | $48,000 | $96,000 | $144,000 | $192,000 | $240,000 |
| Texas office worker | $14,400 | $28,800 | $43,200 | $57,600 | $72,000 |
| Receptionist (x2) | $23,920 | $49,920 | $74,880 | $99,840 | $124,800 |
| Data entry (x1) | $12,480 | $24,960 | $37,440 | $49,920 | $62,400 |
| Foreman (x3) | $75,600 | $172,800 | $259,200 | $345,600 | $432,000 |
| Line operator (x6) | $113,256 | $247,104 | $370,656 | $494,208 | $617,760 |
| Loader (x6) | $99,528 | $217,152 | $325,728 | $434,304 | $542,880 |
| Batcher (x6) | $102,960 | $224,640 | $336,960 | $449,280 | $561,600 |
| Conveyer worker (x12) | $178,464 | $389,376 | $584,064 | $778,752 | $973,440 |
| Assembly lead (x4) | $66,352 | $144,768 | $217,152 | $289,536 | $361,920 |
| Assembly helper (x4) | $59,488 | $129,792 | $194,688 | $259,584 | $324,480 |
| Cutter (x12) | $211,120 | $434,304 | $651,456 | $868,608 | $1,085,760 |
| Forklift operator (x6) | $105,560 | $217,152 | $325,728 | $434,304 | $542,880 |
| Maint. Supervisor | $18,720 | $37,440 | $56,160 | $74,880 | $93,600 |
| Maint. helper (x3) | $44,616 | $97,344 | $146,016 | $194,688 | $243,360 |
| Other | $0 | $0 | $0 | $0 | $0 |
| Subtotal | $1,174,464 | $2,511,552 | $3,767,328 | $5,023,104 | $6,278,880 |
| Sales and Marketing Personnel | |||||
| Marketing Director | $51,000 | $60,000 | $72,000 | $84,000 | $84,000 |
| Marketing Secretary | $25,200 | $30,000 | $36,000 | $36,000 | $36,000 |
| Other | $0 | $0 | $0 | $0 | $0 |
| Subtotal | $76,200 | $90,000 | $108,000 | $120,000 | $120,000 |
| General and Administrative Personnel | |||||
| President – Dan Radke | $90,000 | $120,000 | $144,000 | $180,000 | $180,000 |
| Vice Pres. – Elie Banenson | $85,000 | $114,000 | $138,000 | $174,000 | $174,000 |
| Office Manager | $37,800 | $42,000 | $48,000 | $48,000 | $48,000 |
| Receptionist (x2) | $27,000 | $40,800 | $40,800 | $48,000 | $48,000 |
| Office workers (x2) | $0 | $36,000 | $48,000 | $48,000 | $48,000 |
| Other | $0 | $0 | $0 | $0 | $0 |
| Subtotal | $239,800 | $352,800 | $418,800 | $498,000 | $498,000 |
| Other Personnel | |||||
| Name or Title | $0 | $0 | $0 | $0 | $0 |
| Name or Title | $0 | $0 | $0 | $0 | $0 |
| Other | $0 | $0 | $0 | $0 | $0 |
| Subtotal | $0 | $0 | $0 | $0 | $0 |
| Total People | 75 | 145 | 213 | 281 | 349 |
| Total Payroll | $1,490,464 | $2,954,352 | $4,294,128 | $5,641,104 | $6,896,880 |
Financial Plan
The projected financial plan is very sound. The one-time investment gives ATP the ability to take 50% of the profits (after tax) as dividends at the end of year two and to self fund expansion by one additional plant per year. The projected cash flow is outstanding and will enable ATP to be even more aggressive in our expansion plans.
As mentioned throughout this Business Plan, each plant will produce a maximum of 100,000 pallets per month, which is very low in comparison to the demand for pallets. (800 million pallets divide by 12 gives approximately an average of 67 million pallets per month sold in the U.S.)
In addition to the expansion within the U.S., overseas licensing projects will be developed, from which we will create additional revenue streams through licensing fees, royalties, and other contractual payments.
ATP may also enter into other joint ventures or partnerships to license other entities to manufacture and market RST-PAL pallets not only in the U.S. but also worldwide.
The last two sources of income are not included in the financial forecast and do not appear in the tables.
7.1 Important Assumptions
The financial plan based on important assumptions, detailed in the following statements:
- Due to the initial limited production in comparison to the market size, ATP assumes that even a slow-growth economy, will not affect our plan for the next five years.
- ATP forecasts that there would be no unforeseen changes in technology to make our products obsolete. Pallet buyers are looking for cost effective solutions for replacing the high cost of purchasing, repairing, and discarding wooden pallets and RST-PAL pallets offer the solution by providing a longer lasting more durable pallet.
- Cash flow is not expected to be a problem, with most pallets being paid for on delivery. There will be exceptions for specific customers, as an example, the U.S. Government, based on the quantity of pallets that are ordered, but generally, payments for pallets will be paid in full upon delivery.
- ATP’s growth is based on internal financial resources. ATP will budget 50% for growth and 50% from the profits as dividends after taxes (from year two forward and as long as it does not affect the planned growth of the company).
- The source of raw material (scrap tires) is virtually endless as long as cars continue to roll on tires. Presently, 250 million tires are added each year to scrap tire stockpiles all over the country.
- ATP assumes a short holding of inventory beyond the curing time of the pallets and transportation arrangements.
- ATP assumes a 5% annual raise in our selling price, which is comparable to the wooden pallet industry and fluctuating lumber costs.
- ATP assumes no raise in our material costs, because the quantities we purchase will increase, and ATP anticipates discounts to offset any increased costs.
- ATP assumes an average sales price per pallet in the first year of production to be $18.50, which is significantly less costly than hardwood pallets whose entire cost includes purchase, repair, maintenance, and discard/disposal.
| General Assumptions | |||||
| Year 1 | Year 2 | Year 3 | Year 4 | Year 5 | |
| Plan Month | 1 | 2 | 3 | 4 | 5 |
| Current Interest Rate | 0.00% | 0.00% | 0.00% | 0.00% | 0.00% |
| Long-term Interest Rate | 0.00% | 0.00% | 0.00% | 0.00% | 0.00% |
| Tax Rate | 33.67% | 34.00% | 33.67% | 34.00% | 33.67% |
| Other | 0 | 0 | 0 | 0 | 0 |
7.2 Break-even Analysis
This break-even analysis shows that ATP has budgeted fixed costs and projects sufficient sales to maintain good cash flow balances. This projection is based on two production lines.
The essential insight here is that ATP’s projected sales levels will be running comfortably above the break-even point.
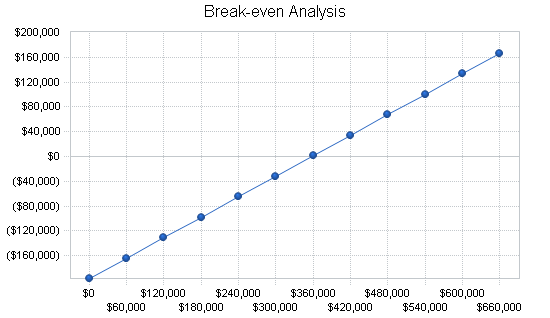
| Break-even Analysis | |
| Monthly Revenue Break-even | $357,289 |
| Assumptions: | |
| Average Percent Variable Cost | 45% |
| Estimated Monthly Fixed Cost | $196,738 |
7.3 Projected Profit and Loss
NOTES TO PROJECTED FINANCIAL STATEMENTS
NOTE 1 – MATERIALS COST
The raw materials, recycled scrap tire rubber, will be provided on an as needed basis. No large stockpiles of material or inventories of recycled rubber shall be stored at the manufacturing site.
The main ingredient of an RST-PAL pallet is recycled scrap tire rubber that has been processed to specific dimensions. There is three million tons of scrap tire shredded rubber on the ground in Texas with ten permitted processors or tire shredders, which want to provide material to ATP.
ATP will purchase scrap tire rubber from a Stamford, Texas processor, and has estimated the cost of material at $1.25/pallet ($50 per ton). It should be noted that ATP is working closely with the Texas Natural Resource and Conservation Commission and ATP may even have an opportunity to acquire surplus scrap tire rubber for less costs. Texas now produces approximately 200,000 tons of scrap tire rubber annually. In addition, the current Texas Legislature is considering paying manufacturers of products using recycled scrap tire rubber, $0.75 per pallet ($30 per ton) as an incentive to increase production of products using scrap tire rubber.
A small amount of recycled plastic is utilized in the formula and its cost is estimated at $0.90 per pallet. In addition a secret formulated binder, developed by the inventor Dan Radke, is used in the manufacture of the pallets, estimated to cost $6.50 per pallet.
NOTE 2 – DIRECT LABOR (Production Payroll) and PAYROLL BURDEN
Projected Direct Labor includes the salary and wages for those employees directly involved in the pallet production process in the plant and is reflected in Topic 6.1. Payroll burden is estimated at 23% (FICA 6.20%; Medicare 1.45%; FUTA .80%; State Unemployment 3.00%; Workers Compensation and Employee Health Benefits 11.55%).
The total Direct Labor cost includes payroll burden and other direct costs such as utilities, building repairs and maintenance, plus plant supplies estimated at 5%. The total for direct labor cost and payroll burden per pallet is estimated at $1.31.
NOTE 3 – ROYALTIES
The Licensing Agreement requires payment of 5% of gross sales to Mr. Radke, the inventor, as royalties. This may be paid quarterly or monthly (5% has been used throughout these projections). There will be no royalties for the first six months of production to help the cash flow of the company.
NOTE 4 -GENERAL & ADMINISTRATIVE WAGES AND PAYROLL BURDEN
The company will employ Management and clerical staff as appears in the Personnel table, Topic 6.1. Additional management members and marketing representatives will be added as needed throughout the growth of the company. Payroll burden estimated at 23% including taxes, W/C, health and employee benefits. During the six-month start-up phase and thereafter, the company will employ experts in the industry as consultants.
NOTE 5 – DEPRECIATION
Machinery and equipment is being depreciated over 10 years, property over 30 years.
NOTE 6 – OFFICE EXPENSES
Provision has been made for estimated general office expenses. Computers and office equipment costing $15,000 is included in the initial start-up budget and Expensed Equipment. The amount budgeted for Year One is $12,000, which will increase at the rate of $12,000 per year with each additional plant.
NOTE 7 – MARKETING and SALES
Management anticipates strong demand for the RST-PAL pallets creating a real challenge for production to keep up with the demand. Back orders are expected and sales on advanced production should drive expansion. With many potential pallet users identified, who currently use from 100,000 to 7 million pallets annually, we will approach the expansion of our national sales force, carefully. ATP does not want a large sales force with production sold out for months in advance. A budget in this category will be used for sales representatives or commissions on sales and is budgeted at $73,000 during year one. Based on attendance at conventions and trade shows it is anticipated that our targeted Dallas – Fort Worth Metropolis, Houston, San Antonio and the rest of Texas will absorb all our production for many years.
A Marketing Director shall develop goals and strategies with the board of directors. ATP plans to hire a qualified director in year one. Sales representatives will be hired and it is anticipated they will receive a base salary with commissions of ten cents per pallet sold. The budget takes these assumptions into consideration.
NOTE 8 – MACHINERY MAINTENANCE
The initial production line machinery will be in good working order, nevertheless, ATP will plan for parts maintenance and replacement. This budget grows as more machinery and plants are established.
NOTE 9 – TAXES
The “taxes incurred” appearing in the P&L represents State of Texas Franchise taxes and Federal Income Taxes for a total of 34%.
The Profit and Loss table for the first 12 months appears in the appendix.
| Pro Forma Profit and Loss | |||||
| Year 1 | Year 2 | Year 3 | Year 4 | Year 5 | |
| Sales | $21,887,712 | $49,783,507 | $78,270,222 | $109,393,242 | $143,347,294 |
| Direct Cost of Sales | $9,835,432 | $21,344,602 | $32,016,902 | $42,689,203 | $53,361,504 |
| Production Payroll | $1,174,464 | $2,511,552 | $3,767,328 | $5,023,104 | $6,278,880 |
| Other Costs of Goods | $0 | $0 | $0 | $0 | $0 |
| Total Cost of Sales | $11,009,896 | $23,856,154 | $35,784,230 | $47,712,307 | $59,640,384 |
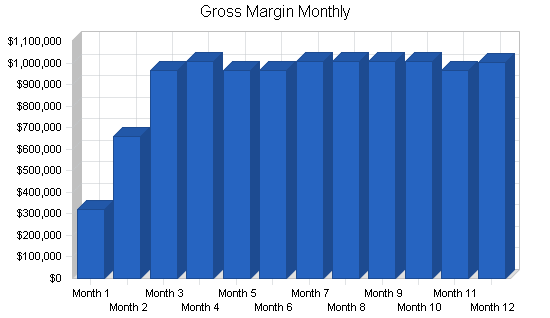
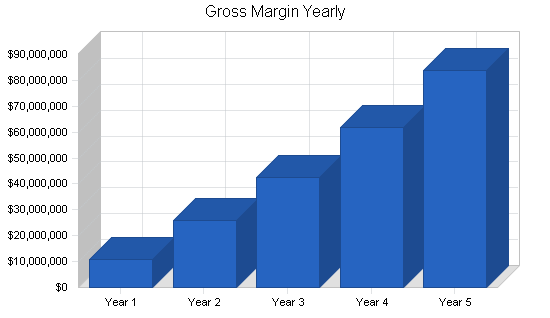
| Gross Margin | $10,877,816 | $25,927,353 | $42,485,992 | $61,680,935 | $83,706,910 |
| Gross Margin % | 49.70% | 52.08% | 54.28% | 56.38% | 58.39% |
| Operating Expenses | |||||
| Sales and Marketing Expenses | |||||
| Sales and Marketing Payroll | $76,200 | $90,000 | $108,000 | $120,000 | $120,000 |
| Advertising/Promotion | $73,000 | $120,000 | $120,000 | $180,000 | $180,000 |
| Royalties | $578,090 | $2,489,175 | $3,913,511 | $5,469,662 | $7,167,365 |
| Other Sales and Marketing Expenses | $0 | $0 | $0 | $0 | $0 |
| Total Sales and Marketing Expenses | $727,290 | $2,699,175 | $4,141,511 | $5,769,662 | $7,467,365 |
| Sales and Marketing % | 3.32% | 5.42% | 5.29% | 5.27% | 5.21% |
| General and Administrative Expenses | |||||
| General and Administrative Payroll | $239,800 | $352,800 | $418,800 | $498,000 | $498,000 |
| Sales and Marketing and Other Expenses | $681,090 | $2,669,175 | $4,123,511 | $5,769,662 | $7,497,365 |
| Depreciation | $0 | $0 | $0 | $0 | $0 |
| Rent | $60,000 | $120,000 | $240,000 | $360,000 | $480,000 |
| Office Expenses | $12,000 | $24,000 | $36,000 | $48,000 | $60,000 |
| Accounting | $30,000 | $40,000 | $50,000 | $60,000 | $70,000 |
| Legal | $12,000 | $24,000 | $36,000 | $48,000 | $60,000 |
| Travel | $48,000 | $72,000 | $96,000 | $120,000 | $144,000 |
| Insurance (property & casualty) | $12,000 | $24,000 | $36,000 | $48,000 | $60,000 |
| Payroll Taxes & Benefits Payroll Burden | $388,680 | $544,644 | $647,964 | $760,140 | $760,140 |
| Other General and Administrative Expenses | $0 | $0 | $0 | $0 | $0 |
| Total General and Administrative Expenses | $1,483,570 | $3,870,619 | $5,684,275 | $7,711,802 | $9,629,505 |
| General and Administrative % | 6.78% | 7.77% | 7.26% | 7.05% | 6.72% |
| Other Expenses: | |||||
| Other Payroll | $0 | $0 | $0 | $0 | $0 |
| Consultants | $0 | $0 | $0 | $0 | $0 |
| Machine Maintenance | $30,000 | $60,000 | $90,000 | $120,000 | $150,000 |
| Miscellaneous Expenses | $120,000 | $250,000 | $350,000 | $500,000 | $500,000 |
| Total Other Expenses | $150,000 | $310,000 | $440,000 | $620,000 | $650,000 |
| Other % | 0.69% | 0.62% | 0.56% | 0.57% | 0.45% |
| Total Operating Expenses | $2,360,860 | $6,879,794 | $10,265,786 | $14,101,464 | $17,746,870 |
| Profit Before Interest and Taxes | $8,516,956 | $19,047,559 | $32,220,206 | $47,579,471 | $65,960,040 |
| EBITDA | $8,516,956 | $19,047,559 | $32,220,206 | $47,579,471 | $65,960,040 |
| Interest Expense | $0 | $0 | $0 | $0 | $0 |
| Taxes Incurred | $2,886,463 | $6,476,170 | $10,847,469 | $16,177,020 | $22,206,547 |
| Net Profit | $5,630,493 | $12,571,389 | $21,372,737 | $31,402,451 | $43,753,493 |
| Net Profit/Sales | 25.72% | 25.25% | 27.31% | 28.71% | 30.52% |
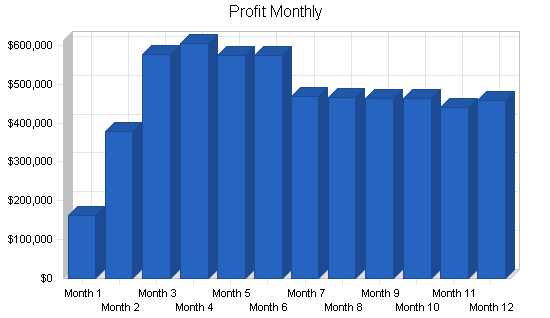
7.4 Projected Cash Flow
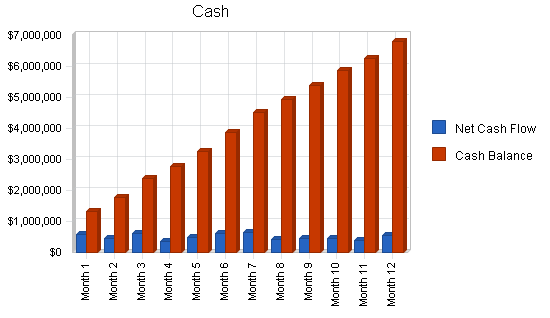
The table presents our projected cash flow balances. The critical first year reflects positive cash flow. Monthly cash flow is positive and more important the balances are positive, which indicates adequate financial reserves and correct planning of the required working capital. The estimated results permit a margin of error and still appear strong, even though the numbers remain conservative.
ATP intends to distribute dividends to its shareholders in a way that will enable the continuation of the expansion of the company according to this Business Plan. ATP estimates that from year two forward 50% of the profit (after tax) will be distributed to the shareholders. The Board of Directors will determine any other distributions to be made on an annual basis.
The following chart shows the cash availability for the next 12 months. The bar labeled “Cash Balance” shows our projected cash balance for the first 12 months of the project and it is adequate (above zero). The second set of bars, labeled “Net Cash Flow”, indicates the change in the Cash Balance for each month.
| Pro Forma Cash Flow | |||
| Year 1 | Year 2 | Year 3 | |
| Cash Received | |||
| Cash from Operations | |||
| Cash Sales | $21,887,712 | $49,783,507 | $78,270,222 |
| Cash from Receivables | $0 | $0 | $0 |
| Subtotal Cash from Operations | $21,887,712 | $49,783,507 | $78,270,222 |
| Additional Cash Received | |||
| Sales Tax, VAT, HST/GST Received | $0 | $0 | $0 |
| New Current Borrowing | $0 | $0 | $0 |
| New Other Liabilities (interest-free) | $0 | $0 | $0 |
| New Long-term Liabilities | $0 | $0 | $0 |
| Sales of Other Current Assets | $0 | $0 | $0 |
| Sales of Long-term Assets | $0 | $0 | $0 |
| New Investment Received | $0 | $0 | $0 |
| Subtotal Cash Received | $21,887,712 | $49,783,507 | $78,270,222 |
| Expenditures | Year 1 | Year 2 | Year 3 |
| Expenditures from Operations | |||
| Cash Spending | $1,490,464 | $2,954,352 | $4,294,128 |
| Bill Payments | $14,351,974 | $33,925,603 | $52,184,825 |
| Subtotal Spent on Operations | $15,842,438 | $36,879,955 | $56,478,953 |
| Additional Cash Spent | |||
| Sales Tax, VAT, HST/GST Paid Out | $0 | $0 | $0 |
| Principal Repayment of Current Borrowing | $0 | $0 | $0 |
| Other Liabilities Principal Repayment | $0 | $0 | $0 |
| Long-term Liabilities Principal Repayment | $0 | $0 | $0 |
| Purchase Other Current Assets | $0 | $0 | $0 |
| Purchase Long-term Assets | $0 | $0 | $0 |
| Dividends | $0 | $6,514,868 | $10,916,680 |
| Subtotal Cash Spent | $15,842,438 | $43,394,823 | $67,395,633 |
| Net Cash Flow | $6,045,274 | $6,388,684 | $10,874,589 |
| Cash Balance | $6,799,174 | $13,187,858 | $24,062,447 |
7.5 Projected Balance Sheet
The Projected annual financial balances are shown in the following table. The balances for the first 12 months are presented in the appendix.
| Pro Forma Balance Sheet | |||||
| Year 1 | Year 2 | Year 3 | Year 4 | Year 5 | |
| Assets | |||||
| Current Assets | |||||
| Cash | $6,799,174 | $13,187,858 | $24,062,447 | $39,743,579 | $61,596,477 |
| Accounts Receivable | $0 | $0 | $0 | $0 | $0 |
| Inventory | $997,477 | $2,164,698 | $3,247,047 | $4,538,189 | $5,946,776 |
| Other Current Assets | $0 | $0 | $0 | $0 | $0 |
| Total Current Assets | $7,796,650 | $15,352,557 | $27,309,494 | $44,281,768 | $67,543,253 |
| Long-term Assets | |||||
| Long-term Assets | $4,033,200 | $4,033,200 | $4,033,200 | $4,033,200 | $4,033,200 |
| Accumulated Depreciation | $0 | $0 | $0 | $0 | $0 |
| Total Long-term Assets | $4,033,200 | $4,033,200 | $4,033,200 | $4,033,200 | $4,033,200 |
| Total Assets | $11,829,850 | $19,385,757 | $31,342,694 | $48,314,968 | $71,576,453 |
| Liabilities and Capital | Year 1 | Year 2 | Year 3 | Year 4 | Year 5 |
| Current Liabilities | |||||
| Accounts Payable | $1,412,258 | $2,911,643 | $4,412,524 | $6,052,671 | $7,734,699 |
| Current Borrowing | $0 | $0 | $0 | $0 | $0 |
| Other Current Liabilities | $0 | $0 | $0 | $0 | $0 |
| Subtotal Current Liabilities | $1,412,258 | $2,911,643 | $4,412,524 | $6,052,671 | $7,734,699 |
| Long-term Liabilities | $0 | $0 | $0 | $0 | $0 |
| Total Liabilities | $1,412,258 | $2,911,643 | $4,412,524 | $6,052,671 | $7,734,699 |
| Paid-in Capital | $6,000,000 | $6,000,000 | $6,000,000 | $6,000,000 | $6,000,000 |
| Retained Earnings | ($1,212,900) | ($2,097,275) | ($442,566) | $4,859,846 | $14,088,260 |
| Earnings | $5,630,493 | $12,571,389 | $21,372,737 | $31,402,451 | $43,753,493 |
| Total Capital | $10,417,593 | $16,474,114 | $26,930,170 | $42,262,297 | $63,841,753 |
| Total Liabilities and Capital | $11,829,850 | $19,385,757 | $31,342,694 | $48,314,968 | $71,576,453 |
| Net Worth | $10,417,593 | $16,474,114 | $26,930,170 | $42,262,297 | $63,841,753 |
7.6 Business Ratios
Business ratios for the years of this plan are shown below. Industry profile ratios based on the Standard Industrial Classification (SIC) code 2448, Wood Pallets and Skids, are the closest available and are shown for comparison. ATP’s patented technologies are so new, that there is no SIC code that directly applies.
| Ratio Analysis | ||||||
| Year 1 | Year 2 | Year 3 | Year 4 | Year 5 | Industry Profile | |
| Sales Growth | 0.00% | 127.45% | 57.22% | 39.76% | 31.04% | -5.69% |
| Percent of Total Assets | ||||||
| Accounts Receivable | 0.00% | 0.00% | 0.00% | 0.00% | 0.00% | 25.59% |
| Inventory | 8.43% | 11.17% | 10.36% | 9.39% | 8.31% | 22.80% |
| Other Current Assets | 0.00% | 0.00% | 0.00% | 0.00% | 0.00% | 20.32% |
| Total Current Assets | 65.91% | 79.20% | 87.13% | 91.65% | 94.37% | 68.71% |
| Long-term Assets | 34.09% | 20.80% | 12.87% | 8.35% | 5.63% | 31.29% |
| Total Assets | 100.00% | 100.00% | 100.00% | 100.00% | 100.00% | 100.00% |
| Current Liabilities | 11.94% | 15.02% | 14.08% | 12.53% | 10.81% | 29.14% |
| Long-term Liabilities | 0.00% | 0.00% | 0.00% | 0.00% | 0.00% | 18.37% |
| Total Liabilities | 11.94% | 15.02% | 14.08% | 12.53% | 10.81% | 47.51% |
| Net Worth | 88.06% | 84.98% | 85.92% | 87.47% | 89.19% | 52.49% |
| Percent of Sales | ||||||
| Sales | 100.00% | 100.00% | 100.00% | 100.00% | 100.00% | 100.00% |
| Gross Margin | 49.70% | 52.08% | 54.28% | 56.38% | 58.39% | 24.90% |
| Selling, General & Administrative Expenses | 24.02% | 26.83% | 27.11% | 27.68% | 28.03% | 13.13% |
| Advertising Expenses | 0.33% | 0.24% | 0.15% | 0.16% | 0.13% | 0.37% |
| Profit Before Interest and Taxes | 38.91% | 38.26% | 41.17% | 43.49% | 46.01% | 3.19% |
| Main Ratios | ||||||
| Current | 5.52 | 5.27 | 6.19 | 7.32 | 8.73 | 2.13 |
| Quick | 4.81 | 4.53 | 5.45 | 6.57 | 7.96 | 1.23 |
| Total Debt to Total Assets | 11.94% | 15.02% | 14.08% | 12.53% | 10.81% | 7.55% |
| Pre-tax Return on Net Worth | 81.76% | 115.62% | 119.64% | 112.58% | 103.32% | 51.16% |
| Pre-tax Return on Assets | 72.00% | 98.26% | 102.80% | 98.48% | 92.15% | 15.47% |
| Additional Ratios | Year 1 | Year 2 | Year 3 | Year 4 | Year 5 | |
| Net Profit Margin | 25.72% | 25.25% | 27.31% | 28.71% | 30.52% | n.a |
| Return on Equity | 54.05% | 76.31% | 79.36% | 74.30% | 68.53% | n.a |
| Activity Ratios | ||||||
| Accounts Receivable Turnover | 0.00 | 0.00 | 0.00 | 0.00 | 0.00 | n.a |
| Collection Days | 0 | 0 | 0 | 0 | 0 | n.a |
| Inventory Turnover | 10.91 | 13.50 | 11.83 | 10.97 | 10.18 | n.a |
| Accounts Payable Turnover | 11.16 | 12.17 | 12.17 | 12.17 | 12.17 | n.a |
| Payment Days | 27 | 22 | 25 | 26 | 27 | n.a |
| Total Asset Turnover | 1.85 | 2.57 | 2.50 | 2.26 | 2.00 | n.a |
| Debt Ratios | ||||||
| Debt to Net Worth | 0.14 | 0.18 | 0.16 | 0.14 | 0.12 | n.a |
| Current Liab. to Liab. | 1.00 | 1.00 | 1.00 | 1.00 | 1.00 | n.a |
| Liquidity Ratios | ||||||
| Net Working Capital | $6,384,393 | $12,440,914 | $22,896,970 | $38,229,097 | $59,808,553 | n.a |
| Interest Coverage | 0.00 | 0.00 | 0.00 | 0.00 | 0.00 | n.a |
| Additional Ratios | ||||||
| Assets to Sales | 0.54 | 0.39 | 0.40 | 0.44 | 0.50 | n.a |
| Current Debt/Total Assets | 12% | 15% | 14% | 13% | 11% | n.a |
| Acid Test | 4.81 | 4.53 | 5.45 | 6.57 | 7.96 | n.a |
| Sales/Net Worth | 2.10 | 3.02 | 2.91 | 2.59 | 2.25 | n.a |
| Dividend Payout | 0.00 | 0.52 | 0.51 | 0.51 | 0.51 | n.a |
7.7 Long-term Plan
In addition to the enclosed financial information contained in this Business Plan, ATP would like to make the following observations that were not emphasized in this Business Plan:
The Business Plan covers five years of activities. We consider the financial projections in the Business Plan as conservative. As an example; since July 2002, (the date the patent was issued), ATP’s Vice President, Elie Banensohn has traveled to several European countries and has met with representatives of companies from the Far East. These companies recognize the value of RST-PAL pallets and have shown an interest in licensing the technology in order to manufacture and market the pallets in their countries (in some cases with our participation). The Business Plan does not include any income from licensing fees or royalties from foreign entities. Scrap tire problems exists everywhere and is even more acute in Europe and the Far East as they have less space for storage and less scrap tire processing technology than the U.S.
Revenues include some benefits from State or Federal level subsidies or grants for helping to clean up scrap tire problems, which are available. There are States that are offering participation in funding new companies using scrap tire rubber. ATP and its Board of Directors believe that demand for RST-PAL pallets may cause expansion plans to be reviewed and changed, assuming demand will be high. After initial exposure of RST-PAL pallets to the market, additional plants may need to be installed sooner than the company growth plan calls for.
As previously mentioned, a division or subsidiary of ATP will be proposed to manage the pallet leasing aspect of sales, which will afford pallet users the option to change over their entire inventories of wooden pallets to RST pallets on a “lease to purchase” plan. ATP anticipates substantial revenues and success in the pallet leasing market.
FAQ
1. Why did you choose Stamford, Texas as your first location?
- One of the largest piles of shredded scrap tires in Texas is located in Stamford. The quantities of raw material in this pile are enough for ten years of full production.
- The state of Texas pays for making final products from the scrapped tires about $30 per ton (approximately $0.75 per pallet).
- In the area of DFW (about a radius of 150 miles around) the yearly consumption of new pallets is about sixty million.
- The local municipality is very helpful. Rural America has unemployment problems. Therefore the local authorities have offered to subsidize the plant for our production lines, by enabling us to use a new existing building of 60,000 sq.ft. with all the facilities including: offices, rest rooms, electricity, air conditioning, boiler system etc. and the property is located on seven acres with the building which can be used for storing and loading pallets and employee parking, all offered with great terms and conditions.
- The location of this plant is less than one mile from the scrap tire pile.
2. If your plant is in Texas why is your headquarters is in Las Vegas?
As can be seen from our Business Plan, ATP expects to open four plants in the next five years. These plants will be in different states. Las Vegas was chosen as our corporate headquarters because of the following reasons:
- No state tax in Nevada;
- Las Vegas is the leader for conventions, trade shows and exhibitions where our products will be displayed and introduced to many industries and manufacturers;
- Las Vegas is also a popular tourist destination for business people throughout the world. Vegas has excellent airline connections, which offers a real opportunity to bring executives to visit and learn more about RST-PAL pallets and how it will positively affect their company profits.
3. Is there any financial help from the State administration in putting up the plant in their State?
There are several States, among them Louisiana and New Jersey that are giving up to 80% of the capital cost of putting up a plant that will utilize scrap tires. The problem of scrap tires is enormous and exists in most states. Most states have scrap tire programs to deal with the remediation of scrap tires.
4. Are there any federal laws regarding the use of recycled products?
Yes, all Federal Agencies, including the Department of Defense and Department of Transportation are mandated to use “recycled products first”. Our product is made from recycled materials and is very strong and durable and is acceptable for Government use due to its life cycle being much longer than a traditional wooden pallet, and the price of a RST-PAL pallets is very competitive.
5. How does the production of pallets made from scrap tires helps the ecology?
The RST-PAL pallet is an environmentally correct product made from recycled materials that can be recycled itself, making it a “triple green product”. First, according to statistics published by NWPCA (National Wooden Pallet and Container Association) the U.S. consumption of pallets is 800 million per year. To make this huge quantity of pallets, 3.5 million trees are cut every year. Every RST-PAL pallet sold will help to save our forests, allowing hardwoods to be used for more important and valuable uses other than pallets.
Second, getting rid of the scrap tire piles is a worldwide problem. This problem is even more acute in Europe and the Far East. Each year in the U.S. 250-280 million tires are added to the existing stockpiles of scrap tires. These piles are environmental hazards as they can become disastrous tire fires and are breeding grounds for mosquitoes (which bring diseases such as the West Nile Virus), rodents, snakes, and other vermin.
6. Are the projections in ATP’s Business Plan “Too good to be true”?
ATP believes that the projections, although they are very positive, are conservative. We also believe our biggest challenge will be keeping up with the production needed to meet the demand for our pallets. When a company evaluates the annual cost of their wooden pallets, including; purchase, repair, replacement, and discarding costs versus the one time purchase price of RST-PAL pallets, they will see tremendous savings in buying and using RST-PAL pallets.
Regarding the financial forecasts, ATP has purposely left out several positive issues. For example, the cost of recycled rubber (cut and prepared for our use) is $1.25/pallet. This cost can be reduced drastically by purchasing a special machine (Grizli) and cutting the tire shreds to our specific dimensions. The price of the machine can be recovered within one year of production. Additionally, the most expensive cost in making our pallets is the binder system, $6.50/pallet. Our projections do not take into consideration the savings of using even less binder per pallet which will be achieved by utilizing the new production line machinery, with a different delivery system. We estimate a minimum saving of 25% on our projected costs when we will buy the raw material and batch it ourselves.
Additional savings will be achieved by getting larger discounts as the volume of materials purchased increases.
Other potential revenue streams that are not projected include licensing ATP technology to foreign countries to manufacture and market RST-PAL pallets. In addition ATP anticipates opening a subsidiary company to provide pallet leasing or a lease to purchase program for our customers to enable them the opportunity to convert their wooden pallet inventory to RST-PAL pallets at an accelerated pace.
7. How are the scrap tires used today?
Only a small portion of scrap tires are recycled or used today. The main use (about 30%) is adding crumb rubber to asphalt for making roads. Other products that are made of scrap tires are: car floor mats, playground filler, floor tiles and some other soft products which do not need strength or rigidity of the final material. Scrap tire piles continue to accumulate all over the country and constitute dangerous environmental hazards.
8.What is the real market potential and what is the risk if the users do not accept the pallets?
As previously stated, of the 800 million pallets manufactured each year, about 60% are made from hardwood. Our product replaces the hardwood pallets, and if you look at our 5-year projection, we will produce approximately 19 million pallets while in the same 5 years the pallets industry will produce 2.4 billion hardwood pallets, which means we will capture, within 5 years, about 0.8% (less than 1%) of the total pallet market.
ATP surveyed the acceptance of RST-PAL pallets through pre-production marketing efforts and it was excellent. We visited 62 pallet users in the DFW area. All of the companies were impressed with the RST-PAL pallets made from this unique and patented “new material” from recycled scrap tires. Many stated that they would use the pallets once we had a production facility. They were especially impressed that our pallets were stronger and more durable than wooden pallets and would perform much longer than wooden pallets. NWPCA states, “wooden pallets last from 1.5 to 2 trips before having to be repaired or replaced.” We also visited with the buyer of pallets for 3M company in Minneapolis, and the buyer was very eager to use RST-PAL pallets. 3M purchases more than 7 million pallets in just one year. ATP also contacted, through the Department of Defense, the Army, Air Force PX and Exchange, AAFAS. They actually wanted us to deliver 50,000 pallets as an initial order but unfortunately we were not in production.
9.Can you show us orders from companies that were interested in using your pallet?
No. As we have not begun production, we cannot guarantee that ATP will be able to deliver pallets on a specific date, and so we have not accepted any orders. As the projected calculation shows tremendous savings to the user, and as RST-PAL pallets have so many advantages in comparison to wooden pallets and at a competitive price, ATP believes that when production commences, pallets will be immediately accepted. Some of the users we visited were surprised that the price was so low in relation to the performances of RST-PAL pallets.
10. What are the technical properties of the pallets and which tests have already done?
The technical data and the tests results are as follows:
- RST-PAL pallets are both rackable and stackable, and pass ISO standards.
- The RST-PAL pallets have the same parameters as hardwood pallets, including two or four way entry, and meet GMA pallet standards.
- Weight: 40″x48″, four way GMA pallet, hardwood=65 lbs; RST-PAL=71 lbs.
The difference in weight disappears after the wood starts absorbing water/liquids. - The deflection of a pallet with our material, according to ISO when R=1500KG, is about zero (actually equal to the deflection of metal under the same load).
- A test was conducted with 3 concrete beams weighing 25 tons (51,000 lbs), which were loaded and lifted onto an RST-PAL pallet. In comparison, wooden pallets have a static weight load of 2,500 pounds.
In conclusion, this is not a high precision, high tech product — it is a strong and durable pallet with excellent material qualities and is offered to pallet users at a very competitive price, which will save pallet buyers bottom line profits.
11. Usually, as production increases, the price normally decreases (mainly because of competition). In your B.P. the price is increased. Please explain?
Actually, part of the answer is in the question. There is no competition. Hardwood is a commodity and its price changes constantly with lumber prices (which continue to increase annually). Our increase in price takes this fact into account. The raise in prices, as appears in our projections, of 25% during the next five years is probably less than the increase in the cost of hardwood. Another reason is that our initial price is very low, designed so that ATP can penetrate different markets rapidly.
Most key pallet purchasers that we talk with, think we are vastly under priced for a pallet that is so durable and lasts so long. Some believe RST-PAL pallets should be in the $39.00-$59.00 price range (similar to plastic pallets), and not just a few dollars more than hardwood pallets. ATP assumes that for many years (due to patent protection) RST-PAL pallets will not have competitors, which can often drive the price down. The assumption is that the advantages of RST-PAL pallets over hardwood pallets will cause pallet users to purchase RST-PAL pallets to lower their pallet costs. Following RST-PAL pallets becoming established in the market place, the advantages and the savings will be widely recognized and there will be justification for further price increases.
The opening price of $18.50 is an average price and not applicable to all sizes nor to all customers. Certainly, a customer purchasing 500,000 pallets per year will be given a discount different from a customer purchasing 1,000 pallets.
The Board of Directors will re-visit the $18.50 price as sales develop. Our projected low price is intended to introduce the pallet to many different manufacturers and industries that use pallets, targeting those companies with a closed loop system that can use, retrieve and use over and over again the same durable pallets.
12. Everything seems so good, what is the down side to this project?
ATP believes that according to the projections, the only downside is our start-up production capacity. ATP knows that it will capture the small percentage of less than 1% of the total market demand. The projection shows that this 1% of the market will enable both growth from profits to fund expansion and a good return in the form of dividends for its investors.
RST-PAL pallets are heavier, by about 8 lbs, than the equivalent size pallet made of hardwood. This is true only at the beginning of the lifecycle of a wooden pallet as wood absorbs water and other liquids and can become even heavier than RST-PAL pallets. An average 40′ truck trailer carries about 22 loaded pallets, and by using RST-PAL pallets the total added weight is less than 200 lbs, which is not significant.
13. Is your patent defendable and what does it actually protect?
The patent was approved and issued in July 2002. It took about five years to perfect and to reach the utmost protection possible. It protects any product made from recycled scrap tire rubber using a plurality of sizes with or without other materials like plastic, adhesives etc.
14. Who has the exclusivity to utilize this patent?
The total and irrevocable exclusivity was granted to ATP Corporation, which consists of the new investors and the existing partners. This exclusivity includes licensing to other parties worldwide for the manufacturing and marketing of RST-PAL pallets.
15. It appears that you are looking for investment of $4M to $6M. Elaborate.
These two numbers express the difference between starting with one line of production vs. two lines. The basic set of machines needed for production can be extended to two lines with addition of some machines. By starting with two lines, the production capacity is doubled to 1.2M pallets per year with net profit projected of over $8M versus $3.2M if ATP opens with a single line.
16. How will the investor’s capital be used?
A detailed start-up expenses and funding table can be found in Topic 2.2. The main expense item is for machinery and in both cases about $750,000 remains as working capital.
17. What equity percentage are you offering for the investment?
The calculation of the present value of the company based on the projections appears in the business plan. The present value of five years of net earnings at 25% discount is over $100 million. We deliberately took an unreasonably high discount rate to avoid any disputes.
We value our company at “present value” of just over $17M. Hence, for the $6 million investment; we offer 35% of the company with all its rights.
18. Is there any other way of financing the project?
Yes. We would accept a loan, secured by the assets and rights of ATP, which will carry interest of 5% for a period of ten years starting (the repayment) at the beginning of the second year. The return can be accelerated.
In addition to the secured note, the lender will be offered 17.5% equity interest for a loan of $6 million.
19. Who is ATP’s management team?
See Chapter 6.0 of the Business Plan. Each member of the team along with our consultants, are highly qualified professionals with vast and proven experience in their fields (e.g. plant installation and operations, purchasing and marketing). ATP is also open to investor participation both in the company and on the Board of Directors.
Disclaimer
The financial projections that appear in this Business Plan are estimated revenues, expenses, and cash flow, which are based on research and the assumptions discussed throughout this Business Plan. They represent the best of management’s knowledge and belief and also are based on actual operations in the pilot plant in Stamford, Texas. The Company’s expected revenues, expenses, and cash flow for the projected periods are subject to the Company’s ability to develop sales and production levels at the price and costs estimated by management. Accordingly, these projections reflect management’s estimates as of January-June 2003, and its expected course of action if such sales and production levels are attained at the price and costs anticipated.
These projected financial statements are for the purpose of providing updated information to existing and new investors. These projected financial statements should not be considered to be a presentation to forecast future results. Accordingly, these projections may not be useful for other purposes.
The assumptions disclosed herein are those that management believes are significant to the projections. Furthermore, even if the sales and production levels as well as the projected price and costs are attained, there will usually be differences between projected and actual results because events and circumstances frequently do not occur as expected, and those differences may be material.


