
Harquebus Paintball, Inc.
Executive Summary
“Paintball games” is the next big thing in the sporting industry. As the #1 sport for growth, paintball is up more than 84% to 9.4 million U.S. players within the past five years according to the National Sporting Goods Association. Harquebus Paintball, Inc. (HPI) will start out as a small retail paintball company based in Bombarde County, Ourstate. HPI’s location is the prime location as it contains only two other poor retail paintball shops creating very little competition.
HPI will specialize in the sale of a wide variety of quality paintball equipment such as guns, parts/accessories, magazines, apparel, and more, as well as hosting local tournaments and providing quality services such as repairs and upgrades of products, bringing first year’s sales to a total of $1,920,385 achieving profitability from month one. All employees will be experienced in the broad spectrum of paintball to fulfill the customers needs. HPI will have an extreme advantage over the little competition that does exist, as it will have an online store, very competitive pricing, carry a much greater selection, host sales and promotions, gift cards, and membership benefits.
Harquebus Paintball’s current opportunity to enter the unique paintball market is perfect, as the market is rather new, expanding rapidly, is one of a kind, and is not yet capitalized with dominant nationwide competition from other chain stores that would otherwise make it nearly impossible to enter the retail paintball market.
Future Plans and Expectations: HPI’s main future goal will be to expand greatly through physical storefronts, unique high-quality paintball fields, as well as e-commerce transactions, and to dominate the retail paintball market, first throughout Ourstate, and from there…the entire nation via franchising. Harquebus Paintball will become the “Best Buy” of the retail paintball industry.
Keys to Success: HPI realizes that in order to be successful, certain factors, or “keys to success,” must be followed through, and followed through well, such as hosting sales and promotions, having a good product selection to choose from, servicing products sold, a well defined knowledge of the industry, store location, reputation, and advertising.
Ownership and Management: HPI is a corporation owned by its CEO Padraich Petard, COO Geoffrey Gunnar, and CFO Petra Pistolero, who will be responsible for the day-to-day operations of HPI such as inventory upkeep, accounting, financials, sales and promos, etc. Other lead management includes Dolores Derringer, who will handle HPI’s advertising, and Claude Carabinerie, who will lead HPI’s service department.
Requirements: HPI will require start-up funds for the purchase of start-up assets and expenses such as corporate identity/forms, remodeling, rent, office/store equipment, inventory, cash reserve, advertising, and misc. expenses/assets.
Products: HPI will sell a wide variety of quality paintball products such as guns/markers, paintballs, upgrades/accessories, apparel, magazines, paintballs, and hoppers via its physical and online store. Services will include repairs/upgrades of equipment, which will be provided in the physical store only.
Market: HPI’s market audience will be males, ages 12-24 that actively (actively = plays at least once a month) play paintball in Bombarde County, Ourstate. Through market research, HPI found that approximately 3.9% of Bombarde County males ages 12-24 actively play paintball, which comes to approx. 2,144 players. According to the NSGA (National Sporting Goods Association), paintball has grown an average of 16.8% per year over the last five years, thus HPI feels that paintball is not a fad, and will continue to take a strong, steady growth throughout the nation. HPI’s marketing strategy is to hit hard and fast, dominating its local market from the start, and blowing away the competition through local advertising, grand opening giveaways, sales, and contests.
Industry: HPI is in the industry of retail paintball, which includes physical paintball dealers, online paintball dealers, or both (HPI). Dealers have certain pros and cons about being a physical or online dealer, such cons for a physical dealer being a low concentration of products and poor pricing competition. HPI will take the cons of physical/online paintball dealers and turn them into pros, in which Harquebus Paintball will become a dominant paintball retailer. In the industry of retail paintball, there are a number of factors influencing purchases such as product features, product reputation, word of mouth, availability, pricing, up-sales, cross-sales, and impulse buys. HPI will utilize all of these factors to create a larger sales and profit margin.
Advantages: HPI will have many advantages over the competition such as hosting sales and promotions, gift cards, membership discount cards, product servicing, online store, larger product selection, an attractive clean store, team sponsorship, and tournament hostings. Having these advantages will give Harquebus Paintball a much stronger chance of gaining customers.
Sales Strategy: HPI will gain/maintain customers through its sales strategy, which will include sales, promos, gift cards, membership cards, and product selection, all of which the local competition does not do. HPI projects explosive first year’s sales, and a corresponding net profit.
Web Plans: HPI will have an online home at HarquebusPaintball.com, where potential customers can view and purchase in-store products all from home. Customers will also have the option to buy online and pick up their merchandise from the store, which will eliminate their shipping charges and waiting period on their products. HarquebusPaintball.com will host community paintball news, and have an employee login so that employees may check online for certain duties they may have, and their work schedule. Advertisement for HarquebusPaintball.com will be through in-store banners, TV and radio, web banners, and search engines.
Break even: HPI has estimated what must be sold monthly to break even with all its expenses and liabilities. HPI does not expect any trouble with meeting this obligation as long as the “keys to success,” and certain goals and objectives listed throughout this plan are achieved. Current expenses and liabilities are rent, utilities, insurance, payroll taxes, advertising, and depreciation.
The purpose of this plan is to provide in-depth detail on how HPI will achieve everything stated above, from its marketing plans to its projected revenues all the way to its web plans.

1.1 Mission
Harquebus Paintball will strive to provide its customers with 100% satisfaction through promotions and sales, a wide range of quality products, great services, and in the future, beautiful tournament-like fields, with its friendly staff that is highly knowledgeable in the field of paintball.
HPI will be aggressive towards its customers’ needs and demands. Our research department will constantly be providing the store with updated inventory, current trends, improving on areas our competition has already advanced on, and providing what the competition does not.
1.2 Objectives
Harquebus Paintball has two sets of objectives, “short-term” which will be the main focus for the first three years of operation, and “long-term” which will mainly be ideas for the next four years, or until the short-term objectives have been met. Once the short-term objectives have been met, the long-term “ideas” will become HPI’s new primary objectives.
Short-term:
- Become the premier paintball retailer in Bombarde County, selling and servicing at least 50% of paintballers in the area.
- Host the best promotions, sales, selection, tournaments, servicing (repairs/upgrades) of any paintball store in Bombarde County.
- Sell product/service the first year at a rapid-fire rate, sufficient to meet HPI’s approximate break-even revenue.
- Increase sales 10% each fiscal year.
- Open a unique, quality, paintball field as well as another HPI retail store in southern Bombarde County where there are currently no fields or stores.
Long-term:

- Open three more Harquebus Paintball retail stores and fields, one in northern Bombarde County, one in Howitzer County, and one in Cannonade County.
- Franchise Harquebus Paintball retail stores through all of Ourstate, and from there, the entire U.S.
1.3 Keys to Success
Harquebus Paintball’s success will be determined by the following seven factors:
- Sales and Promotions: HPI will host weekly and monthly sale and promotion opportunities to bring in customers and beat out the competition. There will also be a “grand opening” sale to attract first-time, and potentially loyal customers.
- Selection: HPI will carry a wide array of products from major-name expensive brands to generic-name inexpensive brands. HPI will have an 80% larger selection than its current competition.
- Service: HPI will offer all types of popular service in a timely fashion such as: gun repairing; gun upgrading; and advice.
- Knowledge: HPI’s staff will have a well-rounded knowledge in all aspects of paintball. Servicemen and gun-tech’s will be highly experienced in their field of repairing and upgrading any type of product. All staff members must be ready and able to answer any type of retail paintball question, as well as giving wise advice.
- Location: HPI’s location will be in a “high-traffic” area within a three mile radius of OPC (Ourstate Paintball Center) and Musketeer Paintball fields, the two most popular paintball fields out of three that are in Bombarde County.
- Reputation: HPI must obtain credibility, integrity, and a good name for itself by completing and using all of the five factors above.
- Advertising: HPI will advertise via radio and TV each quarter to keep the HPI name alive and to bring in new customers.
Company Summary
Harquebus Paintball is a brand new retail paintball store that will be located in Enfilade Plaza. HPI will sell a wide array of new paintball equipment to paintballers in Bombarde County, from expensive brand-name products to inexpensive generic-label items, as well as providing services such as gun repairs, upgrades, and advice.
2.1 Start-up Summary
Harquebus Paintball’s total start-up requirements are shown in the following list, table, and chart.
- Incorporation Fees (Expense)
- Corporate Identity/Forms (Expense)
- Remodeling (Expense)
- Rent (Expense)
- Office/Store Equipment (Asset)
- Inventory (Asset)
- Cash Reserve (Asset)
- Advertising (Expense)
- Website (Expense)
- Misc. (Expense)

| Start-up | |
| Requirements | |
| Start-up Expenses | |
| Incorporation | $384 |
| Stationery etc. | $300 |
| Rent (First three months) | $8,152 |
| Remodeling | $45,000 |
| Advertising | $40,000 |
| Website | $600 |
| Other | $900 |
| Total Start-up Expenses | $95,336 |
| Start-up Assets | |
| Cash Required | $27,564 |
| Start-up Inventory | $80,000 |
| Other Current Assets | $12,100 |
| Long-term Assets | $5,000 |
| Total Assets | $124,664 |
| Total Requirements | $220,000 |
2.2 Company Ownership
Harquebus Paintball is filed as an S-Corporation in the state of Delaware, with its headquarters located in Bombarde County, Ourstate. Company Ownership of HPI is listed below:
- President/CEO: Padraich Petard
Padraich has always had a deep passion for the resale of products, and is constantly looking for better ways to attract customers and increase potential purchases. He is an avid business man/entrepreneur who is willing to risk everything in hopes of building a grand business, and has the skills, brains, and willpower to guide a company to success. Padraich has two years experience in the retail industry working for one of Ourstate’s largest and most successful supermarkets, as well as experience in starting/running his own retail operation. He also has three years experience in paintball product knowledge. - Vice President/COO: Geoffrey Gunnar
Geoffrey has over three years experience in the paintball industry as an extreme paintball player. He is an excellent researcher, constantly looking for new products and upgrades to enhance his playing experience, and is always “two steps ahead of the game.” His knowledge in which products and services sell well is very extensive, knowing which products will be “the next best thing” in paintball, as he is constantly up-to-date with competition stores, online paintball forums, and large online retailing stores. - Vice President/CFO: Petra Pistolero
Petra is a whiz at financing. He has mastered all of his advanced math courses, achieving a high understanding and comprehension in the world of numbers. His management with money is superb, demonstrated by his ability to decipher between wants and needs, as well as being able to save. Petra’s dream is to start his own company to make him successful in life, and is willing to do whatever it takes to get him there. He has also experienced the game of paintball, as he used to play, and has a very well defined knowledge of the sport. - Vice President/Marketing Director: Dolores Derringer
Dolores has over 17 years experience in the marketing industry. She already has her own advertising agency, DD Media, Inc., which was founded in 2001. A few existing accounts are SPark Energy, Centreville Electric Company, and Nowcare Hospitals. Her previous experience is with Smoke and Mirrors Agency, Ourstate Lottery, Hoover Vacuum Cleaners and Bigbucks Bank. Her specialty is strategic media planning and buying for multi-million dollar accounts. She also has an associate degree in retail merchandising. - Assistant Store Manager/Service Manager: Claude Carabinerie
Claude has over 11 years experience in the paintball industry. He is able to repair anything in paintball that will allow, and knows everything there is to know about paintball. Claude also has over three years experience working in a local paintball shop.
All employees are wonderful outgoing “people people” that are very hard working, creative, and work extremely well with others, constantly providing new ideas and concepts with a positive attitude to make the best out of whatever situation they get into.
Products and Services
Harquebus Paintball will provide the products it sells through its physical and online retail stores, and services will be provided through the physical retail store only.
In-Store Products:
The items for sale will be strategically placed throughout the store as “departments” in unique, high-tech looking glass cases or behind the counters as “display items.” If/when a customer likes the display item and decides to purchase it, he/she will take an “item ticket” (a UPC tag created for that item to be rung-up) to the checkout center to complete the purchase of the product(s), and a staff member will get the item(s) from the back (inventory) room and bring it to the valued customer. HPI believes that this will reduce shrink/theft, especially since a main portion of the audience will be children.
Online Products:
Items for sale in HPI’s online store will also be classified under “departments.” If/when a customer chooses to purchase an item he/she likes, they will add the product to their online shopping cart and “checkout.” The staff members working in the physical store location will check online orders every night, and fulfill those orders to be shipped out the next day.
In-Store Services:
- Gun Repairs: If a customer should need a repair on his/her gun, a gun-tech staff member will evaluate the situation (if the gun needs to be tweaked, or a new part needs to be provided). If the gun can be fixed without a new component, it will be repaired accordingly and a nominal fee will be assessed. However, if the gun does need a new component, a parts and labor fee will be charged.
- Gun Upgrades: If a customer should buy a part for their gun and require assistance in integrating that component, then a nominal fee shall be imposed on that service.
- Advice: All advice will be given free of charge.
Market Analysis Summary
Paintball is a rapidly growing market. It is a fairly new sport, started in the early 1980s, and took major growth throughout the 1990s. The National Sporting Goods Association ( NSGA [http://www.nsga.org] ) reported that “paintball games” were the #1 sport for growth in 2002, up 24% to 6.9 million players (player = played more than once), up 6.8% in 2003 to 7.4 million players, and up 28% in 2004 as the #2 sport for growth to 9.4 million players .
Harquebus Paintball’s main market focus includes Bombarde County males, ages 12-24. Bombarde County demographics below:
- 5-24: 191,276
- males (45% estimate): 86,074
- 12-24: 120,804
- males (45% estimate): 54,360
- total males that participate in paintball in Bombarde County (3.9% estimate) : 2,144
Due to the age bracket (5-24) from the Bombarde County demographics, and Paintball’s (in general) age demographics (12-24), HPI has broken down the figure 86,074, which represents all males ages 5-24 that live in Bombarde County, and figured that there are approx. 4,530 males in each age bracket (ie: age 5, age 6, age 7, etc.). From there, HPI took 4,530 and multiplied it by the number of years in the general Paintball demos (12 years) which computes to 54,360 Bombarde County males between the ages of 12 and 24.
A simple paintball market study was conducted at various Bombarde County middle and high schools, and an approximate average for the number of males who play paintball and own a gun are 67 males per school. The estimation “67 males per school” was conceived by taking the average population of each school (2,000 students), and dividing it by the average classroom population (30 students), and during the study it was found that an average of one male per classroom owns a paintball gun and plays paintball persistently (at least once a month). There are approximately 32 middle/high schools in Bombarde County, which means there are about 2,144 paintball players in the Bombarde County area.
By taking the 9.4 million paintball players, dividing it by 50 (which represents the 50 States) and dividing that number by 66 (which represent the 66 counties in Ourstate), then you have an average of 2,848 paintballers per Ourstate county.
Major companies such as Nike, Adidas, and Vans are starting to enter the paintball market. Fox Sports and the Outdoor Network are also starting to bring paintball into their business as they host various paintball tournaments for viewing pleasure. There are currently only two paintball businesses in Bombarde County trying to win/gain/maintain customers of the same audience.
Consider these numbers reported by the NSGA and you will find, despite paintball’s popularity and age, that it is not far behind:
- Soccer: 13.3 million players.
- Baseball: 15.9 million players.
- Tackle Football: 8.2 million players.
4.1 Market Segmentation
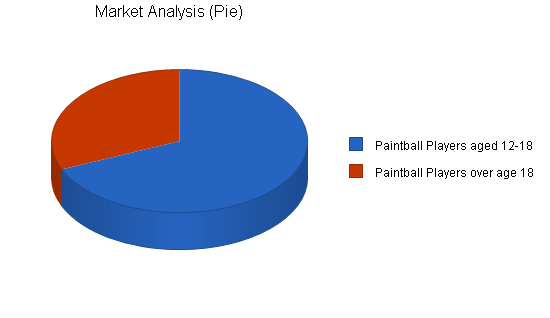
Harquebus Paintball’s target market will be Bombarde County males from the ages of 12-24. Based on the Bombarde County demographics (estimated 45% male) and HPI’s derived demographics as stated above (3.9% male paintballers), HPI’s products and services will be offered to an estimate of 2,144 Bombarde County paintballers.
The following table and chart depict the potential customers (HPI considers “potential” customers, people that enjoy/play the sport of paintball) with a conservative annual growth rate of 3%. The growth rate of paintball in general was 6% in 2000, 4% in 2001, 24% in 2002, 6.8% in 2003, and 28% in 2004.
| Market Analysis | |||||||
| Year 1 | Year 2 | Year 3 | Year 4 | Year 5 | |||
| Potential Customers | Growth | CAGR | |||||
| Paintball Players aged 12-18 | 3% | 2,144 | 2,208 | 2,274 | 2,342 | 2,412 | 2.99% |
| Paintball Players over age 18 | 3% | 986 | 1,016 | 1,046 | 1,077 | 1,109 | 2.98% |
| Total | 2.99% | 3,130 | 3,224 | 3,320 | 3,419 | 3,521 | 2.99% |
4.2 Target Market Segment Strategy
Harquebus Paintball chose the target audience of Bombarde County male paintballers, ages 12-24 because our products and services will be offered mainly to Bombarde County, and the paintball demographics are males between the ages of 12 and 24. HPI will create a public awareness message via radio, TV, and live remotes for approximately three weeks prior to grand opening to let HPI’s audience know about the opening of HPI.
4.3 Service Business Analysis
Harquebus Paintball is in the industry of retail paintball products. There are two kinds of paintball retail businesses: Physical Paintball Dealers and Online Paintball Dealers:
- Physical Paintball Dealers: These are the storefront paintball retailers.
- Pros:
- Offers repair and upgrade services.
- No wait for shipping.
- No shipping and handling charges.
- Can view products in person.
- Queries can be answered immediately.
- Cons:
- Usually offers a low concentration of brand-name product at MSRP value.
- Extremely limited advertising.
- Very little sales or promotions, if any.
- Online Paintball Dealers: These are the Internet based paintball retailers.
- Pros:
- Usually offering a higher concentration (more color variety, different sizes) of brand-name and generic-label product at slightly lower than MSRP value.
- Basic sales (ie: $10 off) and promotions (ie: bonus packs).
- Cons:
- Shipping time.
- Shipping and handling charges.
- Little advertising.
- Do not offer repair or upgrade services.
- Cannot view products in person.
- Queries may take up to a week to be answered.
The size and concentration of paintball retail centers in Bombarde County is extremely limited. There are currently only two small paintball retail centers in Bombarde County providing an extremely narrow range of products and brands. Harquebus Paintball’s goal is to turn the “cons” of the “Physical Paintball Dealers” into “pros.”
4.3.1 Competition and Buying Patterns
In the industry of retail paintball, there are a number of factors influencing purchases:
- Product Features: Some items may be “better” than others due to the fact that it may contain a feature (ie: on/off switch) that will make that item easier to use, more functional, versatile, etc.
- Reputation: Some items may carry a reputation of being excellent (ie: strong, durable, long-lasting, easy to fix, etc.) products, and others may carry a reputation of being “poor” (ie: breaks often, cheap, malleable, etc.)
- Word of Mouth: Often times purchases are made simply on the basis of a word-of-mouth recommendations.
- Availability: Kids want their products immediatly, rather than waiting maybe a week or two for a reorder of an out-of-stock item, another product of its fashion may be purchased instead.
- Pricing: Depending on income, especially for kids, a cheaper price may be the determining factor between two items if that’s all that person can afford at the time.
- Up-sales: If someone decides to purchase a product at X amount of dollars, and a staff member points out that the “better” model has more features for only a few dollars more, that person may decide to go with the more expensive unit.
- Cross-sales: If someone decides to purchase a product that has room for upgrades, a staff member may recommend purchasing a few upgrades to enhance the power of their item.
- Impulse Buys: People, especially kids, often tend to purchase items that they think they need, maybe because of certain features, looks, or to even look “cool” in front of all the other paintballers, rather than researching the item and realizing whether they truly need it or not.
In Bombarde County, there is very little retail paintball competition. There are currently only two stores running a retail paintball operation, OPC (Ourstate Paintball Center) and Musketeer Paintball (ratings: 0-5; 5 = best):
- OPC: OPC has a shop approximately 1,000s/f – 1,500s/f. It includes product selection, and a service area.
- Store Condition: 2 (non decorative; a sense of dirtiness; worn down equipment; etc.).
- Product Selection: 3 (mainly a light selection of a couple major brand companies).
- Marketing: 0 (no known advertising; no sales; no promotions).
- Sales Staff/Experience: 3/5 (not exactly aggressive in sales, yet can give helpful advice / very knowledgeable in the field of paintball)
- Musketeer: Musketeer has a shop around 800s/f – 1,000s/f. It includes product selection and a service area.
- Store Condition: 3
- Product Selection: 2
- Marketing: 1 (rotating billboard advertisement)
- Sales Staff/Experience: 3/4
Staff at OPC will be trained in customer assistance, and willingly transferred to Harquebus Paintball upon opening.
Strategy and Implementation Summary
HPI’s strategy and implementation are summarized in the following “to-do” list below:
- Funding: Acquire the necessary funding to “start-up” the business.
- Remodeling: Create an attractive store and fill with product.
- Marketing: Attract potential customers to the store and create a public awareness.
- Customer Loyalty Programs: Use strategies such as sales/promotions/membership discounts as a way to keep customers satisfied and coming back.
- Growth: Follow certain goals/objectives listed throughout the plan to obtain a strong, steady growth and profit.
HPI’s main objective for growth is to attract customers in Bombarde County by giving premier service, selection, sales, promotions, and prices.
5.1 Competitive Edge
The advantages Harquebus Paintball has over the competition are numerous:
- Sales/Promotions/Gift Cards/Membership Cards: HPI will host many sales/promos, unlike the competition, as well as offering gift cards and membership programs, which the competition does not participate in, and will increase customer savings and satisfaction to drive customers to the store.
- Internet: HPI will have a professional online website and eventually an online store that will provide products and community news.
- Service: HPI’s knowledge and service in the broad field of paintball will be extensive and satisfying. This will drive customer repair requests to the store, as well as pointing its customers in the right purchasing direction.
- Selection: HPI will offer a greater selection with better prices than the competition will hold.
- Attractiveness: HPI’s store will be clean, tidy, “hi-tech”, and advanced compared to OPC and Musketeer Paintball.
- Sponsorship: HPI will put together a team of tournament expert paintball players and sponsor them with HPI gear (jerseys; pants; etc.)and paintball equipment (guns; paint; etc.).
- Tournament Hostings: HPI will host several tournaments throughout the year, spreading the name of HPI even further, as well as generating additional income.
5.2 Marketing Strategy
Harquebus Paintball’s marketing strategy is to hit hard and fast, and will include the following, from three weeks before grand opening to approximately one week after grand opening:
- Local Advertising:
- TV and Radio: HPI will advertise heavily three weeks before grand opening on television and radio stations (100 Targeted Rating Points, males 12-24) that focus on younger crowds to create a large public awareness.
- Live Remote: HPI will host a live remote with a radio station on grand opening day to attract potential customers to the store and to further create public awareness.
- Giveaways: HPI will give away t-shirts for the first week of grand opening with the HPI logo embroidered on it for further advertising.
- Sales: HPI will host a grand opening day sale to attract potential customers, such as 15% off all store merchandise.
- Contests: HPI will also host a drawing on grand opening day for all customers who purchase something. Giveaway will include an item such as a “tricked out” gun valued at $1,500 or so.
These four strategies will be used to create public awareness of Harquebus Paintball’s grand opening, to drive customers to the store for the first time, to spread the word on how wonderful HPI is, and to keep the paintballers coming back, over and over again.
5.3 Sales Strategy
Harquebus Paintball’s survival will be riding on its wonderful savings and promotional opportunities, as well as its large product selection. Harquebus Paintball will gain/maintain customers through the following sales strategies*:
- Sales: HPI will host weekly and monthly sales.
- General sales ($15 off this; 10% off that; etc.).
- The old buy one get one… (buy X amount of this, get X amount free; buy X amount of this, get X amount 1/2 price; etc.).
- The old two for one… (buy X amount for the price of X amount; etc.).
- Promotions: HPI will host weekly and monthly promotions.
- Field paint store credit (buy a case of paint at HPI, bring in original receipt and field paint charge receipt and receive a store credit in the amount of the field paint charge).
- Purchase and contest (purchase anything and automatically be entered to win X; etc.).
- Purchase and installation (purchase any upgrade and receive free installation; etc.).
- Gift Cards: HPI will allow for the use of gift cards (presents; HPI “debit” cards; etc).
- Membership Cards: HPI will offer membership cards for even further savings in the future for repeat customers.
- Spend X amount in HPI and receive X amount store credit.
- Product Selection: HPI will carry a wide range of gear/equipment from low priced to high priced product, generic to brand name product, color variety, and popular to unique products.
By offering a large product selection and these savings and promotional opportunities, HPI will be the premier retail paintball center throughout Bombarde County, if not the entire state .
* all sales strategies (sales and promotional activities) will be tailored to maintain a healthy profit margin.
5.3.1 Sales Forecast
HPI estimated a profit margin for each category (guns; hoppers; paintballs; etc), and an applied an estimated growth rate to the sales and the direct costs of sales. As you can see by the table and charts on the following pages, HPI estimates that total sales for the first year of business will be excellent, with the comfortable profit margin, but only a modest growth rate. HPI derived these estimates in the following manner:
- Finding The Averages (Sales Projection):
- HPI created an average price for each subcategory within the main category. (ie: Gun Sales – Gun Price Range: Low/Mid/High. Apparel – masks; jerseys; pants; gloves; shoes; etc.)
- Heavily researched the “best selling” products for each category from other competition stores to get a general idea of which sub-categoric products will sell the most in each main category, and created realistic sales models for those products (ie: Gun Sales – Gun Price Range: Low/Mid/High. Frequency: Mid sold the greatest, followed by high, and then the lows).
- Averaged out the sub-categoric prices with the frequency at which they were being sold at to find the average price of each main category.
- Paintball Evolution Theory, “PET Theory” (The Driving Force):
- HPI created a simple theory (based upon a paintball sales market study) to reduce, define, and fine-tune the basic dynamics of each individual paintball player’s yearly purchases.
- The PET Theory states that each player will purchase one new item from each of the main categories listed in the “Sales Forecast” below at least once a year (due to depreciation of goods, new technology, and skill level of player), and at least one box of paintballs will be purchased once per month.
- Market Audience (Market Analysis):
- HPI estimates that out of the total 2,142 active paintball players in Bombarde County, an average of 50% (1,072 players) will purchase their goods from Harquebus Paintball. This estimate was found by splitting the geographical Bombarde County region into three sections: Top/Mid/Bottom. The top section (Northern Bombarde County) labeled as 25% of the paintball players in Bombarde County, the mid section (Mid Bombarde County) labeled as 50% of the paintball players in Bombarde County, and the bottom section (Southern Bombarde County) labeled at 25% of the paintball players in Bombarde County. HPI, as well as OPC and Musketeer fields, are all located in the “mid” section.
- Compilation (Conclusion):
- Due to the “PET” Theory, if each paintball player purchases one new item from each main category once a year in the “Sales Forecast,” then taking the average item cost for the main category and multiplying it by the 50% target audience, 1,072 players, and dividing that figure by 12, HPI found the monthly average revenue for each category, with the exception of paintballs.*
- Main Category’s Average Price x 1,072 players = Category’s Annual Revenue.
HPI feels that the Paintball Evolution Theory is reasonable and reliable from the fact that nearly every paintballer switches out equipment/gear at least once a year due to the technological advances in product, the rapid depreciation of paintball equipment/gear, skill level advances in players, etc.
HPI believes that paintball games will continue to grow over the next several years, and may increase HPI’s overall growth rate. With the offering of a large product selection, sales, and promotions, HPI will sustain a continuously growing customer database which will allow the following sales projections to be realistic and true.
Limiting factors such as rain should not have a deep impact on day-to-day sales due to the fact that Musketeer’s paintball field is indoors. Other limiting factors, such as economic recession, may hurt HPI’s monthly sales due to the fact that paintball, like many other things, are items of want and not need (such as groceries).
* It is stated in the PET Theory that one case of paintballs will be purchased once a month: 1,072 players x 12 months x average paint price = Annual Paintball Revenue.

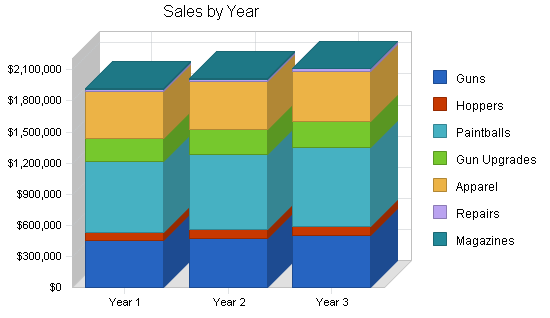
| Sales Forecast | |||
| Year 1 | Year 2 | Year 3 | |
| Sales | |||
| Guns | $453,184 | $475,843 | $499,635 |
| Hoppers | $79,304 | $83,269 | $87,432 |
| Paintballs | $679,782 | $720,569 | $763,803 |
| Gun Upgrades | $226,598 | $240,194 | $254,606 |
| Apparel | $453,184 | $466,779 | $480,783 |
| Repairs | $22,664 | $23,797 | $24,987 |
| Magazines | $5,669 | $5,726 | $5,783 |
| Total Sales | $1,920,385 | $2,016,177 | $2,117,029 |
| Direct Cost of Sales | Year 1 | Year 2 | Year 3 |
| Guns | $339,888 | $343,287 | $346,720 |
| Hoppers | $59,481 | $60,076 | $60,677 |
| Paintballs | $509,837 | $514,935 | $520,084 |
| Gun Upgrades | $169,946 | $171,645 | $173,361 |
| Apparel | $339,891 | $343,290 | $346,723 |
| Repairs | $9,395 | $9,489 | $9,584 |
| Magazines | $4,249 | $4,291 | $4,334 |
| Subtotal Direct Cost of Sales | $1,432,685 | $1,447,012 | $1,461,482 |
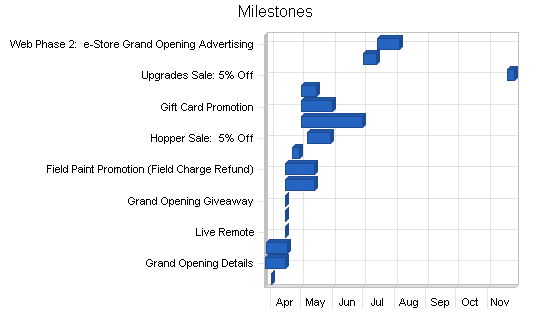
5.4 Milestones
The following table represents important goals or “milestones” with their starting/ending dates, budget, manager in-charge, and the department for Harquebus Paintball. The table is sorted in ascending order by “start date.”
The first milestone will be the “soft” opening of the store. This will be the first day of opening. The next five milestones are for public awareness and to drive customers to the grand opening of the store. The Membership Promotion is for building a customer database and acquiring customer loyalty. The next three milestones are setup to further promote HPI’s wonderful savings opportunities with major sales.
More sales and promotions will be added at a later date, and current milestones can also be shifted to different dates if needed.
| Milestones | |||||
| Milestone | Start Date | End Date | Budget | Manager | Department |
| Soft Opening | 4/1/2005 | 4/1/2005 | $0 | Padraich | Store |
| Grand Opening Details | 3/26/2005 | 4/15/2005 | $0 | Padraich | Web |
| TV and Radio Advertising | 3/27/2005 | 4/17/2005 | $40,000 | Dolores | Marketing |
| Live Remote | 4/15/2005 | 4/15/2005 | $5,000 | Dolores | Marketing |
| Grand Opening Sale | 4/15/2005 | 4/15/2005 | $0 | Geoffrey | Inventory |
| Grand Opening Giveaway | 4/15/2005 | 4/15/2005 | $2,000 | Geoffrey | Inventory |
| Membership Promotion | 4/15/2005 | 5/13/2005 | $0 | Padraich | Store |
| Field Paint Promotion (Field Charge Refund) | 4/15/2005 | 5/13/2005 | $0 | Geoffrey | Inventory |
| Apparel Sale: 7% Off | 4/22/2005 | 4/29/2005 | $0 | Geoffrey | Inventory |
| Hopper Sale: 5% Off | 5/29/2005 | 5/6/2005 | $0 | Geoffrey | Inventory |
| Web Phase 2: e-Store Sector Creation | 5/1/2005 | 6/30/2005 | $3,500 | Padraich | Web |
| Gift Card Promotion | 5/1/2005 | 5/31/2005 | $0 | Padraich | Store |
| Gun Sale: 5% Off | 5/1/2005 | 5/15/2005 | $0 | Geoffrey | Inventory |
| Upgrades Sale: 5% Off | 11/20/2005 | 11/27/2005 | $0 | Geoffrey | Inventory |
| Web Phase 2: e-Store Testing / Soft Opening | 7/1/2005 | 7/14/2005 | $0 | Padraich | Web |
| Web Phase 2: e-Store Grand Opening Advertising | 7/15/2005 | 8/5/2005 | $10,000 | Dolores | Marketing |
| Totals | $60,500 | ||||
Web Plan Summary
Harquebus Paintball’s website will be the perfect online companion for the physical store, as well as its online “home.” The HPI website will be an easy-to-navigate, secure, sleek, hi-tech, professional looking website with lots of user friendly features. The HPI website will go through three phases:
- Phase One: (short-term)
- Advertising: HarquebusPaintball.com will be “live” online approximately three weeks before grand opening. During HPI’s marketing phase, HPI’s Web address will be mentioned in the various radio and TV spots so people can visit the website and get more information on Harquebus Paintball.
- Info Center: HarquebusPaintball.com will be a primary host for news and updates on HPI for approximately three weeks before grand opening to two months after grand opening. Information will include such dates as to grand opening, certain milestones, and special events that may occur in the paintball community.
- Phase Two: (short-term)
- Info Center: HarquebusPaintball.com will continue to host information and updates on HPI’s milestones and the paintball community’s special events.
- e-Store: HarquebusPaintball.com will evolve into an online store three months after grand opening, using the physical store’s inventory and hosting many features such as: online accounts; online purchasing and shipment; online purchasing and in-store pickup; product availability; etc. HPI’s online store will be targeted mainly for the Bombarde County area’s use as a time/place/satisfaction utility, but will fulfill out-of-state purchases, as the sales grow.
- Phase Three: (long-term)
- e-Store Expansion: HarquebusPaintball.com will focus on online sales growth, targeting the entire nation. HPI will create a website department, with inventory strictly for online purchases, larger and more technical programs will be implemented into the website’s design, and online marketing/advertising will be carried out.
6.1 Website Marketing Strategy
Harquebus Paintball’s website marketing strategy will be synchronized with the three Web plan phases:
- Phase 1: (short-term [target audience: Bombarde County kids and young adults])
- TV and Radio: HarquebusPaintball.com will be stressed for customers to visit during the launch campaign on various radio and TV stations during the “TV and radio” advertising phase of HPI’s marketing plan, approximately three weeks prior to grand opening. This will give interested potential customers a chance to find out more information on HPI that may be included online rather than in the TV and radio advertisements.
- Live Remote: HarquebusPaintball.com will be announced periodically throughout the radio stations’ (undecided) live remote to attract more potential customers to the website.
- Phase 2: (short-term [target audience: Bombarde County kids and young adults])
- Radio: The new HarquebusPaintball.com e-store will be advertised for approximately 2-3 weeks on various radio stations that attract kids and young adults.
- In-Store: Banners and signs will be strategically placed throughout the physical store sending out the message that HPI now has a full online store with many great user-friendly features.
- Contests: Customers can create an online account with HPI, and upon registration, they will automatically be entered for a chance to win a giveaway prize. This will allow HPI to to build an online customer database, and offer monthly e-news letters to the online members.
- Phase 3: (long-term [target audience: The United States])
- Search Engines: HarquebusPaintball.com will be listed under every major search engine such as: www.Google.com; www.MSN.com; www.Yahoo.com; www.AskJeeves.com; etc.
- Online Malls: HarquebusPaintball.com will list products under major online product compilation sites and malls such as: www.PriceGrabber.com; www.MySimon.com; etc.
- Website Banners: HarquebusPaintball.com will create attractive banners with a link to the HPI website, and host the banners on high “paintball traffic” websites such as: www.Paintball.com; etc.
6.2 Development Requirements
HarquebusPaintball.com will require the following during the short-term phases:
- Phase One:
- Web Domain HarquebusPaintball.com
- Web Hosting provider (Jumpline.com)
- Phase Two:
- Web Domain HarquebusPaintball.com
- Web Hosting provider (Jumpline.com)
- Merchant Account (to hold online profits)
- VeriSign Services:
- SSL Certificate (Secure Purchasing)
- Credit Card Processing (Payment Methods)
- Buyer Protection (Stolen Credit Card Protection)
- Anti-Fraud Service (Fake/Unauthorized Credit Transactions)
- Macromedia Dreamweaver MX w/business license (Site Layout Development)
- Adobe Photoshop CS w/business license (Site Image Development)
- Shopping Cart Program (Online “shopping cart” and Checkout Service)
- UPS Business Account (Shipping)
- Packaging Materials (Cartons; Boxes; Bubble Wrap; etc.)
Harquebus Paintball’s website will be designed by Padraich Petard. The website will be maintained by Kham Pholowyr and Padraich Petard daily. “Phase two” website features will include in-store pickup, user accounts, product availability, employee schedules, etc.
Management Summary
Harquebus Paintball will have a management team of four members. Each member of the HPI team will fulfill their specific job requirements and by working hard and together, HPI will achieve all of its goals. The HPI employee department setup will be as follows: Store, Inventory, and Service. Each department will have one manager in charge, and the possibility of employees. HPI’s department setup below:
- Store Department: (overall store operations)
- Manager (Store Manager): Padraich Petard, President/CE
- Weekly Hours: 40+.
- Assures that all other departments are working hard and consistently.
- Handles any job necessary to fulfill the operations of HPI, with the exception of gun repairs/upgrades.
- Grants consent or vetoes ideas and inventory orders.
- Customer Assistance. (cashiering; product help; etc)
- Teams with the inventory and service departments to create new sales/promotions to boost financials.
- Generates employee hours.
- Generates payroll.
- Handles financial duties (Accounting).
- Promotes store cleanliness. (store cleaning)
- Assistant Manager (Financial Manager): Petra Pistolero, Vice President/CFO
- Weekly Hours: 40+.
- Helps handle financial duties.
- Helps generate payroll.
- Helps generate employee hours.
- Teams with inventory and service departments to create new sales/promotions to boost financials.
- Customer Assistance.
- Promotes store cleanliness.
- Inventory Department: (inventory management)
- Manager (Inventory Manager): Geoffrey Gunnar, Vice President/COO
- Weekly Hours: 40+.
- Manages product selection.
- Researches new product selection.
- Generates monthly inventory sales reports.
- Creates inventory reorder tickets.
- Teams with Store Management to create new inventory sales/promotions.
- Customer Assistance.
- Promotes store cleanliness.
- Service Department: (services and repairs)
- Manager (Service Manager): Claude Carabinerie
- Hourly Wage: $9.00.
- Weekly Hours: 30-35.
- Gun-tech: novice/intermediate/advanced gun repairs and upgrades.
- Teams with Store Management to create new repair/upgrade sales/promotions.
- Provides knowledgeable advice.
- Customer Assistance.
- Promotes store cleanliness.
- Service Employee(s) (Front Service Clerk):
- Hourly Wage: $7.50.
- Weekly Hours: 25.
- Gun-tech: novice/intermediate gun upgrades.
- Provides knowledgeable advice.
- Customer Assistance.
- Collect products at checkout time.
- Promotes store cleanliness.
HPI was founded by the Store and Inventory managers, Padraich Petard, Geoffrey Gunnar, and Petra Pistolero.
7.1 Personnel Plan
As you can see in the personnel table below, HPI is estimated to have seven employees at start-up: four managers, and three service clerks. Wages for service clerks were calculated by taking the weekly hours, dispersing equal amount of daily hours over a full week, multiplied by the number of days in each month, and multiplied again by hourly wage. The wage for the “Service Manager” was calculated in the manner described above, and subtracted by the average number of hours spent on gun repairs, which was an average of 20 per week, multiplied by the hourly wage. This expense is shown in the “Sales Forecast” table labeled as the “Direct Cost of Sales” for the repairs category.
Please note that the wages below are total dollars earned per month, without the appropriate taxes taken out. Taxes are estimated and labeled as an expense in the profit/loss table within this plan.
| Personnel Plan | |||
| Year 1 | Year 2 | Year 3 | |
| Store Manager | $20,400 | $20,000 | $20,000 |
| Asst. Store Manager | $20,400 | $20,000 | $20,000 |
| Inventory Manager | $20,400 | $20,000 | $20,000 |
| Service Manager | $10,404 | $12,000 | $12,000 |
| Front Svc. Clerk | $9,772 | $10,424 | $11,075 |
| Front Svc. Clerk | $9,772 | $10,424 | $11,075 |
| Front Svc. Clerk | $9,772 | $10,424 | $11,075 |
| Total People | 7 | 7 | 7 |
| Total Payroll | $100,920 | $103,272 | $105,225 |
Financial Plan
Harquebus Paintball’s start-up funding will include an investment made in the company by the owners, and a long-term SBA or commercial bank loan. HPI will achieve profitability in its first year of operations, and will sustain a slow, steady profit margin and a rapidly growing cash account with solid growth from the end of the first year’s operations to the end of the third year’s operations. HPI will continue this amazing growth via sales, promotions, product selection, the launching of new stores, distributor discounting, company franchising, etc.
The financials are projected out three years, but are based on the original store only. If actual results for each year play out at equal to or greater than projections, the available cash on hand will be used as seed capital for HPI’s expansion.
8.1 Important Assumptions
Harquebus Paintball has taken assumptions about the following:
- The sport of paintball will undertake a slow and steady economic growth throughout the next several years.
- A “worse case” scenario, HPI assumes a modest average profit margin on all products.
- All avid Bombarde County paintball players will purchase new gear/equipment at least once a year.
- Our target market only includes current Bombarde County paintballers, not all males ages 12-24 who may have an interest in paintball.
All estimates and assumptions will be adjusted once HPI has been finalized and established.
| General Assumptions | |||
| Year 1 | Year 2 | Year 3 | |
| Plan Month | 1 | 2 | 3 |
| Current Interest Rate | 10.00% | 10.00% | 10.00% |
| Long-term Interest Rate | 6.00% | 6.00% | 6.00% |
| Tax Rate | 30.00% | 30.00% | 30.00% |
| Other | 0 | 0 | 0 |
8.2 Start-up Funding
Padraich Petard, Geoffrey Gunnar and Petra Pistolero will each invest in Harquebus Paintball, Inc. Dolores Derringer and Claude Carabinerie will also each invest, but a lesser amount.
Harquebus Paintball will welcome additional investment form outside parties.
HPI will seek a long-term SBA loan through local Bigbucks Bank, which specializes in serving Bombarde County commerce.
| Start-up Funding | |
| Start-up Expenses to Fund | $95,336 |
| Start-up Assets to Fund | $124,664 |
| Total Funding Required | $220,000 |
| Assets | |
| Non-cash Assets from Start-up | $97,100 |
| Cash Requirements from Start-up | $27,564 |
| Additional Cash Raised | $0 |
| Cash Balance on Starting Date | $27,564 |
| Total Assets | $124,664 |
| Liabilities and Capital | |
| Liabilities | |
| Current Borrowing | $0 |
| Long-term Liabilities | $140,000 |
| Accounts Payable (Outstanding Bills) | $0 |
| Other Current Liabilities (interest-free) | $0 |
| Total Liabilities | $140,000 |
| Capital | |
| Planned Investment | |
| Petard | $20,000 |
| Gunnar | $20,000 |
| Pistolero | $20,000 |
| Derringer | $10,000 |
| Carabinerie | $10,000 |
| Additional Investment Requirement | $0 |
| Total Planned Investment | $80,000 |
| Loss at Start-up (Start-up Expenses) | ($95,336) |
| Total Capital | ($15,336) |
| Total Capital and Liabilities | $124,664 |
| Total Funding | $220,000 |
8.3 Break-even Analysis
As shown in the table below, Harquebus Paintball estimates the number of units of $1 which must be sold (under the forecasted profit margin attributed to each item), to generate sufficient revenue monthly to break-even with its estimated monthly fixed costs (utilities, payroll, depreciation, etc.).

| Break-even Analysis | |
| Monthly Revenue Break-even | $74,192 |
| Assumptions: | |
| Average Percent Variable Cost | 75% |
| Estimated Monthly Fixed Cost | $18,842 |
8.4 Projected Profit and Loss
Shown in the following table and charts are projected profits and gross margins for the first year of operations.
Profits and losses are summed up below:
- Rent: Rent in Enfilade Plaza has three property leasing charges: base rent charge ($12 s/f per annum), NNN charges ($4.45 s/f per annum); 4% s/f management fee based on the base rent charge. The property at Enfilade is 1,800 s/f. After all the math, the monthly costs are: $1,800.00(base fee) + 667.50(NNN fee) + $72.00(management fee) = $2,539.50 + 7% sales tax = $2,717.27 Total Monthly Rent.
- Utilities: Utilities for HPI will consist of electric ($150), water ($25), telephone ($90), Internet ($90), fax ($30), etc., for a total monthly cost of approx. $400.
- Insurance: A $50,000 125% inventory insurance policy will cost $94/month.
- Payroll Taxes: Payroll taxes will average about 20% of total dollars earned.


| Pro Forma Profit and Loss | |||
| Year 1 | Year 2 | Year 3 | |
| Sales | $1,920,385 | $2,016,177 | $2,117,029 |
| Direct Cost of Sales | $1,432,685 | $1,447,012 | $1,461,482 |
| Other Costs of Goods | $0 | $0 | $0 |
| Total Cost of Sales | $1,432,685 | $1,447,012 | $1,461,482 |
| Gross Margin | $487,699 | $569,165 | $655,547 |
| Gross Margin % | 25.40% | 28.23% | 30.97% |
| Expenses | |||
| Payroll | $100,920 | $103,272 | $105,225 |
| Sales and Marketing and Other Expenses | $78,000 | $78,000 | $78,000 |
| Depreciation | $600 | $600 | $600 |
| Rent | $32,607 | $32,607 | $32,607 |
| Utilities | $4,800 | $4,800 | $4,800 |
| Insurance | $1,128 | $1,128 | $1,128 |
| Payroll Taxes | $6,845 | $7,286 | $7,732 |
| Website | $1,200 | $1,500 | $1,500 |
| Other | $0 | $0 | $0 |
| Total Operating Expenses | $226,100 | $229,192 | $231,592 |
| Profit Before Interest and Taxes | $261,599 | $339,973 | $423,955 |
| EBITDA | $262,199 | $340,573 | $424,555 |
| Interest Expense | $7,658 | $6,126 | $4,500 |
| Taxes Incurred | $76,183 | $100,154 | $125,836 |
| Net Profit | $177,759 | $233,693 | $293,618 |
| Net Profit/Sales | 9.26% | 11.59% | 13.87% |
8.5 Projected Cash Flow
Harquebus Paintball demonstrates its projected cash flow in the table and chart shown on the following pages.
- Cash Flow: HPI estimates mass inventory purchases every other month, therefore creating a “wave” effect in HPI’s cash flow from positive flow to negative flow during inventory months, yet sustaining an overall positive cash balance. As HPI will continue to grow throughout the years, negative cash flow will slowly decrease as positive cash flow slowly increases. As shown in the table on the following page, Net Cash Flow is derived by the “Cash Spent (inventory; payroll, rent, etc.)” and subtracted from the “Operations Cash (cash gained from sales),” therefore showing how much money is flowing into or out of HPI’s checking accounts. By the end of first year’s operations, HPI will have sustained an overall positive cash flow.
- Cash Balance: As shown in the chart on the following page, HPI’s “Cash Balance (cash in checking account)” will remain positive, and sustain a continuous positive growth rate. Cash balance is derived by taking the current month’s “Net Cash Flow” and adding it to the previous month’s “Cash Balance.” Cash “on hand” by the end of first year’s operations is estimated to increase nearly 10-fold over the beginning cash balance.

| Pro Forma Cash Flow | |||
| Year 1 | Year 2 | Year 3 | |
| Cash Received | |||
| Cash from Operations | |||
| Cash Sales | $1,920,385 | $2,016,177 | $2,117,029 |
| Subtotal Cash from Operations | $1,920,385 | $2,016,177 | $2,117,029 |
| Additional Cash Received | |||
| Sales Tax, VAT, HST/GST Received | $134,427 | $141,132 | $148,192 |
| New Current Borrowing | $0 | $0 | $0 |
| New Other Liabilities (interest-free) | $0 | $0 | $0 |
| New Long-term Liabilities | $0 | $0 | $0 |
| Sales of Other Current Assets | $0 | $0 | $0 |
| Sales of Long-term Assets | $0 | $0 | $0 |
| New Investment Received | $0 | $0 | $0 |
| Subtotal Cash Received | $2,054,812 | $2,157,310 | $2,265,221 |
| Expenditures | Year 1 | Year 2 | Year 3 |
| Expenditures from Operations | |||
| Cash Spending | $100,920 | $103,272 | $105,225 |
| Bill Payments | $1,559,101 | $1,682,525 | $1,715,781 |
| Subtotal Spent on Operations | $1,660,021 | $1,785,797 | $1,821,006 |
| Additional Cash Spent | |||
| Sales Tax, VAT, HST/GST Paid Out | $134,427 | $141,132 | $148,192 |
| Principal Repayment of Current Borrowing | $0 | $0 | $0 |
| Other Liabilities Principal Repayment | $0 | $0 | $0 |
| Long-term Liabilities Principal Repayment | $24,750 | $26,300 | $27,900 |
| Purchase Other Current Assets | $0 | $0 | $0 |
| Purchase Long-term Assets | $0 | $0 | $0 |
| Dividends | $0 | $0 | $0 |
| Subtotal Cash Spent | $1,819,198 | $1,953,229 | $1,997,098 |
| Net Cash Flow | $235,614 | $204,080 | $268,123 |
| Cash Balance | $263,178 | $467,258 | $735,381 |
8.6 Projected Balance Sheet
The balance sheet below represents Harquebus Paintball’s overall cash position through the years 2006-2008, only including the original store, as well as Internet sales. As shown in the table below, HPI’s “Net Worth” is projected to increase approximately exponentially from month one to the end of 2008. Harquebus Paintball does not project any trouble meeting its debt obligations as long as the specific goals and objectives mentioned earlier in this plan are achieved.
| Pro Forma Balance Sheet | |||
| Year 1 | Year 2 | Year 3 | |
| Assets | |||
| Current Assets | |||
| Cash | $263,178 | $467,258 | $735,381 |
| Inventory | $138,604 | $139,990 | $141,390 |
| Other Current Assets | $12,100 | $12,100 | $12,100 |
| Total Current Assets | $413,882 | $619,348 | $888,871 |
| Long-term Assets | |||
| Long-term Assets | $5,000 | $5,000 | $5,000 |
| Accumulated Depreciation | $600 | $1,200 | $1,800 |
| Total Long-term Assets | $4,400 | $3,800 | $3,200 |
| Total Assets | $418,282 | $623,148 | $892,071 |
| Liabilities and Capital | Year 1 | Year 2 | Year 3 |
| Current Liabilities | |||
| Accounts Payable | $140,609 | $138,082 | $141,286 |
| Current Borrowing | $0 | $0 | $0 |
| Other Current Liabilities | $0 | $0 | $0 |
| Subtotal Current Liabilities | $140,609 | $138,082 | $141,286 |
| Long-term Liabilities | $115,250 | $88,950 | $61,050 |
| Total Liabilities | $255,859 | $227,032 | $202,336 |
| Paid-in Capital | $80,000 | $80,000 | $80,000 |
| Retained Earnings | ($95,336) | $82,423 | $316,116 |
| Earnings | $177,759 | $233,693 | $293,618 |
| Total Capital | $162,423 | $396,116 | $689,734 |
| Total Liabilities and Capital | $418,282 | $623,148 | $892,071 |
| Net Worth | $162,423 | $396,116 | $689,734 |
8.7 Business Ratios
Harquebus Paintball’s projected business ratios are provided in the table below. HPI chose the Standard Industry Classification (SIC) code: Sporting goods and bicycle shops – 5941 as the closest match to its industry.
| Ratio Analysis | ||||
| Year 1 | Year 2 | Year 3 | Industry Profile | |
| Sales Growth | 0.00% | 4.99% | 5.00% | -1.56% |
| Percent of Total Assets | ||||
| Inventory | 33.14% | 22.46% | 15.85% | 37.25% |
| Other Current Assets | 2.89% | 1.94% | 1.36% | 28.41% |
| Total Current Assets | 98.95% | 99.39% | 99.64% | 77.97% |
| Long-term Assets | 1.05% | 0.61% | 0.36% | 22.03% |
| Total Assets | 100.00% | 100.00% | 100.00% | 100.00% |
| Current Liabilities | 33.62% | 22.16% | 15.84% | 33.29% |
| Long-term Liabilities | 27.55% | 14.27% | 6.84% | 16.07% |
| Total Liabilities | 61.17% | 36.43% | 22.68% | 49.36% |
| Net Worth | 38.83% | 63.57% | 77.32% | 50.64% |
| Percent of Sales | ||||
| Sales | 100.00% | 100.00% | 100.00% | 100.00% |
| Gross Margin | 25.40% | 28.23% | 30.97% | 32.06% |
| Selling, General & Administrative Expenses | 8.24% | 7.98% | 7.72% | 16.24% |
| Advertising Expenses | 0.00% | 0.00% | 0.00% | 1.62% |
| Profit Before Interest and Taxes | 13.62% | 16.86% | 20.03% | 1.22% |
| Main Ratios | ||||
| Current | 2.94 | 4.49 | 6.29 | 2.01 |
| Quick | 1.96 | 3.47 | 5.29 | 0.79 |
| Total Debt to Total Assets | 61.17% | 36.43% | 22.68% | 56.78% |
| Pre-tax Return on Net Worth | 156.35% | 84.28% | 60.81% | 2.79% |
| Pre-tax Return on Assets | 60.71% | 53.57% | 47.02% | 6.45% |
| Additional Ratios | Year 1 | Year 2 | Year 3 | |
| Net Profit Margin | 9.26% | 11.59% | 13.87% | n.a |
| Return on Equity | 109.44% | 59.00% | 42.57% | n.a |
| Activity Ratios | ||||
| Inventory Turnover | 10.91 | 10.39 | 10.39 | n.a |
| Accounts Payable Turnover | 12.09 | 12.17 | 12.17 | n.a |
| Payment Days | 27 | 30 | 30 | n.a |
| Total Asset Turnover | 4.59 | 3.24 | 2.37 | n.a |
| Debt Ratios | ||||
| Debt to Net Worth | 1.58 | 0.57 | 0.29 | n.a |
| Current Liab. to Liab. | 0.55 | 0.61 | 0.70 | n.a |
| Liquidity Ratios | ||||
| Net Working Capital | $273,273 | $481,266 | $747,584 | n.a |
| Interest Coverage | 34.16 | 55.50 | 94.21 | n.a |
| Additional Ratios | ||||
| Assets to Sales | 0.22 | 0.31 | 0.42 | n.a |
| Current Debt/Total Assets | 34% | 22% | 16% | n.a |
| Acid Test | 1.96 | 3.47 | 5.29 | n.a |
| Sales/Net Worth | 11.82 | 5.09 | 3.07 | n.a |
| Dividend Payout | 0.00 | 0.00 | 0.00 | n.a |
Appendix
| Sales Forecast | |||||||||||||
| Month 1 | Month 2 | Month 3 | Month 4 | Month 5 | Month 6 | Month 7 | Month 8 | Month 9 | Month 10 | Month 11 | Month 12 | ||
| Sales | |||||||||||||
| Guns | 1% | $35,733 | $36,090 | $36,451 | $36,816 | $37,184 | $37,556 | $37,931 | $38,311 | $38,694 | $39,081 | $39,471 | $39,866 |
| Hoppers | 1% | $6,253 | $6,316 | $6,379 | $6,442 | $6,507 | $6,572 | $6,638 | $6,704 | $6,771 | $6,839 | $6,907 | $6,976 |
| Paintballs | 1% | $53,600 | $54,136 | $54,677 | $55,224 | $55,776 | $56,334 | $56,897 | $57,466 | $58,041 | $58,622 | $59,208 | $59,800 |
| Gun Upgrades | 1% | $17,867 | $18,046 | $18,226 | $18,408 | $18,592 | $18,778 | $18,966 | $19,156 | $19,347 | $19,541 | $19,736 | $19,934 |
| Apparel | 1% | $35,733 | $36,090 | $36,451 | $36,816 | $37,184 | $37,556 | $37,931 | $38,311 | $38,694 | $39,081 | $39,471 | $39,866 |
| Repairs | 1% | $1,787 | $1,805 | $1,823 | $1,841 | $1,860 | $1,878 | $1,897 | $1,916 | $1,935 | $1,954 | $1,974 | $1,994 |
| Magazines | 1% | $447 | $451 | $456 | $461 | $465 | $470 | $474 | $479 | $484 | $489 | $494 | $499 |
| Total Sales | $151,420 | $152,934 | $154,464 | $156,008 | $157,568 | $159,144 | $160,735 | $162,343 | $163,966 | $165,606 | $167,262 | $168,935 | |
| Direct Cost of Sales | Month 1 | Month 2 | Month 3 | Month 4 | Month 5 | Month 6 | Month 7 | Month 8 | Month 9 | Month 10 | Month 11 | Month 12 | |
| Guns | 1% | $26,800 | $27,068 | $27,338 | $27,612 | $27,888 | $28,167 | $28,448 | $28,733 | $29,020 | $29,310 | $29,604 | $29,900 |
| Hoppers | 1% | $4,690 | $4,737 | $4,784 | $4,832 | $4,880 | $4,929 | $4,979 | $5,028 | $5,079 | $5,129 | $5,181 | $5,232 |
| Paintballs | 1% | $40,200 | $40,602 | $41,008 | $41,418 | $41,832 | $42,251 | $42,673 | $43,100 | $43,531 | $43,966 | $44,406 | $44,850 |
| Gun Upgrades | 1% | $13,400 | $13,534 | $13,669 | $13,806 | $13,944 | $14,084 | $14,224 | $14,367 | $14,510 | $14,655 | $14,802 | $14,950 |
| Apparel | 1% | $26,800 | $27,068 | $27,339 | $27,612 | $27,888 | $28,167 | $28,449 | $28,733 | $29,021 | $29,311 | $29,604 | $29,900 |
| Repairs | 1% | $772 | $798 | $772 | $798 | $798 | $772 | $798 | $772 | $798 | $798 | $721 | $798 |
| Magazines | 1% | $335 | $338 | $342 | $345 | $349 | $352 | $356 | $359 | $363 | $366 | $370 | $374 |
| Subtotal Direct Cost of Sales | $112,997 | $114,145 | $115,252 | $116,423 | $117,580 | $118,721 | $119,927 | $121,092 | $122,321 | $123,537 | $124,687 | $126,004 | |
| Personnel Plan | |||||||||||||
| Month 1 | Month 2 | Month 3 | Month 4 | Month 5 | Month 6 | Month 7 | Month 8 | Month 9 | Month 10 | Month 11 | Month 12 | ||
| Store Manager | 0% | $1,700 | $1,700 | $1,700 | $1,700 | $1,700 | $1,700 | $1,700 | $1,700 | $1,700 | $1,700 | $1,700 | $1,700 |
| Asst. Store Manager | 0% | $1,700 | $1,700 | $1,700 | $1,700 | $1,700 | $1,700 | $1,700 | $1,700 | $1,700 | $1,700 | $1,700 | $1,700 |
| Inventory Manager | 0% | $1,700 | $1,700 | $1,700 | $1,700 | $1,700 | $1,700 | $1,700 | $1,700 | $1,700 | $1,700 | $1,700 | $1,700 |
| Service Manager | 0% | $867 | $867 | $867 | $867 | $867 | $867 | $867 | $867 | $867 | $867 | $867 | $867 |
| Front Svc. Clerk | 0% | $803 | $830 | $803 | $830 | $830 | $803 | $830 | $803 | $830 | $830 | $750 | $830 |
| Front Svc. Clerk | 0% | $803 | $830 | $803 | $830 | $830 | $803 | $830 | $803 | $830 | $830 | $750 | $830 |
| Front Svc. Clerk | 0% | $803 | $830 | $803 | $830 | $830 | $803 | $830 | $803 | $830 | $830 | $750 | $830 |
| Total People | 7 | 7 | 7 | 7 | 7 | 7 | 7 | 7 | 7 | 7 | 7 | 7 | |
| Total Payroll | $8,376 | $8,457 | $8,376 | $8,457 | $8,457 | $8,376 | $8,457 | $8,376 | $8,457 | $8,457 | $8,217 | $8,457 | |
| General Assumptions | |||||||||||||
| Month 1 | Month 2 | Month 3 | Month 4 | Month 5 | Month 6 | Month 7 | Month 8 | Month 9 | Month 10 | Month 11 | Month 12 | ||
| Plan Month | 1 | 2 | 3 | 4 | 5 | 6 | 7 | 8 | 9 | 10 | 11 | 12 | |
| Current Interest Rate | Current Interest Rate | 10.00% | 10.00% | 10.00% | 10.00% | 10.00% | 10.00% | 10.00% | 10.00% | 10.00% | 10.00% | 10.00% | 10.00% |
| Long-term Interest Rate | Long-term Interest Rate | 6.00% | 6.00% | 6.00% | 6.00% | 6.00% | 6.00% | 6.00% | 6.00% | 6.00% | 6.00% | 6.00% | 6.00% |
| Tax Rate | Tax Rate | 30.00% | 30.00% | 30.00% | 30.00% | 30.00% | 30.00% | 30.00% | 30.00% | 30.00% | 30.00% | 30.00% | 30.00% |
| Other | 0 | 0 | 0 | 0 | 0 | 0 | 0 | 0 | 0 | 0 | 0 | 0 | |
| Pro Forma Profit and Loss | |||||||||||||
| Month 1 | Month 2 | Month 3 | Month 4 | Month 5 | Month 6 | Month 7 | Month 8 | Month 9 | Month 10 | Month 11 | Month 12 | ||
| Sales | $151,420 | $152,934 | $154,464 | $156,008 | $157,568 | $159,144 | $160,735 | $162,343 | $163,966 | $165,606 | $167,262 | $168,935 | |
| Direct Cost of Sales | $112,997 | $114,145 | $115,252 | $116,423 | $117,580 | $118,721 | $119,927 | $121,092 | $122,321 | $123,537 | $124,687 | $126,004 | |
| Other Costs of Goods | $0 | $0 | $0 | $0 | $0 | $0 | $0 | $0 | $0 | $0 | $0 | $0 | |
| Total Cost of Sales | $112,997 | $114,145 | $115,252 | $116,423 | $117,580 | $118,721 | $119,927 | $121,092 | $122,321 | $123,537 | $124,687 | $126,004 | |
| Gross Margin | $38,423 | $38,789 | $39,211 | $39,585 | $39,989 | $40,423 | $40,809 | $41,251 | $41,645 | $42,069 | $42,575 | $42,931 | |
| Gross Margin % | 25.38% | 25.36% | 25.39% | 25.37% | 25.38% | 25.40% | 25.39% | 25.41% | 25.40% | 25.40% | 25.45% | 25.41% | |
| Expenses | |||||||||||||
| Payroll | $8,376 | $8,457 | $8,376 | $8,457 | $8,457 | $8,376 | $8,457 | $8,376 | $8,457 | $8,457 | $8,217 | $8,457 | |
| Sales and Marketing and Other Expenses | $6,500 | $6,500 | $6,500 | $6,500 | $6,500 | $6,500 | $6,500 | $6,500 | $6,500 | $6,500 | $6,500 | $6,500 | |
| Depreciation | $50 | $50 | $50 | $50 | $50 | $50 | $50 | $50 | $50 | $50 | $50 | $50 | |
| Rent | $2,717 | $2,717 | $2,717 | $2,717 | $2,717 | $2,717 | $2,717 | $2,717 | $2,717 | $2,717 | $2,717 | $2,717 | |
| Utilities | $400 | $400 | $400 | $400 | $400 | $400 | $400 | $400 | $400 | $400 | $400 | $400 | |
| Insurance | $94 | $94 | $94 | $94 | $94 | $94 | $94 | $94 | $94 | $94 | $94 | $94 | |
| Payroll Taxes | 20% | $562 | $581 | $568 | $581 | $581 | $562 | $581 | $562 | $581 | $581 | $525 | $581 |
| Website | 15% | $100 | $100 | $100 | $100 | $100 | $100 | $100 | $100 | $100 | $100 | $100 | $100 |
| Other | $0 | $0 | $0 | $0 | $0 | $0 | $0 | $0 | $0 | $0 | $0 | $0 | |
| Total Operating Expenses | $18,799 | $18,899 | $18,805 | $18,899 | $18,899 | $18,799 | $18,899 | $18,799 | $18,899 | $18,899 | $18,603 | $18,899 | |
| Profit Before Interest and Taxes | $19,624 | $19,890 | $20,406 | $20,686 | $21,090 | $21,623 | $21,909 | $22,451 | $22,746 | $23,170 | $23,972 | $24,032 | |
| EBITDA | $19,674 | $19,940 | $20,456 | $20,736 | $21,140 | $21,673 | $21,959 | $22,501 | $22,796 | $23,220 | $24,022 | $24,082 | |
| Interest Expense | $700 | $689 | $678 | $666 | $655 | $644 | $633 | $621 | $610 | $599 | $588 | $576 | |
| Taxes Incurred | $5,677 | $5,760 | $5,918 | $6,006 | $6,130 | $6,294 | $6,383 | $6,549 | $6,641 | $6,771 | $7,015 | $7,037 | |
| Net Profit | $13,247 | $13,441 | $13,810 | $14,014 | $14,304 | $14,686 | $14,894 | $15,281 | $15,495 | $15,800 | $16,369 | $16,419 | |
| Net Profit/Sales | 8.75% | 8.79% | 8.94% | 8.98% | 9.08% | 9.23% | 9.27% | 9.41% | 9.45% | 9.54% | 9.79% | 9.72% | |
| Pro Forma Cash Flow | |||||||||||||
| Month 1 | Month 2 | Month 3 | Month 4 | Month 5 | Month 6 | Month 7 | Month 8 | Month 9 | Month 10 | Month 11 | Month 12 | ||
| Cash Received | |||||||||||||
| Cash from Operations | |||||||||||||
| Cash Sales | $151,420 | $152,934 | $154,464 | $156,008 | $157,568 | $159,144 | $160,735 | $162,343 | $163,966 | $165,606 | $167,262 | $168,935 | |
| Subtotal Cash from Operations | $151,420 | $152,934 | $154,464 | $156,008 | $157,568 | $159,144 | $160,735 | $162,343 | $163,966 | $165,606 | $167,262 | $168,935 | |
| Additional Cash Received | |||||||||||||
| Sales Tax, VAT, HST/GST Received | 7.00% | $10,599 | $10,705 | $10,812 | $10,921 | $11,030 | $11,140 | $11,251 | $11,364 | $11,478 | $11,592 | $11,708 | $11,825 |
| New Current Borrowing | $0 | $0 | $0 | $0 | $0 | $0 | $0 | $0 | $0 | $0 | $0 | $0 | |
| New Other Liabilities (interest-free) | $0 | $0 | $0 | $0 | $0 | $0 | $0 | $0 | $0 | $0 | $0 | $0 | |
| New Long-term Liabilities | $0 | $0 | $0 | $0 | $0 | $0 | $0 | $0 | $0 | $0 | $0 | $0 | |
| Sales of Other Current Assets | $0 | $0 | $0 | $0 | $0 | $0 | $0 | $0 | $0 | $0 | $0 | $0 | |
| Sales of Long-term Assets | $0 | $0 | $0 | $0 | $0 | $0 | $0 | $0 | $0 | $0 | $0 | $0 | |
| New Investment Received | $0 | $0 | $0 | $0 | $0 | $0 | $0 | $0 | $0 | $0 | $0 | $0 | |
| Subtotal Cash Received | $162,019 | $163,640 | $165,276 | $166,929 | $168,598 | $170,284 | $171,987 | $173,707 | $175,444 | $177,198 | $178,970 | $180,760 | |
| Expenditures | Month 1 | Month 2 | Month 3 | Month 4 | Month 5 | Month 6 | Month 7 | Month 8 | Month 9 | Month 10 | Month 11 | Month 12 | |
| Expenditures from Operations | |||||||||||||
| Cash Spending | $8,376 | $8,457 | $8,376 | $8,457 | $8,457 | $8,376 | $8,457 | $8,376 | $8,457 | $8,457 | $8,217 | $8,457 | |
| Bill Payments | $5,801 | $172,651 | $132,289 | $133,490 | $134,817 | $136,071 | $137,334 | $138,702 | $139,964 | $141,360 | $142,677 | $143,943 | |
| Subtotal Spent on Operations | $14,177 | $181,108 | $140,665 | $141,947 | $143,274 | $144,447 | $145,791 | $147,078 | $148,421 | $149,817 | $150,894 | $152,400 | |
| Additional Cash Spent | |||||||||||||
| Sales Tax, VAT, HST/GST Paid Out | $10,599 | $10,705 | $10,812 | $10,921 | $11,030 | $11,140 | $11,251 | $11,364 | $11,478 | $11,592 | $11,708 | $11,825 | |
| Principal Repayment of Current Borrowing | $0 | $0 | $0 | $0 | $0 | $0 | $0 | $0 | $0 | $0 | $0 | $0 | |
| Other Liabilities Principal Repayment | $0 | $0 | $0 | $0 | $0 | $0 | $0 | $0 | $0 | $0 | $0 | $0 | |
| Long-term Liabilities Principal Repayment | $0 | $2,250 | $2,250 | $2,250 | $2,250 | $2,250 | $2,250 | $2,250 | $2,250 | $2,250 | $2,250 | $2,250 | |
| Purchase Other Current Assets | $0 | $0 | $0 | $0 | $0 | $0 | $0 | $0 | $0 | $0 | $0 | $0 | |
| Purchase Long-term Assets | $0 | $0 | $0 | $0 | $0 | $0 | $0 | $0 | $0 | $0 | $0 | $0 | |
| Dividends | $0 | $0 | $0 | $0 | $0 | $0 | $0 | $0 | $0 | $0 | $0 | $0 | |
| Subtotal Cash Spent | $24,777 | $194,063 | $153,728 | $155,118 | $156,554 | $157,837 | $159,292 | $160,692 | $162,149 | $163,660 | $164,853 | $166,476 | |
| Net Cash Flow | $137,243 | ($30,423) | $11,548 | $11,811 | $12,044 | $12,447 | $12,694 | $13,014 | $13,295 | $13,539 | $14,117 | $14,284 | |
| Cash Balance | $164,807 | $134,383 | $145,932 | $157,743 | $169,787 | $182,234 | $194,928 | $207,942 | $221,237 | $234,776 | $248,894 | $263,178 | |
| Pro Forma Balance Sheet | |||||||||||||
| Month 1 | Month 2 | Month 3 | Month 4 | Month 5 | Month 6 | Month 7 | Month 8 | Month 9 | Month 10 | Month 11 | Month 12 | ||
| Assets | Starting Balances | ||||||||||||
| Current Assets | |||||||||||||
| Cash | $27,564 | $164,807 | $134,383 | $145,932 | $157,743 | $169,787 | $182,234 | $194,928 | $207,942 | $221,237 | $234,776 | $248,894 | $263,178 |
| Inventory | $80,000 | $124,296 | $125,559 | $126,778 | $128,066 | $129,337 | $130,593 | $131,920 | $133,201 | $134,553 | $135,890 | $137,155 | $138,604 |
| Other Current Assets | $12,100 | $12,100 | $12,100 | $12,100 | $12,100 | $12,100 | $12,100 | $12,100 | $12,100 | $12,100 | $12,100 | $12,100 | $12,100 |
| Total Current Assets | $119,664 | $301,203 | $272,043 | $284,809 | $297,908 | $311,224 | $324,927 | $338,948 | $353,244 | $367,891 | $382,766 | $398,149 | $413,882 |
| Long-term Assets | |||||||||||||
| Long-term Assets | $5,000 | $5,000 | $5,000 | $5,000 | $5,000 | $5,000 | $5,000 | $5,000 | $5,000 | $5,000 | $5,000 | $5,000 | $5,000 |
| Accumulated Depreciation | $0 | $50 | $100 | $150 | $200 | $250 | $300 | $350 | $400 | $450 | $500 | $550 | $600 |
| Total Long-term Assets | $5,000 | $4,950 | $4,900 | $4,850 | $4,800 | $4,750 | $4,700 | $4,650 | $4,600 | $4,550 | $4,500 | $4,450 | $4,400 |
| Total Assets | $124,664 | $306,153 | $276,943 | $289,659 | $302,708 | $315,974 | $329,627 | $343,598 | $357,844 | $372,441 | $387,266 | $402,599 | $418,282 |
| Liabilities and Capital | Month 1 | Month 2 | Month 3 | Month 4 | Month 5 | Month 6 | Month 7 | Month 8 | Month 9 | Month 10 | Month 11 | Month 12 | |
| Current Liabilities | |||||||||||||
| Accounts Payable | $0 | $168,242 | $127,841 | $128,998 | $130,283 | $131,495 | $132,712 | $134,039 | $135,254 | $136,606 | $137,881 | $139,095 | $140,609 |
| Current Borrowing | $0 | $0 | $0 | $0 | $0 | $0 | $0 | $0 | $0 | $0 | $0 | $0 | $0 |
| Other Current Liabilities | $0 | $0 | $0 | $0 | $0 | $0 | $0 | $0 | $0 | $0 | $0 | $0 | $0 |
| Subtotal Current Liabilities | $0 | $168,242 | $127,841 | $128,998 | $130,283 | $131,495 | $132,712 | $134,039 | $135,254 | $136,606 | $137,881 | $139,095 | $140,609 |
| Long-term Liabilities | $140,000 | $140,000 | $137,750 | $135,500 | $133,250 | $131,000 | $128,750 | $126,500 | $124,250 | $122,000 | $119,750 | $117,500 | $115,250 |
| Total Liabilities | $140,000 | $308,242 | $265,591 | $264,498 | $263,533 | $262,495 | $261,462 | $260,539 | $259,504 | $258,606 | $257,631 | $256,595 | $255,859 |
| Paid-in Capital | $80,000 | $80,000 | $80,000 | $80,000 | $80,000 | $80,000 | $80,000 | $80,000 | $80,000 | $80,000 | $80,000 | $80,000 | $80,000 |
| Retained Earnings | ($95,336) | ($95,336) | ($95,336) | ($95,336) | ($95,336) | ($95,336) | ($95,336) | ($95,336) | ($95,336) | ($95,336) | ($95,336) | ($95,336) | ($95,336) |
| Earnings | $0 | $13,247 | $26,688 | $40,498 | $54,511 | $68,816 | $83,501 | $98,395 | $113,676 | $129,171 | $144,971 | $161,340 | $177,759 |
| Total Capital | ($15,336) | ($2,089) | $11,352 | $25,162 | $39,175 | $53,480 | $68,165 | $83,059 | $98,340 | $113,835 | $129,635 | $146,004 | $162,423 |
| Total Liabilities and Capital | $124,664 | $306,153 | $276,943 | $289,659 | $302,708 | $315,974 | $329,627 | $343,598 | $357,844 | $372,441 | $387,266 | $402,599 | $418,282 |
| Net Worth | ($15,336) | ($2,089) | $11,352 | $25,162 | $39,175 | $53,480 | $68,165 | $83,059 | $98,340 | $113,835 | $129,635 | $146,004 | $162,423 |

