
Jungle Zone Paintball
Executive Summary
Jungle Zone Paintball will officially open its doors April 1. Located just off Interstate Highway 5 in Raphael, WA, it is a great location serving over 750,000 people in the greater Richmond area. Nationwide, paintball is growing as a recreational activity and sport. The popularity has lead to regional and national competitions with cash prizes of over $100,000 to the winners. Jungle Zone Paintball will have both indoor and outdoor playing facilities, as well as a concession stand and rental shop.
John Martin, co-owner of Jungle Zone Paintball, has been connected with the sport for over ten years. For the past five years, John has been the manager of the popular Urban Nightmare Paintball facility in Rosemead, a hundred miles south of Raphael. He is a familiar fixture at all of the region’s paintball events and last year served as league commissioner for Rosemead’s 25-team Xtreme League Competition.
Ten of the teams that are part of Rosemead’s Xtreme League are from the Raphael area and have already committed to recruit another six teams to create a new league for the area. Jungle Zone Paintball will serve as the league practicing and playing facility.
With this base of support, Jungle Zone Paintball will focus on the creation of a 10-15 team youth league. The league play will become a foundation for the facility to grow its customer base and promote the sport of paintball to new customers.
The dynamic management team responsible for the design, building, development of the facility, and hands-on management of the daily operations are John Martin, Wendy Martin, William Johnson and Larry Priest. In addition, a team-oriented and customer-focused staff of eight will support the management team.
1.1 Objectives
Jungle Zone Paintball will build a paintball game facility in Raphael, WA. Service/products include an indoor/outdoor playing facilities, snack bar, rental shop, paintball sales and clean-up/repair area. The commercial funding will be raised from private investors. Jungle Zone Paintball anticipates opening on April 1, with top gun first year gross revenues.
1.2 Mission
The purpose of Jungle Zone Paintball is to provide the residents of Raphael the best paintball facility in the region. It will provide excellent service, quality rental equipment and ammunition, and a clean-up facility, which will cater to the entire family. The snack bar will be a large comfortable area where players and guests can socialize.
The indoor facility is a 10,000 square foot converted factory floor that will be set-up in a tropical motif. The outdoor facility will be on a 10 acre parcel of land and will include an imaginary town setting called Piranhaville.
On all playing fields, Jungle Zone will create a competitive environment that will promote playing safe, playing hard, and playing fair. Our customers will be satisfied and will return again and again.
1.3 Keys to Success
Jungle Zone Paintball has three keys to success.
- Location. Other services and stores in the surrounding area will ensure passing traffic.
- Low overhead cost. Jungle Zone Paintball’s management will keep overhead cost at a minimum.
- Wide range of game options. Jungle Zone Paintball will aim to provide diverse and changing games.
Company Summary
The facility site is a ten-acre tract of wooded flat land with an old industrial building and adjacent parking lot, located in what is quickly becoming the most desirable business area of York County. This is the center of York County’s commercial development. The market for a paintball facility in York County is superior to most, due to the tremendous population growth during the past five years, the overwhelming majority of which is within ten miles of the facility. In addition, the area has Lawrence University with a student population of 15,000.
Paintball is a growing participation sport in the United States. Paintball facilities grossed over $100 million in sales last year. By far, the most significant factor to affect the paintball business in the forthcoming decade is the dramatic growth of the 16-25 year old segment of the population, which will increase by 54%. This age group represents the prime segment of the population that joins paintball leagues, and that means bottom-line profit for the facility will increase. The facility will be the most modern in southern Washington.
2.1 Company Ownership
Jungle Zone Paintball is owned by John Martin, William Johnson, Robert Johnson, Wendy Martin and Larry Priest.
2.2 Start-up Summary
During the start-up phase of this project, the following major events will occur, some of them simultaneously:
- Obtain $250,000 investment.
- Obtain $150,000 SBA loan.
- Obtain all required permits.
- Lease the facility site.
- Order paintball equipment (short-term assets).
- Start building center/leasehold improvements (this on two-month timeline).
- Facility furniture and equipment (long-term assets).
- Hire key personnel.
- Start development of leagues.
- Finalize operating procedures.
- Intensify marketing campaign.
- Hire remaining staff.
- Train staff.
- Order inventory.
- Open for business.

| Start-up Funding | |
| Start-up Expenses to Fund | $79,200 |
| Start-up Assets to Fund | $320,800 |
| Total Funding Required | $400,000 |
| Assets | |
| Non-cash Assets from Start-up | $152,000 |
| Cash Requirements from Start-up | $168,800 |
| Additional Cash Raised | $0 |
| Cash Balance on Starting Date | $168,800 |
| Total Assets | $320,800 |
| Liabilities and Capital | |
| Liabilities | |
| Current Borrowing | $0 |
| Long-term Liabilities | $150,000 |
| Accounts Payable (Outstanding Bills) | $0 |
| Other Current Liabilities (interest-free) | $0 |
| Total Liabilities | $150,000 |
| Capital | |
| Planned Investment | |
| Investor 1 | $50,000 |
| Investor 2 | $50,000 |
| Investor 3 | $50,000 |
| Investor 4 | $50,000 |
| Investor 5 | $50,000 |
| Other | $0 |
| Additional Investment Requirement | $0 |
| Total Planned Investment | $250,000 |
| Loss at Start-up (Start-up Expenses) | ($79,200) |
| Total Capital | $170,800 |
| Total Capital and Liabilities | $320,800 |
| Total Funding | $400,000 |
| Start-up | |
| Requirements | |
| Start-up Expenses | |
| Legal | $500 |
| Stationery etc. | $200 |
| Brochures | $500 |
| Permits | $3,000 |
| Insurance | $1,000 |
| Lease | $6,000 |
| Rehab Indoor/Outdoor Field Surfaces | $10,000 |
| Building Lighting/AC | $3,000 |
| Cash Reserves for Hiring | $50,000 |
| Snackbar Setup | $5,000 |
| Total Start-up Expenses | $79,200 |
| Start-up Assets | |
| Cash Required | $168,800 |
| Start-up Inventory | $9,000 |
| Other Current Assets | $15,000 |
| Long-term Assets | $128,000 |
| Total Assets | $320,800 |
| Total Requirements | $400,000 |
Products and Services
The paintball business is a growing entertainment. This is a sport that all ages can participate in and enjoy as individuals or in groups. The core revenue producer is the league structure, which is all encompassing. The basic element in leagues is its skill levels–beginning with youth leagues, it progresses until it reaches the best league players. The largest number of league paintball players are in the 26-46 age group. These leagues are primarily made up of men with similar backgrounds. League development is only limited by management’s imagination; however, the key is to find a common interest which each member of the league shares.
Jungle Zone Paintball offers all skill levels the best playing fields, the best equipment rentals and ammunition, and the best officials. We focus on making league play the exceptional experience it should be.
Market Analysis Summary
The prime market of a paintball facility is a ten-mile radius. However, if the facility has easy access to the Interstate highway system, that radius can be extended to twenty miles.
The demographics of Jungle Zone Paintball are:
- Total population in the ten-mile radius is in excess of 500,000 people.
- 21.5% are men 26 to 46 years old.
- 18% are young men 16 to 25 years old.
- The average income for the area is $43,682.
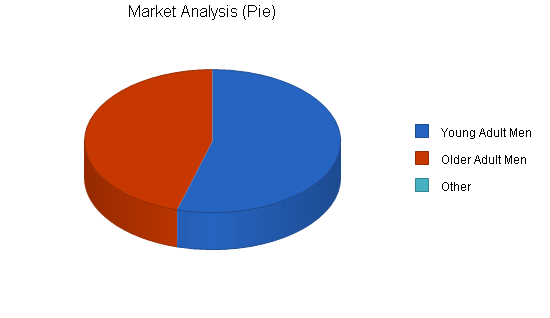
4.1 Market Segmentation
The paintball market is targeted at two main groups:
- Young Men: ages 16-25.
- Older Men: ages 26-46.
| Market Analysis | |||||||
| Year 1 | Year 2 | Year 3 | Year 4 | Year 5 | |||
| Potential Customers | Growth | CAGR | |||||
| Young Adult Men | 15% | 107,500 | 123,625 | 142,169 | 163,494 | 188,018 | 15.00% |
| Older Adult Men | 10% | 90,000 | 99,000 | 108,900 | 119,790 | 131,769 | 10.00% |
| Other | 0% | 0 | 0 | 0 | 0 | 0 | 0.00% |
| Total | 12.80% | 197,500 | 222,625 | 251,069 | 283,284 | 319,787 | 12.80% |
Strategy and Implementation Summary
Customer service is paramount in the paintball business. The starting point to accomplish this is to have a trained and motivated staff that enjoys working directly with the public. It is always easier to please your customers when the facility is exceptional and all of the equipment is in proper working order.

The satisfaction of the league players is the best marketing vehicle we have in building a loyal customer base.
5.1 Competitive Edge
Jungle Zone Paintball’s competitive advantage over its potential competitors is the following:
- Location. The facility is located right off I-5 exit 265B and near the new Raphael Shopping Complex and Lawrence University. The new shopping complex will become a common destination for the area’s residents and Jungle Zone Paintball will benefit from the road improvement that the shopping center has created.
- Low overhead cost. Jungle Zone Paintball’s management will keep overhead cost at a minimum. First, during resurfacing of the facility, John Martin will be project manager, saving approximately 15% of construction costs. His experience at operating paintball facilities will contribute to his ability to streamline operations while minimizing unnecessary expenses.
- Wide range of game options. Jungle Zone Paintball will provide our customers with multiple playing fields (indoor and outdoor) and changing game scenarios that will be tailored to group skill. This diversity will bring in more customers and assure their satisfaction with the experience.
5.2 Marketing Strategy
The marketing strategy will be to attract customers from both target groups by using a distinct pricing and promotion strategy for each group.
5.2.1 Pricing Strategy
Pricing strategy for young adults:
- Admission for children and young adults (ages 16-26) will be $10.
- Admission for a group of five or more children and young adults is $8 for each.
- Gun rentals and paint balls are discounted by 15% on Monday – Thursday (except summer months).
- College-focused two for the price of one admission on Monday – Thursday .
Pricing strategy for older adults:
- Admission will be $15.
- Admission for a group of five older adults is $12 for each.
- Gun rentals and paint balls are discounted by 15% on Monday – Thursday (except summer months).
5.2.2 Promotion Strategy
Promotion strategy for young adults:
- Sponsor weekly youth and college league competition.
- Advertise on Lawrence University campus.
- Advertise in video arcades and skateboard shops.
Promotion strategy for older adults:
- Sponsor a newbie five-man league.
- Advertise employee-event package deal to local businesses.
5.3 Sales Strategy
Jungle Zone Paintball provides a venue for the paintball player to enjoy his leisure time participating in a competitive sport that requires strength and athletic ability.
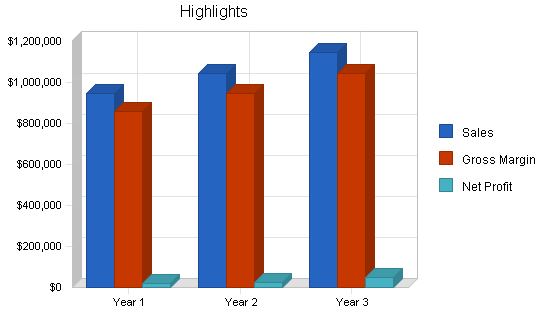
5.3.1 Sales Forecast
The charts and table below show Jungle Zone Paintball projected Sales Forecast for three years.


| Sales Forecast | |||
| Year 1 | Year 2 | Year 3 | |
| Unit Sales | |||
| Admission | 12,500 | 16,500 | 19,000 |
| Rentals | 10,125 | 11,138 | 11,694 |
| Paint Balls | 24,500 | 25,725 | 27,011 |
| Food | 6,480 | 6,804 | 7,144 |
| Other | 0 | 0 | 0 |
| Total Unit Sales | 53,605 | 60,167 | 64,850 |
| Unit Prices | Year 1 | Year 2 | Year 3 |
| Admission | $12.00 | $12.00 | $13.00 |
| Rentals | $15.00 | $15.00 | $16.00 |
| Paint Balls | $25.00 | $25.00 | $25.00 |
| Food | $5.00 | $5.00 | $5.00 |
| Other | $0.00 | $0.00 | $0.00 |
| Sales | |||
| Admission | $150,000 | $198,000 | $247,000 |
| Rentals | $151,875 | $167,063 | $187,110 |
| Paint Balls | $612,500 | $643,125 | $675,281 |
| Food | $32,400 | $34,020 | $35,721 |
| Other | $0 | $0 | $0 |
| Total Sales | $946,775 | $1,042,208 | $1,145,112 |
| Direct Unit Costs | Year 1 | Year 2 | Year 3 |
| Admission | $0.00 | $0.00 | $0.00 |
| Rentals | $1.00 | $1.00 | $1.00 |
| Paint Balls | $3.00 | $3.00 | $3.00 |
| Food | $1.00 | $1.00 | $1.00 |
| Other | $0.00 | $0.00 | $0.00 |
| Direct Cost of Sales | |||
| Admission | $0 | $0 | $0 |
| Rentals | $10,125 | $11,138 | $11,694 |
| Paint Balls | $73,500 | $77,175 | $81,034 |
| Food | $6,480 | $6,804 | $7,144 |
| Other | $0 | $0 | $0 |
| Subtotal Direct Cost of Sales | $90,105 | $95,117 | $99,872 |
5.4 Milestones
The following table shows important milestones for Jungle Zone Paintball.

| Milestones | |||||
| Milestone | Start Date | End Date | Budget | Manager | Department |
| Lease Land | 1/1/2002 | 1/1/2002 | $0 | ABC | Marketing |
| Rehab Outdoor Surface | 2/1/2001 | 3/1/2001 | $0 | ABC | Marketing |
| Rehab Indoor Surface | 1/15/2001 | 2/28/2001 | $0 | ABC | Web |
| Hiring Staff | 2/2/2002 | 3/15/2002 | $0 | ABC | Web |
| Equipment Set-Up | 2/1/2002 | 3/12/2002 | $0 | ABC | Web |
| Advertising | 3/1/2002 | 3/30/2002 | $0 | ABC | Department |
| Opening | 4/1/2002 | 4/1/2002 | $0 | ABC | Department |
| Totals | $0 | ||||
Management Summary
Our management philosophy is based on mutual respect for all contributions made by our employees without regard to the position they hold in the company. People who work at Jungle Zone Paintball want to work here because the work environment enables them to work smarter–not harder, and they know their suggestions are appreciated. The ability of Jungle Zone to accomplish its goals and lead the Paintball industry is significantly related to the expertise, abilities, and can-do spirit of the management team. The high standards set by Jungle Zone’s team will make it difficult for competitors to enter and survive in the market area.
6.1 Management Team
John Martin, Manager. John Martin has a Bachelors degree in business management, five years management experience in the restaurant/bar business and five subsequent years managing a paintball facility. John’s specific responsibilities will lie primarily with the coordination and oversight of daily operations.
Wendy Martin, Accountant. Wendy Martin has a B.S. in accounting and ten years of accountant experience. Wendy Martin’s specific responsibilities will be administrative management to include inventory management, accounts payable, purchasing, and payroll.
William Johnson, Assistant Manager/League Coordinator. William Johnson has been involved in Paintball competition and facility management for the past ten years. Most recently, he has served as regional head of league referees. For the last three years, William Johnson has been the safety inspector for Urban Nightmare Paintball.
Larry Priest, Facility Maintenance. Larry Priest has more than seven years of paintball facility experience and over fifteen years of construction experience. Currently, Larry Priest is a construction contractor with Ronn Construction.
6.2 Personnel Plan
The Jungle Zone Paintball will have the following personnel:
- Four counter people.
- One concession person.
- Three referees and safety inspectors.
| Personnel Plan | |||
| Year 1 | Year 2 | Year 3 | |
| Manager | $54,000 | $58,000 | $61,000 |
| Accountant | $38,500 | $45,000 | $48,000 |
| Assistant Manager | $35,000 | $45,000 | $48,000 |
| Facility Maintenance | $36,000 | $40,000 | $43,000 |
| Counter Staff | $35,000 | $38,000 | $40,000 |
| Concession Person | $25,000 | $26,250 | $27,563 |
| Referee/Safety Inspectors | $70,000 | $80,000 | $85,000 |
| Total People | 0 | 0 | 0 |
| Total Payroll | $293,500 | $332,250 | $352,563 |
Financial Plan
The following is the Financial Plan for Jungle Zone Paintball.
7.1 Break-even Analysis
With the average monthly fixed costs and projected profit margin, Jungle Zone Paintball will need the following monthly sales revenue to break even.

| Break-even Analysis | |
| Monthly Units Break-even | 4,233 |
| Monthly Revenue Break-even | $74,759 |
| Assumptions: | |
| Average Per-Unit Revenue | $17.66 |
| Average Per-Unit Variable Cost | $1.68 |
| Estimated Monthly Fixed Cost | $67,644 |
7.2 Projected Profit and Loss
The company’s projected profit and loss is outlined in the following table.


| Pro Forma Profit and Loss | |||
| Year 1 | Year 2 | Year 3 | |
| Sales | $946,775 | $1,042,208 | $1,145,112 |
| Direct Cost of Sales | $90,105 | $95,117 | $99,872 |
| Other Production Expenses | $0 | $0 | $0 |
| Total Cost of Sales | $90,105 | $95,117 | $99,872 |
| Gross Margin | $856,670 | $947,091 | $1,045,240 |
| Gross Margin % | 90.48% | 90.87% | 91.28% |
| Expenses | |||
| Payroll | $293,500 | $332,250 | $352,563 |
| Sales and Marketing and Other Expenses | $366,000 | $410,000 | $450,000 |
| Depreciation | $6,000 | $6,000 | $6,000 |
| Leased Equipment | $0 | $0 | $0 |
| Utilities | $18,200 | $19,500 | $19,800 |
| Insurance | $12,000 | $12,000 | $12,000 |
| Rent | $72,000 | $72,000 | $72,000 |
| Payroll Taxes | $44,025 | $49,838 | $52,884 |
| Other | $0 | $0 | $0 |
| Total Operating Expenses | $811,725 | $901,588 | $965,247 |
| Profit Before Interest and Taxes | $44,945 | $45,504 | $79,993 |
| EBITDA | $50,945 | $51,504 | $85,993 |
| Interest Expense | $13,984 | $12,188 | $10,313 |
| Taxes Incurred | $9,288 | $9,995 | $20,904 |
| Net Profit | $21,672 | $23,321 | $48,776 |
| Net Profit/Sales | 2.29% | 2.24% | 4.26% |
7.3 Projected Cash Flow
The company’s estimated cash flow analysis is outlined in the following table.

| Pro Forma Cash Flow | |||
| Year 1 | Year 2 | Year 3 | |
| Cash Received | |||
| Cash from Operations | |||
| Cash Sales | $946,775 | $1,042,208 | $1,145,112 |
| Subtotal Cash from Operations | $946,775 | $1,042,208 | $1,145,112 |
| Additional Cash Received | |||
| Sales Tax, VAT, HST/GST Received | $0 | $0 | $0 |
| New Current Borrowing | $0 | $0 | $0 |
| New Other Liabilities (interest-free) | $0 | $0 | $0 |
| New Long-term Liabilities | $0 | $0 | $0 |
| Sales of Other Current Assets | $0 | $0 | $0 |
| Sales of Long-term Assets | $0 | $0 | $0 |
| New Investment Received | $0 | $0 | $0 |
| Subtotal Cash Received | $946,775 | $1,042,208 | $1,145,112 |
| Expenditures | Year 1 | Year 2 | Year 3 |
| Expenditures from Operations | |||
| Cash Spending | $293,500 | $332,250 | $352,563 |
| Bill Payments | $582,905 | $666,889 | $733,506 |
| Subtotal Spent on Operations | $876,405 | $999,139 | $1,086,068 |
| Additional Cash Spent | |||
| Sales Tax, VAT, HST/GST Paid Out | $0 | $0 | $0 |
| Principal Repayment of Current Borrowing | $0 | $0 | $0 |
| Other Liabilities Principal Repayment | $0 | $0 | $0 |
| Long-term Liabilities Principal Repayment | $18,750 | $18,750 | $18,750 |
| Purchase Other Current Assets | $0 | $0 | $0 |
| Purchase Long-term Assets | $0 | $0 | $0 |
| Dividends | $0 | $0 | $0 |
| Subtotal Cash Spent | $895,155 | $1,017,889 | $1,104,818 |
| Net Cash Flow | $51,620 | $24,319 | $40,294 |
| Cash Balance | $220,420 | $244,739 | $285,033 |
7.4 Projected Balance Sheet
The company’s projected balance sheet is outlined in the following table.
| Pro Forma Balance Sheet | |||
| Year 1 | Year 2 | Year 3 | |
| Assets | |||
| Current Assets | |||
| Cash | $220,420 | $244,739 | $285,033 |
| Inventory | $8,085 | $8,535 | $8,961 |
| Other Current Assets | $15,000 | $15,000 | $15,000 |
| Total Current Assets | $243,505 | $268,273 | $308,994 |
| Long-term Assets | |||
| Long-term Assets | $128,000 | $128,000 | $128,000 |
| Accumulated Depreciation | $6,000 | $12,000 | $18,000 |
| Total Long-term Assets | $122,000 | $116,000 | $110,000 |
| Total Assets | $365,505 | $384,273 | $418,994 |
| Liabilities and Capital | Year 1 | Year 2 | Year 3 |
| Current Liabilities | |||
| Accounts Payable | $41,782 | $55,980 | $60,674 |
| Current Borrowing | $0 | $0 | $0 |
| Other Current Liabilities | $0 | $0 | $0 |
| Subtotal Current Liabilities | $41,782 | $55,980 | $60,674 |
| Long-term Liabilities | $131,250 | $112,500 | $93,750 |
| Total Liabilities | $173,032 | $168,480 | $154,424 |
| Paid-in Capital | $250,000 | $250,000 | $250,000 |
| Retained Earnings | ($79,200) | ($57,528) | ($34,206) |
| Earnings | $21,672 | $23,321 | $48,776 |
| Total Capital | $192,472 | $215,794 | $264,570 |
| Total Liabilities and Capital | $365,505 | $384,273 | $418,994 |
| Net Worth | $192,472 | $215,794 | $264,570 |
7.5 Business Ratios
The company’s projected business ratios are provided in the table below. The final column, Industry Profile, shows significant ratios for the Amusement and Recreation industry, as determined by the Standard Industry Classification (SIC) Index code 7999.
| Ratio Analysis | ||||
| Year 1 | Year 2 | Year 3 | Industry Profile | |
| Sales Growth | 0.00% | 10.08% | 9.87% | 15.20% |
| Percent of Total Assets | ||||
| Inventory | 2.21% | 2.22% | 2.14% | 3.50% |
| Other Current Assets | 4.10% | 3.90% | 3.58% | 34.40% |
| Total Current Assets | 66.62% | 69.81% | 73.75% | 42.90% |
| Long-term Assets | 33.38% | 30.19% | 26.25% | 57.10% |
| Total Assets | 100.00% | 100.00% | 100.00% | 100.00% |
| Current Liabilities | 11.43% | 14.57% | 14.48% | 36.40% |
| Long-term Liabilities | 35.91% | 29.28% | 22.38% | 23.30% |
| Total Liabilities | 47.34% | 43.84% | 36.86% | 59.70% |
| Net Worth | 52.66% | 56.16% | 63.14% | 40.30% |
| Percent of Sales | ||||
| Sales | 100.00% | 100.00% | 100.00% | 100.00% |
| Gross Margin | 90.48% | 90.87% | 91.28% | 0.00% |
| Selling, General & Administrative Expenses | 88.19% | 88.64% | 87.02% | 76.60% |
| Advertising Expenses | 6.97% | 5.76% | 6.11% | 2.60% |
| Profit Before Interest and Taxes | 4.75% | 4.37% | 6.99% | 2.00% |
| Main Ratios | ||||
| Current | 5.83 | 4.79 | 5.09 | 1.17 |
| Quick | 5.63 | 4.64 | 4.94 | 0.75 |
| Total Debt to Total Assets | 47.34% | 43.84% | 36.86% | 59.70% |
| Pre-tax Return on Net Worth | 16.09% | 15.44% | 26.34% | 2.40% |
| Pre-tax Return on Assets | 8.47% | 8.67% | 16.63% | 6.00% |
| Additional Ratios | Year 1 | Year 2 | Year 3 | |
| Net Profit Margin | 2.29% | 2.24% | 4.26% | n.a |
| Return on Equity | 11.26% | 10.81% | 18.44% | n.a |
| Activity Ratios | ||||
| Inventory Turnover | 8.57 | 11.45 | 11.42 | n.a |
| Accounts Payable Turnover | 14.95 | 12.17 | 12.17 | n.a |
| Payment Days | 27 | 26 | 29 | n.a |
| Total Asset Turnover | 2.59 | 2.71 | 2.73 | n.a |
| Debt Ratios | ||||
| Debt to Net Worth | 0.90 | 0.78 | 0.58 | n.a |
| Current Liab. to Liab. | 0.24 | 0.33 | 0.39 | n.a |
| Liquidity Ratios | ||||
| Net Working Capital | $201,722 | $212,294 | $248,320 | n.a |
| Interest Coverage | 3.21 | 3.73 | 7.76 | n.a |
| Additional Ratios | ||||
| Assets to Sales | 0.39 | 0.37 | 0.37 | n.a |
| Current Debt/Total Assets | 11% | 15% | 14% | n.a |
| Acid Test | 5.63 | 4.64 | 4.94 | n.a |
| Sales/Net Worth | 4.92 | 4.83 | 4.33 | n.a |
| Dividend Payout | 0.00 | 0.00 | 0.00 | n.a |
Appendix
| Sales Forecast | |||||||||||||
| Month 1 | Month 2 | Month 3 | Month 4 | Month 5 | Month 6 | Month 7 | Month 8 | Month 9 | Month 10 | Month 11 | Month 12 | ||
| Unit Sales | |||||||||||||
| Admission | 0% | 0 | 0 | 0 | 1,000 | 1,000 | 1,500 | 1,800 | 2,000 | 1,600 | 1,400 | 1,200 | 1,000 |
| Rentals | 0% | 0 | 0 | 0 | 750 | 750 | 1,250 | 1,500 | 1,700 | 1,375 | 1,150 | 900 | 750 |
| Paint Balls | 0% | 0 | 0 | 0 | 2,000 | 2,000 | 3,000 | 3,800 | 4,000 | 3,000 | 2,500 | 2,200 | 2,000 |
| Food | 0% | 0 | 0 | 0 | 500 | 500 | 760 | 760 | 860 | 950 | 900 | 650 | 600 |
| Other | 0% | 0 | 0 | 0 | 0 | 0 | 0 | 0 | 0 | 0 | 0 | 0 | 0 |
| Total Unit Sales | 0 | 0 | 0 | 4,250 | 4,250 | 6,510 | 7,860 | 8,560 | 6,925 | 5,950 | 4,950 | 4,350 | |
| Unit Prices | Month 1 | Month 2 | Month 3 | Month 4 | Month 5 | Month 6 | Month 7 | Month 8 | Month 9 | Month 10 | Month 11 | Month 12 | |
| Admission | $12.00 | $12.00 | $12.00 | $12.00 | $12.00 | $12.00 | $12.00 | $12.00 | $12.00 | $12.00 | $12.00 | $12.00 | |
| Rentals | $15.00 | $15.00 | $15.00 | $15.00 | $15.00 | $15.00 | $15.00 | $15.00 | $15.00 | $15.00 | $15.00 | $15.00 | |
| Paint Balls | $25.00 | $25.00 | $25.00 | $25.00 | $25.00 | $25.00 | $25.00 | $25.00 | $25.00 | $25.00 | $25.00 | $25.00 | |
| Food | $10.00 | $5.00 | $5.00 | $5.00 | $5.00 | $5.00 | $5.00 | $5.00 | $5.00 | $5.00 | $5.00 | $5.00 | |
| Other | $0.00 | $0.00 | $0.00 | $0.00 | $0.00 | $0.00 | $0.00 | $0.00 | $0.00 | $0.00 | $0.00 | $0.00 | |
| Sales | |||||||||||||
| Admission | $0 | $0 | $0 | $12,000 | $12,000 | $18,000 | $21,600 | $24,000 | $19,200 | $16,800 | $14,400 | $12,000 | |
| Rentals | $0 | $0 | $0 | $11,250 | $11,250 | $18,750 | $22,500 | $25,500 | $20,625 | $17,250 | $13,500 | $11,250 | |
| Paint Balls | $0 | $0 | $0 | $50,000 | $50,000 | $75,000 | $95,000 | $100,000 | $75,000 | $62,500 | $55,000 | $50,000 | |
| Food | $0 | $0 | $0 | $2,500 | $2,500 | $3,800 | $3,800 | $4,300 | $4,750 | $4,500 | $3,250 | $3,000 | |
| Other | $0 | $0 | $0 | $0 | $0 | $0 | $0 | $0 | $0 | $0 | $0 | $0 | |
| Total Sales | $0 | $0 | $0 | $75,750 | $75,750 | $115,550 | $142,900 | $153,800 | $119,575 | $101,050 | $86,150 | $76,250 | |
| Direct Unit Costs | Month 1 | Month 2 | Month 3 | Month 4 | Month 5 | Month 6 | Month 7 | Month 8 | Month 9 | Month 10 | Month 11 | Month 12 | |
| Admission | 0.00% | $0.00 | $0.00 | $0.00 | $0.00 | $0.00 | $0.00 | $0.00 | $0.00 | $0.00 | $0.00 | $0.00 | $0.00 |
| Rentals | 0.00% | $0.00 | $0.00 | $0.00 | $1.00 | $1.00 | $1.00 | $1.00 | $1.00 | $1.00 | $1.00 | $1.00 | $1.00 |
| Paint Balls | 0.00% | $0.00 | $0.00 | $0.00 | $3.00 | $3.00 | $3.00 | $3.00 | $3.00 | $3.00 | $3.00 | $3.00 | $3.00 |
| Food | 0.00% | $0.00 | $0.00 | $0.00 | $1.00 | $1.00 | $1.00 | $1.00 | $1.00 | $1.00 | $1.00 | $1.00 | $1.00 |
| Other | 0.00% | $0.00 | $0.00 | $0.00 | $0.00 | $0.00 | $0.00 | $0.00 | $0.00 | $0.00 | $0.00 | $0.00 | $0.00 |
| Direct Cost of Sales | |||||||||||||
| Admission | $0 | $0 | $0 | $0 | $0 | $0 | $0 | $0 | $0 | $0 | $0 | $0 | |
| Rentals | $0 | $0 | $0 | $750 | $750 | $1,250 | $1,500 | $1,700 | $1,375 | $1,150 | $900 | $750 | |
| Paint Balls | $0 | $0 | $0 | $6,000 | $6,000 | $9,000 | $11,400 | $12,000 | $9,000 | $7,500 | $6,600 | $6,000 | |
| Food | $0 | $0 | $0 | $500 | $500 | $760 | $760 | $860 | $950 | $900 | $650 | $600 | |
| Other | $0 | $0 | $0 | $0 | $0 | $0 | $0 | $0 | $0 | $0 | $0 | $0 | |
| Subtotal Direct Cost of Sales | $0 | $0 | $0 | $7,250 | $7,250 | $11,010 | $13,660 | $14,560 | $11,325 | $9,550 | $8,150 | $7,350 | |
| Personnel Plan | |||||||||||||
| Month 1 | Month 2 | Month 3 | Month 4 | Month 5 | Month 6 | Month 7 | Month 8 | Month 9 | Month 10 | Month 11 | Month 12 | ||
| Manager | 0% | $4,500 | $4,500 | $4,500 | $4,500 | $4,500 | $4,500 | $4,500 | $4,500 | $4,500 | $4,500 | $4,500 | $4,500 |
| Accountant | 0% | $0 | $3,500 | $3,500 | $3,500 | $3,500 | $3,500 | $3,500 | $3,500 | $3,500 | $3,500 | $3,500 | $3,500 |
| Assistant Manager | 0% | $0 | $0 | $3,500 | $3,500 | $3,500 | $3,500 | $3,500 | $3,500 | $3,500 | $3,500 | $3,500 | $3,500 |
| Facility Maintenance | 0% | $3,000 | $3,000 | $3,000 | $3,000 | $3,000 | $3,000 | $3,000 | $3,000 | $3,000 | $3,000 | $3,000 | $3,000 |
| Counter Staff | 0% | $0 | $0 | $3,500 | $3,500 | $3,500 | $3,500 | $3,500 | $3,500 | $3,500 | $3,500 | $3,500 | $3,500 |
| Concession Person | 0% | $0 | $0 | $2,500 | $2,500 | $2,500 | $2,500 | $2,500 | $2,500 | $2,500 | $2,500 | $2,500 | $2,500 |
| Referee/Safety Inspectors | 0% | $0 | $0 | $7,000 | $7,000 | $7,000 | $7,000 | $7,000 | $7,000 | $7,000 | $7,000 | $7,000 | $7,000 |
| Total People | 0 | 0 | 0 | 0 | 0 | 0 | 0 | 0 | 0 | 0 | 0 | 0 | |
| Total Payroll | $7,500 | $11,000 | $27,500 | $27,500 | $27,500 | $27,500 | $27,500 | $27,500 | $27,500 | $27,500 | $27,500 | $27,500 | |
| General Assumptions | |||||||||||||
| Month 1 | Month 2 | Month 3 | Month 4 | Month 5 | Month 6 | Month 7 | Month 8 | Month 9 | Month 10 | Month 11 | Month 12 | ||
| Plan Month | 1 | 2 | 3 | 4 | 5 | 6 | 7 | 8 | 9 | 10 | 11 | 12 | |
| Current Interest Rate | 10.00% | 10.00% | 10.00% | 10.00% | 10.00% | 10.00% | 10.00% | 10.00% | 10.00% | 10.00% | 10.00% | 10.00% | |
| Long-term Interest Rate | 10.00% | 10.00% | 10.00% | 10.00% | 10.00% | 10.00% | 10.00% | 10.00% | 10.00% | 10.00% | 10.00% | 10.00% | |
| Tax Rate | 30.00% | 30.00% | 30.00% | 30.00% | 30.00% | 30.00% | 30.00% | 30.00% | 30.00% | 30.00% | 30.00% | 30.00% | |
| Other | 0 | 0 | 0 | 0 | 0 | 0 | 0 | 0 | 0 | 0 | 0 | 0 | |
| Pro Forma Profit and Loss | |||||||||||||
| Month 1 | Month 2 | Month 3 | Month 4 | Month 5 | Month 6 | Month 7 | Month 8 | Month 9 | Month 10 | Month 11 | Month 12 | ||
| Sales | $0 | $0 | $0 | $75,750 | $75,750 | $115,550 | $142,900 | $153,800 | $119,575 | $101,050 | $86,150 | $76,250 | |
| Direct Cost of Sales | $0 | $0 | $0 | $7,250 | $7,250 | $11,010 | $13,660 | $14,560 | $11,325 | $9,550 | $8,150 | $7,350 | |
| Other Production Expenses | $0 | $0 | $0 | $0 | $0 | $0 | $0 | $0 | $0 | $0 | $0 | $0 | |
| Total Cost of Sales | $0 | $0 | $0 | $7,250 | $7,250 | $11,010 | $13,660 | $14,560 | $11,325 | $9,550 | $8,150 | $7,350 | |
| Gross Margin | $0 | $0 | $0 | $68,500 | $68,500 | $104,540 | $129,240 | $139,240 | $108,250 | $91,500 | $78,000 | $68,900 | |
| Gross Margin % | 0.00% | 0.00% | 0.00% | 90.43% | 90.43% | 90.47% | 90.44% | 90.53% | 90.53% | 90.55% | 90.54% | 90.36% | |
| Expenses | |||||||||||||
| Payroll | $7,500 | $11,000 | $27,500 | $27,500 | $27,500 | $27,500 | $27,500 | $27,500 | $27,500 | $27,500 | $27,500 | $27,500 | |
| Sales and Marketing and Other Expenses | $0 | $0 | $20,000 | $50,000 | $50,000 | $45,000 | $45,000 | $45,000 | $45,000 | $23,000 | $22,000 | $21,000 | |
| Depreciation | $0 | $0 | $600 | $600 | $600 | $600 | $600 | $600 | $600 | $600 | $600 | $600 | |
| Leased Equipment | $0 | $0 | $0 | $0 | $0 | $0 | $0 | $0 | $0 | $0 | $0 | $0 | |
| Utilities | $0 | $1,000 | $1,000 | $1,800 | $1,800 | $1,800 | $1,800 | $1,800 | $1,800 | $1,800 | $1,800 | $1,800 | |
| Insurance | $1,000 | $1,000 | $1,000 | $1,000 | $1,000 | $1,000 | $1,000 | $1,000 | $1,000 | $1,000 | $1,000 | $1,000 | |
| Rent | $6,000 | $6,000 | $6,000 | $6,000 | $6,000 | $6,000 | $6,000 | $6,000 | $6,000 | $6,000 | $6,000 | $6,000 | |
| Payroll Taxes | 15% | $1,125 | $1,650 | $4,125 | $4,125 | $4,125 | $4,125 | $4,125 | $4,125 | $4,125 | $4,125 | $4,125 | $4,125 |
| Other | $0 | $0 | $0 | $0 | $0 | $0 | $0 | $0 | $0 | $0 | $0 | $0 | |
| Total Operating Expenses | $15,625 | $20,650 | $60,225 | $91,025 | $91,025 | $86,025 | $86,025 | $86,025 | $86,025 | $64,025 | $63,025 | $62,025 | |
| Profit Before Interest and Taxes | ($15,625) | ($20,650) | ($60,225) | ($22,525) | ($22,525) | $18,515 | $43,215 | $53,215 | $22,225 | $27,475 | $14,975 | $6,875 | |
| EBITDA | ($15,625) | ($20,650) | ($59,625) | ($21,925) | ($21,925) | $19,115 | $43,815 | $53,815 | $22,825 | $28,075 | $15,575 | $7,475 | |
| Interest Expense | $1,237 | $1,224 | $1,211 | $1,198 | $1,185 | $1,172 | $1,159 | $1,146 | $1,133 | $1,120 | $1,107 | $1,094 | |
| Taxes Incurred | ($5,059) | ($6,562) | ($18,431) | ($7,117) | ($7,113) | $5,203 | $12,617 | $15,621 | $6,328 | $7,907 | $4,160 | $1,734 | |
| Net Profit | ($11,803) | ($15,312) | ($43,005) | ($16,606) | ($16,597) | $12,140 | $29,439 | $36,448 | $14,765 | $18,449 | $9,708 | $4,047 | |
| Net Profit/Sales | 0.00% | 0.00% | 0.00% | -21.92% | -21.91% | 10.51% | 20.60% | 23.70% | 12.35% | 18.26% | 11.27% | 5.31% | |
| Pro Forma Cash Flow | |||||||||||||
| Month 1 | Month 2 | Month 3 | Month 4 | Month 5 | Month 6 | Month 7 | Month 8 | Month 9 | Month 10 | Month 11 | Month 12 | ||
| Cash Received | |||||||||||||
| Cash from Operations | |||||||||||||
| Cash Sales | $0 | $0 | $0 | $75,750 | $75,750 | $115,550 | $142,900 | $153,800 | $119,575 | $101,050 | $86,150 | $76,250 | |
| Subtotal Cash from Operations | $0 | $0 | $0 | $75,750 | $75,750 | $115,550 | $142,900 | $153,800 | $119,575 | $101,050 | $86,150 | $76,250 | |
| Additional Cash Received | |||||||||||||
| Sales Tax, VAT, HST/GST Received | 0.00% | $0 | $0 | $0 | $0 | $0 | $0 | $0 | $0 | $0 | $0 | $0 | $0 |
| New Current Borrowing | $0 | $0 | $0 | $0 | $0 | $0 | $0 | $0 | $0 | $0 | $0 | $0 | |
| New Other Liabilities (interest-free) | $0 | $0 | $0 | $0 | $0 | $0 | $0 | $0 | $0 | $0 | $0 | $0 | |
| New Long-term Liabilities | $0 | $0 | $0 | $0 | $0 | $0 | $0 | $0 | $0 | $0 | $0 | $0 | |
| Sales of Other Current Assets | $0 | $0 | $0 | $0 | $0 | $0 | $0 | $0 | $0 | $0 | $0 | $0 | |
| Sales of Long-term Assets | $0 | $0 | $0 | $0 | $0 | $0 | $0 | $0 | $0 | $0 | $0 | $0 | |
| New Investment Received | $0 | $0 | $0 | $0 | $0 | $0 | $0 | $0 | $0 | $0 | $0 | $0 | |
| Subtotal Cash Received | $0 | $0 | $0 | $75,750 | $75,750 | $115,550 | $142,900 | $153,800 | $119,575 | $101,050 | $86,150 | $76,250 | |
| Expenditures | Month 1 | Month 2 | Month 3 | Month 4 | Month 5 | Month 6 | Month 7 | Month 8 | Month 9 | Month 10 | Month 11 | Month 12 | |
| Expenditures from Operations | |||||||||||||
| Cash Spending | $7,500 | $11,000 | $27,500 | $27,500 | $27,500 | $27,500 | $27,500 | $27,500 | $27,500 | $27,500 | $27,500 | $27,500 | |
| Bill Payments | $143 | $4,304 | $4,665 | $16,516 | $63,265 | $64,754 | $79,740 | $88,341 | $89,672 | $72,465 | $52,357 | $46,683 | |
| Subtotal Spent on Operations | $7,643 | $15,304 | $32,165 | $44,016 | $90,765 | $92,254 | $107,240 | $115,841 | $117,172 | $99,965 | $79,857 | $74,183 | |
| Additional Cash Spent | |||||||||||||
| Sales Tax, VAT, HST/GST Paid Out | $0 | $0 | $0 | $0 | $0 | $0 | $0 | $0 | $0 | $0 | $0 | $0 | |
| Principal Repayment of Current Borrowing | $0 | $0 | $0 | $0 | $0 | $0 | $0 | $0 | $0 | $0 | $0 | $0 | |
| Other Liabilities Principal Repayment | $0 | $0 | $0 | $0 | $0 | $0 | $0 | $0 | $0 | $0 | $0 | $0 | |
| Long-term Liabilities Principal Repayment | $1,563 | $1,563 | $1,563 | $1,563 | $1,563 | $1,563 | $1,563 | $1,563 | $1,563 | $1,563 | $1,563 | $1,563 | |
| Purchase Other Current Assets | $0 | $0 | $0 | $0 | $0 | $0 | $0 | $0 | $0 | $0 | $0 | $0 | |
| Purchase Long-term Assets | $0 | $0 | $0 | $0 | $0 | $0 | $0 | $0 | $0 | $0 | $0 | $0 | |
| Dividends | $0 | $0 | $0 | $0 | $0 | $0 | $0 | $0 | $0 | $0 | $0 | $0 | |
| Subtotal Cash Spent | $9,206 | $16,866 | $33,727 | $45,579 | $92,327 | $93,816 | $108,803 | $117,404 | $118,734 | $101,528 | $81,420 | $75,745 | |
| Net Cash Flow | ($9,206) | ($16,866) | ($33,727) | $30,171 | ($16,577) | $21,734 | $34,097 | $36,396 | $841 | ($478) | $4,730 | $505 | |
| Cash Balance | $159,594 | $142,728 | $109,001 | $139,172 | $122,595 | $144,329 | $178,426 | $214,822 | $215,663 | $215,185 | $219,915 | $220,420 | |
| Pro Forma Balance Sheet | |||||||||||||
| Month 1 | Month 2 | Month 3 | Month 4 | Month 5 | Month 6 | Month 7 | Month 8 | Month 9 | Month 10 | Month 11 | Month 12 | ||
| Assets | Starting Balances | ||||||||||||
| Current Assets | |||||||||||||
| Cash | $168,800 | $159,594 | $142,728 | $109,001 | $139,172 | $122,595 | $144,329 | $178,426 | $214,822 | $215,663 | $215,185 | $219,915 | $220,420 |
| Inventory | $9,000 | $9,000 | $9,000 | $9,000 | $7,975 | $7,975 | $12,111 | $15,026 | $16,016 | $12,458 | $10,505 | $8,965 | $8,085 |
| Other Current Assets | $15,000 | $15,000 | $15,000 | $15,000 | $15,000 | $15,000 | $15,000 | $15,000 | $15,000 | $15,000 | $15,000 | $15,000 | $15,000 |
| Total Current Assets | $192,800 | $183,594 | $166,728 | $133,001 | $162,147 | $145,570 | $171,440 | $208,452 | $245,838 | $243,120 | $240,690 | $243,880 | $243,505 |
| Long-term Assets | |||||||||||||
| Long-term Assets | $128,000 | $128,000 | $128,000 | $128,000 | $128,000 | $128,000 | $128,000 | $128,000 | $128,000 | $128,000 | $128,000 | $128,000 | $128,000 |
| Accumulated Depreciation | $0 | $0 | $0 | $600 | $1,200 | $1,800 | $2,400 | $3,000 | $3,600 | $4,200 | $4,800 | $5,400 | $6,000 |
| Total Long-term Assets | $128,000 | $128,000 | $128,000 | $127,400 | $126,800 | $126,200 | $125,600 | $125,000 | $124,400 | $123,800 | $123,200 | $122,600 | $122,000 |
| Total Assets | $320,800 | $311,594 | $294,728 | $260,401 | $288,947 | $271,770 | $297,040 | $333,452 | $370,238 | $366,920 | $363,890 | $366,480 | $365,505 |
| Liabilities and Capital | Month 1 | Month 2 | Month 3 | Month 4 | Month 5 | Month 6 | Month 7 | Month 8 | Month 9 | Month 10 | Month 11 | Month 12 | |
| Current Liabilities | |||||||||||||
| Accounts Payable | $0 | $4,160 | $4,168 | $14,408 | $61,123 | $62,105 | $76,798 | $85,333 | $87,234 | $70,714 | $50,797 | $45,242 | $41,782 |
| Current Borrowing | $0 | $0 | $0 | $0 | $0 | $0 | $0 | $0 | $0 | $0 | $0 | $0 | $0 |
| Other Current Liabilities | $0 | $0 | $0 | $0 | $0 | $0 | $0 | $0 | $0 | $0 | $0 | $0 | $0 |
| Subtotal Current Liabilities | $0 | $4,160 | $4,168 | $14,408 | $61,123 | $62,105 | $76,798 | $85,333 | $87,234 | $70,714 | $50,797 | $45,242 | $41,782 |
| Long-term Liabilities | $150,000 | $148,438 | $146,875 | $145,313 | $143,750 | $142,188 | $140,625 | $139,063 | $137,500 | $135,938 | $134,375 | $132,813 | $131,250 |
| Total Liabilities | $150,000 | $152,597 | $151,043 | $159,721 | $204,873 | $204,293 | $217,423 | $224,396 | $224,734 | $206,651 | $185,172 | $178,055 | $173,032 |
| Paid-in Capital | $250,000 | $250,000 | $250,000 | $250,000 | $250,000 | $250,000 | $250,000 | $250,000 | $250,000 | $250,000 | $250,000 | $250,000 | $250,000 |
| Retained Earnings | ($79,200) | ($79,200) | ($79,200) | ($79,200) | ($79,200) | ($79,200) | ($79,200) | ($79,200) | ($79,200) | ($79,200) | ($79,200) | ($79,200) | ($79,200) |
| Earnings | $0 | ($11,803) | ($27,115) | ($70,120) | ($86,726) | ($103,323) | ($91,183) | ($61,744) | ($25,295) | ($10,531) | $7,918 | $17,626 | $21,672 |
| Total Capital | $170,800 | $158,997 | $143,685 | $100,680 | $84,074 | $67,477 | $79,617 | $109,056 | $145,505 | $160,269 | $178,718 | $188,426 | $192,472 |
| Total Liabilities and Capital | $320,800 | $311,594 | $294,728 | $260,401 | $288,947 | $271,770 | $297,040 | $333,452 | $370,238 | $366,920 | $363,890 | $366,480 | $365,505 |
| Net Worth | $170,800 | $158,997 | $143,685 | $100,680 | $84,074 | $67,477 | $79,617 | $109,056 | $145,505 | $160,269 | $178,718 | $188,426 | $192,472 |


