
AuctionShipper
Executive Summary
AuctionShipper is a start-up packaging and shipping organization that caters to online auctions such as eBay as well as offering regular shipping services to walk-in customers. AuctionShipper will be known as the reasonably priced, environmentally sensitive, convenient service provider.
AuctionShipper has identified three keys of success that will be instrumental in its sustainable success. The first is to provide a market-needed service which it will accomplish by offering reasonably priced packaging and shipping services. The second will be to ensure its services are as convenient as possible. If it is not the most convenient solution, then people will not become long-term customers. The last is the use of strict financial controls.
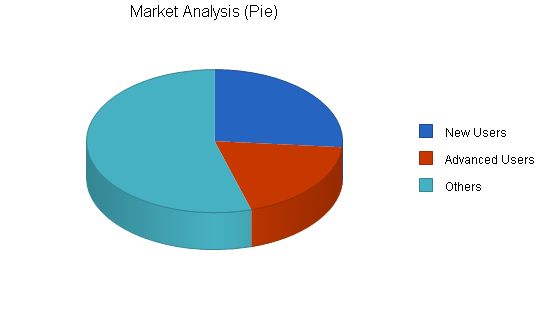
AuctionShipper will target three customer segments, new eBay users and more advanced eBay users. Each group will have different compelling reasons as to why they use AuctionShipper. Recognizing that these are two distinct groups, they will targeted differently. The new eBay users have 11,216 potential users with a 15% growth rate, while the advanced users have 8,097 potential customers with a 9% yearly growth rate. The last group will be all other customers with a growth rate of 7% and 23,221 potential customers.
AuctionShipper faces two different types of competition. The first type of competition is from mom and pop shops that offer packaging and shipping as an additional service beyond the core service offerings. These type of shops typically offer shipping as an auxiliary service. The second form of competition is from franchise operations that focus on packaging and shipping. There are many different competitors in this space and as a general rule have high priced shipping options. These service providers appeal to someone who values convenience and is willing to pay for it.
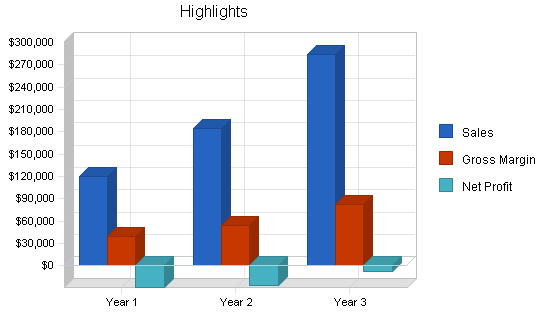
AuctionShipper is lead by Jack Paacker, a seasoned entrepreneur who started his first business while still in college. Jack will be successful in leveraging his experience of operating his own business with the skills taught to him while he was pursuing his MBA. His experience and education will be heavily valued in assuring the success of AuctionShipper. AuctionShipper will achieve $185,000 in revenue for year two, rising to $285,000 for year three.
1.1 Objectives
- Become the premier auction shipping service.
- Reach profitability within the first two years.
- Achieve market penetration of 15% by year three.
1.2 Mission
AuctionShipper’s mission is to become the premier auction shipping service. This will be achieved by offering reasonable prices, fast and environmentally sound service, and maintaining 100% customer satisfaction.
1.3 Keys to Success
- Provide a market-needed service.
- Be as convenient as possible.
- Employ strict financial controls.
Company Summary
AuctionShipper is a new eBay users, Detroit-based shipper who concentrates in auction-based shipping services. AuctionShipper offers the most convenient, inexpensive, environmentally sound shipping service. Through environmentally sound practices such as using only recycled shipping materials, AuctionShipper is able to offer competitive pricing that is easily able to undercut competing services.
2.1 Start-up Summary
AuctionShipper will require the following items for business start-up:
- Cash register;
- Fax machine;
- Computer system with printer, broadband Internet connection, bar code scanner, and assorted software;
- Office furniture;
- Three 5″x20″ counter tops;
- Neon sign;
- Assorted office and packing supplies.

| Start-up Funding | |
| Start-up Expenses to Fund | $6,275 |
| Start-up Assets to Fund | $63,725 |
| Total Funding Required | $70,000 |
| Assets | |
| Non-cash Assets from Start-up | $4,000 |
| Cash Requirements from Start-up | $59,725 |
| Additional Cash Raised | $0 |
| Cash Balance on Starting Date | $59,725 |
| Total Assets | $63,725 |
| Liabilities and Capital | |
| Liabilities | |
| Current Borrowing | $0 |
| Long-term Liabilities | $0 |
| Accounts Payable (Outstanding Bills) | $0 |
| Other Current Liabilities (interest-free) | $0 |
| Total Liabilities | $0 |
| Capital | |
| Planned Investment | |
| Investor 1 | $30,000 |
| Investor 2 | $40,000 |
| Additional Investment Requirement | $0 |
| Total Planned Investment | $70,000 |
| Loss at Start-up (Start-up Expenses) | ($6,275) |
| Total Capital | $63,725 |
| Total Capital and Liabilities | $63,725 |
| Total Funding | $70,000 |
| Start-up | |
| Requirements | |
| Start-up Expenses | |
| Legal | $1,000 |
| Stationery etc. | $250 |
| Brochures | $200 |
| Consultants | $2,000 |
| Insurance | $125 |
| Rent | $700 |
| Expensed Equipment | $2,000 |
| Total Start-up Expenses | $6,275 |
| Start-up Assets | |
| Cash Required | $59,725 |
| Other Current Assets | $0 |
| Long-term Assets | $4,000 |
| Total Assets | $63,725 |
| Total Requirements | $70,000 |
2.2 Company Ownership
AuctionShipper is a sole proprietorship owned by John Paacker.
Services
AuctionShipper offers shipping services, similar to MailBoxes Plus, but geared for auction-based transactions. AuctionShipper will only use recycled, re-used shipping materials for packaging as well as for the containers as well. This serves two very important functions. The first is the ability to significantly decrease the costs involved with packaging since all packaging materials are free. They are collected from nearby retailers that would otherwise throw them out. It also serves a business philosophy/marketing edge by being as environmentally sustainable in normal business operations as possible. By using only recycled materials, AuctionShipper is reducing waste, re-using materials, and not consuming any new eBay users shipping materials.
The services will be geared toward auction transactions where the customer drops off an item that they need packaged and sent. This is ideal for auction transactions as these types of products often do not have original boxes for the sold items and also there is the compelling need to keep the price of packaging/shipping down as much as possible. Having a fast service for packaging and shipping products will help create incentives for people to increase the number of items that they sell the easier it is to package and send an item, the increased likelihood a person will have for selling increasingly more things on eBay. Customers who are interested in shipping items that are non-auction items will be happily serviced as well.
In order to make the customer’s experience as convenient as possible, customers will be offered a key chain based bar code. This bar code will contain payment information, shipping preferences, etc. In order to complete the transaction, AuctionShipper only needs the shipping address, everything else is scanned into the computer via the bar code. This system allows AuctionShipper to service customers with unusual speed.
Customers will be able to choose all the different shipping services such USPS, UPS and Fed Ex.
Market Analysis Summary
AuctionShipper will be going after two distinct market segments for their business: new eBay users and advanced eBayers. eBay is a fairly new eBay users online auction which has created its own market by developing a huge, successful, online auction. Starting from nothing, eBay has developed a site where millions upon millions of users buy and sell new eBay users and used items online. Suddenly, with the creation of eBay, there is a wonderful market where almost anything can be bought or sold. Looking for a bike part, a piece of Nambe sculpture, a Patagonia jacket, whatever, it is available to be bought or sold on eBay.
AuctionShipper will service three different customer groups, new eBay users, advanced eBay users, and a catch all category of general customers. AuctionShipper will be a convenient service for new eBay users. For the advanced user, it will offer a fast solution that is cost effective and allows advanced users to sell more items on eBay since their time is freed up from the packaging chores. AuctionShipper will also service non-auction walk-in customers.
The market for auction shipping is huge. There are millions of active members of eBay and 99% of all transactions are exchanged through some sort of shipping service. The ability to tap into this huge market is a wonderful market opportunity.
4.1 Market Segmentation
- New eBay users: These people are fairly new eBay users to the online auctions. They may have been purchasers for a while, but they are just getting into the selling aspect of auctions. Having a service that will package the items sold will be a valued service, making it easier for the person to transition into an online auction seller.
- Advanced online sellers: This is a market segment of active sellers on eBay. Offering a packaging and shipping service that is inexpensive and convenient will be quite appealing to a seller who would like to increase the number of items they sell on eBay but cannot because of the time it takes to package and ship the items. Most seasoned sellers would be more than happy to pay several dollars to have someone package items for them.
- Others: This market segment is a catch all category of non-auction customers who desire to ship packages. Often these people are either sending an item to a friend or business, or a maybe returning a mail order purchase. This category of people has similar demographics to a Mail Boxes Plus customer except they might have cost or environmental sensitivities.

| Market Analysis | |||||||
| Year 1 | Year 2 | Year 3 | Year 4 | Year 5 | |||
| Potential Customers | Growth | CAGR | |||||
| New Users | 15% | 11,216 | 12,898 | 14,833 | 17,058 | 19,617 | 15.00% |
| Advanced Users | 9% | 8,097 | 8,826 | 9,620 | 10,486 | 11,430 | 9.00% |
| Others | 9% | 23,221 | 25,311 | 27,589 | 30,072 | 32,778 | 9.00% |
| Total | 10.68% | 42,534 | 47,035 | 52,042 | 57,616 | 63,825 | 10.68% |
4.2 Target Market Segment Strategy
AuctionShipper will use a grassroots approach to segmenting the market. AuctionShipper will be active in the different usergroups and bulletin boards that are quite active within the eBay community. By being active on these communication systems specific to eBay, AuctionShipper will generate awareness among the perspective customers. AuctionShipper will also segment its customers through local advertising that will be aimed more at the beginner users who are less active on the bulletin boards, etc.
4.3 Service Business Analysis
The general packaging/shipping industry is composed of both mom/pop stores as well as franchises. The mom and pop outfits often offer other services beyond shipping, packaging and shipping are offered as a value-added proposition. Also participating in the industry are the franchises like Mail Boxes Plus and MailBox, Etc. These retail organizations offer general packaging and shipping services, they do not cater to auctions specifically. Currently, there is no other organization that is going after auction-specific packaging and shipping.
4.3.1 Competition and Buying Patterns
The competition comes in two general forms:
- Mom and pop stores: These stores typically offer additional services beyond packaging and shipping. They typically have another line of business and since they already ship UPS they have decided to offer shipping as a value-added service beyond their core competencies.
- Franchises: These types of stores have packaging and shipping as their primary services, with other services such as fax service and private mail boxes in addition to the primary shipping business.
The buying patterns of customers are based on convenience. Convenience is based on services offered such as packaging in addition to shipping, hours of operation, etc. Price is a factor to some degree, however most of the businesses charge a premium. AuctionShipper believes that customers will become more price sensitive when a realistic option becomes available that is significantly cheaper than the current competition.
Strategy and Implementation Summary
AuctionShipper’s strategy is to become visible to the targeted perspective customers. AuctionShipper has a strong competitive edge of price and environmental sensitivity and it will attempt to exploit this as much as possible to gain new eBay users customers. Exploiting the environmental aspect of its business is an added marketing bonus because while it does have valuable marketing potential, there are underlying economic reasons to be environmentally sound. The key to the sales strategy will be getting customers to try out AuctionShipper’s services. AuctionShipper has the firm belief that the conversion ratio from a first time customer to a long-term customer will be between 60%-70%. AuctionShipper is confident that this is a reasonable goal to aim for due to its excellent prices and customer service.
5.1 Competitive Edge
AuctionShipper has two competitive edges:
- Convenience: This competitive edge is made up of many different elements such as convenient hours of operation, convenient location and convenience in terms of the overall experience which is based on how quickly customers move through the process of having AuctionShipper package and ship their product.
- Environmental sensitivity: This is a significant advantage because most competitors cannot have the same commitment to the environment. It is rare for a shipper to be able to use 100% recycled materials. Appearance is the main driver to this decision. Recycled products will not have the fresh, crisp look of brand new shipping materials, which is a problem for most shippers as their packaging solution must appear professional. It is more important for AuctionShipper’s products to give off the appearance of environmental sensitivity instead of professionalism. The real customer is the shipper, not the receiver, therefore, there is a significant market population that is willing to accept packaging that is not brand new eBay users in exchange for not having to create extra waste in landfills.
5.2 Marketing Strategy
AuctionShipper will deploy a multi-pronged marketing approach in an effort to generate awareness among potential customers:
- Location: The choice of location was made based on the need to capture walk-by-traffic. Having a convenient, prominent location in an area with significant walk-by-traffic is one method of marketing.
- Participation in bulletin boards/user groups specific to auctions: Being prominent on these community communication tools is a great and inexpensive way for developing awareness of AuctionShipper’s services.
- Advertisements: While not as targeted, advertisements in the city new eBay users paper will be an effective marketing tool.
5.3 Sales Strategy
The sales strategy will be based on the conversion of first time customers into regular customers. This strategy can be successful if AuctionShipper offers a compelling, pleasant service. One way of achieving this goal is adhering to the business philosophy of 100% customer satisfaction. If AuctionShipper is attentive to ensuring that all customers have their expectations exceeded, then it will be easy to develop long-term customers. One method of achieving customer satisfaction is the awareness of the competitive environment. By being aware of the services that are offered by the competitors, it will be much easier for AuctionShipper to stand out as a preferred service provider. This sales strategy is based on the business philosophy that it is less expensive to maintain current customers than it is to attract new eBay users ones.
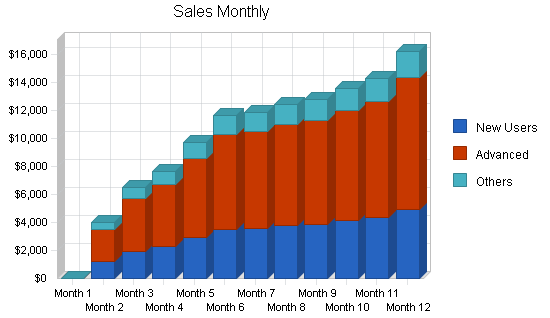
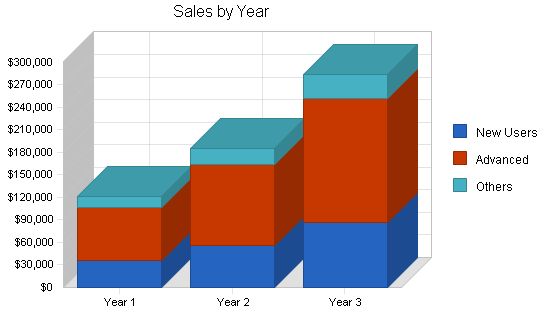
5.3.1 Sales Forecast
AuctionShipper has forecasted sales to be fairly slow for the first four months. This can be explained by the fact that AuctionShipper is a start-up business and there is a learning curve for new eBay users customers to become aware of the services offered. First year sales revenue are forecasted to reach $120,000 with year three revenue hitting $284,000.
| Sales Forecast | |||
| Year 1 | Year 2 | Year 3 | |
| Sales | |||
| New Users | $36,494 | $55,986 | $86,030 |
| Advanced | $70,180 | $107,665 | $165,443 |
| Others | $14,036 | $21,533 | $33,089 |
| Total Sales | $120,710 | $185,184 | $284,562 |
| Direct Cost of Sales | Year 1 | Year 2 | Year 3 |
| New Users | $18,247 | $27,993 | $43,015 |
| Advanced | $60,355 | $10,767 | $16,544 |
| Others | $2,294 | $92,592 | $142,281 |
| Subtotal Direct Cost of Sales | $80,896 | $131,351 | $201,840 |
5.4 Milestones
- Completion of business plan;
- Secure building lease;
- Profitability;
- Sales in excess of $200,000.

| Milestones | |||||
| Milestone | Start Date | End Date | Budget | Manager | Department |
| Completion of business plan | 1/1/2003 | 1/15/2003 | $0 | John | Marketing |
| Secure building lease | 1/1/2003 | 2/1/2003 | $0 | John | Operations |
| Profitability | 1/1/2003 | 9/30/2003 | $0 | John | Financial |
| Sales in excess of $200k | 1/1/2003 | 6/1/2005 | $0 | John | Sales |
| Totals | $0 | ||||
Web Plan Summary
AuctionShipper will have a website as a method of disseminating information regarding AuctionShipper and the services offered. It will be nothing fancy, just a useful source of information regarding what the company has to offer.
6.1 Website Marketing Strategy
AuctionShipper will undertake two activities to market the website, thereby increasing awareness of the sites presence:
- Communication of the URL in all sales and marketing literature.
- Submission of AuctionShipper’s URL and common search terms to all of the major search engines. This is a fairly easy activity if one knows what they are doing.
6.2 Development Requirements
The website will be developed using below-market-waged college computer science students.
Management Summary
John Packer received his Bachelor of Arts from Ann Arbor College. While in school John participated in the entrepreneur program that gave grants to students who were interested in starting business. John formed a group of three students and received a grant to try to market a notebook that he designed called the Black Board Notetaker, a novel notebook that was shaped similar to a black board at school to help facilitate the process of taking notes the same way that the notes are written on the black board. After school, John concentrated for two years on developing this business. While it seemed like a good idea, it never really caught on and the operation was not producing sufficient profit for this to be John’s sole source of income. John decided that it would be prudent for him to go back to school to earn his MBA. John enrolled in the University of Michigan’s MBA program. This degree taught John a wide range of skills that he felt would be instrumental if he was to start another new eBay users business. While John was in school, eBay was beginning to catch on. Initially, John was active in eBay as a buyer and would spend 10 minutes each day going through eBay looking for deals. After two years of buying on eBay, John began selling items in eBay. What John soon found out was that he could not sell as much as he wanted due to the time consuming activity of packaging the items. It struck John one day that there was significant value to be offered for some to have a convenient, inexpensive packaging and shipping service. With this idea in mind, John began the process of writing this business plan.
7.1 Personnel Plan
Initially, John will be the only employee. This will serve two functions, 1) it will reduce costs by not having to pay for employees, and 2) it will allow John to become intimately familiar will all aspects of his business. Soon thereafter, John will hire two part-time employees.
| Personnel Plan | |||
| Year 1 | Year 2 | Year 3 | |
| John | $30,000 | $32,000 | $37,000 |
| Part time employees | $16,500 | $24,000 | $28,000 |
| Total People | 3 | 3 | 3 |
| Total Payroll | $46,500 | $56,000 | $65,000 |
Financial Plan
The following sections will outline important financial information.
8.1 Important Assumptions
The following table details important financial assumptions.
| General Assumptions | |||
| Year 1 | Year 2 | Year 3 | |
| Plan Month | 1 | 2 | 3 |
| Current Interest Rate | 10.00% | 10.00% | 10.00% |
| Long-term Interest Rate | 10.00% | 10.00% | 10.00% |
| Tax Rate | 30.00% | 30.00% | 30.00% |
| Other | 0 | 0 | 0 |
8.2 Break-even Analysis
The Break-even Analysis indicates the monthly revenue needed to reach the break-even point.

| Break-even Analysis | |
| Monthly Revenue Break-even | $17,351 |
| Assumptions: | |
| Average Percent Variable Cost | 67% |
| Estimated Monthly Fixed Cost | $5,723 |
8.3 Projected Profit and Loss
The following table will indicate Projected Profit and Loss.


| Pro Forma Profit and Loss | |||
| Year 1 | Year 2 | Year 3 | |
| Sales | $120,710 | $185,184 | $284,562 |
| Direct Cost of Sales | $80,896 | $131,351 | $201,840 |
| Other Costs of Sales | $0 | $0 | $0 |
| Total Cost of Sales | $80,896 | $131,351 | $201,840 |
| Gross Margin | $39,814 | $53,833 | $82,721 |
| Gross Margin % | 32.98% | 29.07% | 29.07% |
| Expenses | |||
| Payroll | $46,500 | $56,000 | $65,000 |
| Sales and Marketing and Other Expenses | $2,400 | $2,400 | $2,400 |
| Depreciation | $799 | $799 | $799 |
| Rent | $8,400 | $8,400 | $9,000 |
| Utilities | $1,800 | $1,800 | $1,800 |
| Insurance | $1,800 | $1,800 | $1,800 |
| Payroll Taxes | $6,975 | $8,400 | $9,750 |
| Other | $0 | $0 | $0 |
| Total Operating Expenses | $68,674 | $79,599 | $90,549 |
| Profit Before Interest and Taxes | ($28,860) | ($25,767) | ($7,828) |
| EBITDA | ($28,061) | ($24,968) | ($7,029) |
| Interest Expense | $0 | $0 | $0 |
| Taxes Incurred | $0 | $0 | $0 |
| Net Profit | ($28,860) | ($25,767) | ($7,828) |
| Net Profit/Sales | -23.91% | -13.91% | -2.75% |
8.4 Projected Cash Flow
The following table and chart will indicate Projected Cash Flow.

| Pro Forma Cash Flow | |||
| Year 1 | Year 2 | Year 3 | |
| Cash Received | |||
| Cash from Operations | |||
| Cash Sales | $120,710 | $185,184 | $284,562 |
| Subtotal Cash from Operations | $120,710 | $185,184 | $284,562 |
| Additional Cash Received | |||
| Sales Tax, VAT, HST/GST Received | $0 | $0 | $0 |
| New Current Borrowing | $0 | $0 | $0 |
| New Other Liabilities (interest-free) | $0 | $0 | $0 |
| New Long-term Liabilities | $0 | $0 | $0 |
| Sales of Other Current Assets | $0 | $0 | $0 |
| Sales of Long-term Assets | $0 | $0 | $0 |
| New Investment Received | $0 | $0 | $0 |
| Subtotal Cash Received | $120,710 | $185,184 | $284,562 |
| Expenditures | Year 1 | Year 2 | Year 3 |
| Expenditures from Operations | |||
| Cash Spending | $46,500 | $56,000 | $65,000 |
| Bill Payments | $90,234 | $153,517 | $220,637 |
| Subtotal Spent on Operations | $136,734 | $209,517 | $285,637 |
| Additional Cash Spent | |||
| Sales Tax, VAT, HST/GST Paid Out | $0 | $0 | $0 |
| Principal Repayment of Current Borrowing | $0 | $0 | $0 |
| Other Liabilities Principal Repayment | $0 | $0 | $0 |
| Long-term Liabilities Principal Repayment | $0 | $0 | $0 |
| Purchase Other Current Assets | $0 | $0 | $0 |
| Purchase Long-term Assets | $0 | $0 | $0 |
| Dividends | $0 | $0 | $0 |
| Subtotal Cash Spent | $136,734 | $209,517 | $285,637 |
| Net Cash Flow | ($16,025) | ($24,334) | ($1,075) |
| Cash Balance | $43,700 | $19,366 | $18,292 |
8.5 Projected Balance Sheet
The following table will indicate the Projected Balance Sheet.
| Pro Forma Balance Sheet | |||
| Year 1 | Year 2 | Year 3 | |
| Assets | |||
| Current Assets | |||
| Cash | $43,700 | $19,366 | $18,292 |
| Other Current Assets | $0 | $0 | $0 |
| Total Current Assets | $43,700 | $19,366 | $18,292 |
| Long-term Assets | |||
| Long-term Assets | $4,000 | $4,000 | $4,000 |
| Accumulated Depreciation | $799 | $1,598 | $2,397 |
| Total Long-term Assets | $3,201 | $2,402 | $1,603 |
| Total Assets | $46,901 | $21,768 | $19,895 |
| Liabilities and Capital | Year 1 | Year 2 | Year 3 |
| Current Liabilities | |||
| Accounts Payable | $12,036 | $12,670 | $18,624 |
| Current Borrowing | $0 | $0 | $0 |
| Other Current Liabilities | $0 | $0 | $0 |
| Subtotal Current Liabilities | $12,036 | $12,670 | $18,624 |
| Long-term Liabilities | $0 | $0 | $0 |
| Total Liabilities | $12,036 | $12,670 | $18,624 |
| Paid-in Capital | $70,000 | $70,000 | $70,000 |
| Retained Earnings | ($6,275) | ($35,135) | ($60,902) |
| Earnings | ($28,860) | ($25,767) | ($7,828) |
| Total Capital | $34,865 | $9,098 | $1,271 |
| Total Liabilities and Capital | $46,901 | $21,768 | $19,895 |
| Net Worth | $34,865 | $9,098 | $1,271 |
8.6 Business Ratios
The following table illustrates Business Ratios specific to this company as well as the industry.
| Ratio Analysis | ||||
| Year 1 | Year 2 | Year 3 | Industry Profile | |
| Sales Growth | 0.00% | 53.41% | 53.66% | 4.21% |
| Percent of Total Assets | ||||
| Other Current Assets | 0.00% | 0.00% | 0.00% | 36.72% |
| Total Current Assets | 93.18% | 88.97% | 91.94% | 63.63% |
| Long-term Assets | 6.82% | 11.03% | 8.06% | 36.37% |
| Total Assets | 100.00% | 100.00% | 100.00% | 100.00% |
| Current Liabilities | 25.66% | 58.20% | 93.61% | 32.89% |
| Long-term Liabilities | 0.00% | 0.00% | 0.00% | 18.63% |
| Total Liabilities | 25.66% | 58.20% | 93.61% | 51.52% |
| Net Worth | 74.34% | 41.80% | 6.39% | 48.48% |
| Percent of Sales | ||||
| Sales | 100.00% | 100.00% | 100.00% | 100.00% |
| Gross Margin | 32.98% | 29.07% | 29.07% | 34.93% |
| Selling, General & Administrative Expenses | 56.89% | 42.98% | 31.82% | 22.73% |
| Advertising Expenses | 0.00% | 0.00% | 0.00% | 0.73% |
| Profit Before Interest and Taxes | -23.91% | -13.91% | -2.75% | 1.04% |
| Main Ratios | ||||
| Current | 3.63 | 1.53 | 0.98 | 1.48 |
| Quick | 3.63 | 1.53 | 0.98 | 1.22 |
| Total Debt to Total Assets | 25.66% | 58.20% | 93.61% | 57.32% |
| Pre-tax Return on Net Worth | -82.78% | -283.20% | -615.95% | 2.62% |
| Pre-tax Return on Assets | -61.53% | -118.37% | -39.34% | 6.14% |
| Additional Ratios | Year 1 | Year 2 | Year 3 | |
| Net Profit Margin | -23.91% | -13.91% | -2.75% | n.a |
| Return on Equity | -82.78% | -283.20% | -615.95% | n.a |
| Activity Ratios | ||||
| Accounts Payable Turnover | 8.50 | 12.17 | 12.17 | n.a |
| Payment Days | 27 | 29 | 25 | n.a |
| Total Asset Turnover | 2.57 | 8.51 | 14.30 | n.a |
| Debt Ratios | ||||
| Debt to Net Worth | 0.35 | 1.39 | 14.66 | n.a |
| Current Liab. to Liab. | 1.00 | 1.00 | 1.00 | n.a |
| Liquidity Ratios | ||||
| Net Working Capital | $31,664 | $6,696 | ($332) | n.a |
| Interest Coverage | 0.00 | 0.00 | 0.00 | n.a |
| Additional Ratios | ||||
| Assets to Sales | 0.39 | 0.12 | 0.07 | n.a |
| Current Debt/Total Assets | 26% | 58% | 94% | n.a |
| Acid Test | 3.63 | 1.53 | 0.98 | n.a |
| Sales/Net Worth | 3.46 | 20.35 | 223.92 | n.a |
| Dividend Payout | 0.00 | 0.00 | 0.00 | n.a |
Appendix
| Sales Forecast | |||||||||||||
| Month 1 | Month 2 | Month 3 | Month 4 | Month 5 | Month 6 | Month 7 | Month 8 | Month 9 | Month 10 | Month 11 | Month 12 | ||
| Sales | |||||||||||||
| New Users | 0% | $0 | $1,208 | $1,964 | $2,305 | $2,941 | $3,512 | $3,593 | $3,756 | $3,865 | $4,113 | $4,328 | $4,910 |
| Advanced | 0% | $0 | $2,323 | $3,776 | $4,432 | $5,656 | $6,754 | $6,909 | $7,223 | $7,432 | $7,909 | $8,323 | $9,443 |
| Others | 0% | $0 | $465 | $755 | $886 | $1,131 | $1,351 | $1,382 | $1,445 | $1,486 | $1,582 | $1,665 | $1,889 |
| Total Sales | $0 | $3,996 | $6,495 | $7,623 | $9,728 | $11,617 | $11,883 | $12,424 | $12,783 | $13,603 | $14,316 | $16,242 | |
| Direct Cost of Sales | Month 1 | Month 2 | Month 3 | Month 4 | Month 5 | Month 6 | Month 7 | Month 8 | Month 9 | Month 10 | Month 11 | Month 12 | |
| New Users | $0 | $604 | $982 | $1,152 | $1,471 | $1,756 | $1,796 | $1,878 | $1,932 | $2,056 | $2,164 | $2,455 | |
| Advanced | $0 | $1,998 | $3,247 | $3,812 | $4,864 | $5,808 | $5,942 | $6,212 | $6,392 | $6,802 | $7,158 | $8,121 | |
| Others | $0 | $232 | $378 | $443 | $566 | $675 | $0 | $0 | $0 | $0 | $0 | $0 | |
| Subtotal Direct Cost of Sales | $0 | $2,834 | $4,607 | $5,407 | $6,901 | $8,239 | $7,738 | $8,090 | $8,324 | $8,858 | $9,322 | $10,576 | |
| Personnel Plan | |||||||||||||
| Month 1 | Month 2 | Month 3 | Month 4 | Month 5 | Month 6 | Month 7 | Month 8 | Month 9 | Month 10 | Month 11 | Month 12 | ||
| John | 0% | $2,500 | $2,500 | $2,500 | $2,500 | $2,500 | $2,500 | $2,500 | $2,500 | $2,500 | $2,500 | $2,500 | $2,500 |
| Part time employees | 0% | $0 | $0 | $0 | $1,500 | $1,500 | $1,500 | $2,000 | $2,000 | $2,000 | $2,000 | $2,000 | $2,000 |
| Total People | 1 | 1 | 1 | 2 | 2 | 2 | 3 | 3 | 3 | 3 | 3 | 3 | |
| Total Payroll | $2,500 | $2,500 | $2,500 | $4,000 | $4,000 | $4,000 | $4,500 | $4,500 | $4,500 | $4,500 | $4,500 | $4,500 | |
| General Assumptions | |||||||||||||
| Month 1 | Month 2 | Month 3 | Month 4 | Month 5 | Month 6 | Month 7 | Month 8 | Month 9 | Month 10 | Month 11 | Month 12 | ||
| Plan Month | 1 | 2 | 3 | 4 | 5 | 6 | 7 | 8 | 9 | 10 | 11 | 12 | |
| Current Interest Rate | 10.00% | 10.00% | 10.00% | 10.00% | 10.00% | 10.00% | 10.00% | 10.00% | 10.00% | 10.00% | 10.00% | 10.00% | |
| Long-term Interest Rate | 10.00% | 10.00% | 10.00% | 10.00% | 10.00% | 10.00% | 10.00% | 10.00% | 10.00% | 10.00% | 10.00% | 10.00% | |
| Tax Rate | 30.00% | 30.00% | 30.00% | 30.00% | 30.00% | 30.00% | 30.00% | 30.00% | 30.00% | 30.00% | 30.00% | 30.00% | |
| Other | 0 | 0 | 0 | 0 | 0 | 0 | 0 | 0 | 0 | 0 | 0 | 0 | |
| Pro Forma Profit and Loss | |||||||||||||
| Month 1 | Month 2 | Month 3 | Month 4 | Month 5 | Month 6 | Month 7 | Month 8 | Month 9 | Month 10 | Month 11 | Month 12 | ||
| Sales | $0 | $3,996 | $6,495 | $7,623 | $9,728 | $11,617 | $11,883 | $12,424 | $12,783 | $13,603 | $14,316 | $16,242 | |
| Direct Cost of Sales | $0 | $2,834 | $4,607 | $5,407 | $6,901 | $8,239 | $7,738 | $8,090 | $8,324 | $8,858 | $9,322 | $10,576 | |
| Other Costs of Sales | $0 | $0 | $0 | $0 | $0 | $0 | $0 | $0 | $0 | $0 | $0 | $0 | |
| Total Cost of Sales | $0 | $2,834 | $4,607 | $5,407 | $6,901 | $8,239 | $7,738 | $8,090 | $8,324 | $8,858 | $9,322 | $10,576 | |
| Gross Margin | $0 | $1,162 | $1,888 | $2,216 | $2,828 | $3,377 | $4,145 | $4,334 | $4,459 | $4,745 | $4,994 | $5,666 | |
| Gross Margin % | 0.00% | 29.08% | 29.06% | 29.07% | 29.07% | 29.07% | 34.88% | 34.88% | 34.88% | 34.88% | 34.88% | 34.88% | |
| Expenses | |||||||||||||
| Payroll | $2,500 | $2,500 | $2,500 | $4,000 | $4,000 | $4,000 | $4,500 | $4,500 | $4,500 | $4,500 | $4,500 | $4,500 | |
| Sales and Marketing and Other Expenses | $200 | $200 | $200 | $200 | $200 | $200 | $200 | $200 | $200 | $200 | $200 | $200 | |
| Depreciation | $67 | $67 | $67 | $67 | $67 | $67 | $67 | $67 | $67 | $67 | $67 | $67 | |
| Rent | $700 | $700 | $700 | $700 | $700 | $700 | $700 | $700 | $700 | $700 | $700 | $700 | |
| Utilities | $150 | $150 | $150 | $150 | $150 | $150 | $150 | $150 | $150 | $150 | $150 | $150 | |
| Insurance | $150 | $150 | $150 | $150 | $150 | $150 | $150 | $150 | $150 | $150 | $150 | $150 | |
| Payroll Taxes | 15% | $375 | $375 | $375 | $600 | $600 | $600 | $675 | $675 | $675 | $675 | $675 | $675 |
| Other | $0 | $0 | $0 | $0 | $0 | $0 | $0 | $0 | $0 | $0 | $0 | $0 | |
| Total Operating Expenses | $4,142 | $4,142 | $4,142 | $5,867 | $5,867 | $5,867 | $6,442 | $6,442 | $6,442 | $6,442 | $6,442 | $6,442 | |
| Profit Before Interest and Taxes | ($4,142) | ($2,980) | ($2,254) | ($3,650) | ($3,039) | ($2,489) | ($2,296) | ($2,108) | ($1,982) | ($1,696) | ($1,448) | ($776) | |
| EBITDA | ($4,075) | ($2,913) | ($2,187) | ($3,584) | ($2,972) | ($2,423) | ($2,230) | ($2,041) | ($1,916) | ($1,630) | ($1,381) | ($709) | |
| Interest Expense | $0 | $0 | $0 | $0 | $0 | $0 | $0 | $0 | $0 | $0 | $0 | $0 | |
| Taxes Incurred | $0 | $0 | $0 | $0 | $0 | $0 | $0 | $0 | $0 | $0 | $0 | $0 | |
| Net Profit | ($4,142) | ($2,980) | ($2,254) | ($3,650) | ($3,039) | ($2,489) | ($2,296) | ($2,108) | ($1,982) | ($1,696) | ($1,448) | ($776) | |
| Net Profit/Sales | 0.00% | -74.58% | -34.71% | -47.89% | -31.24% | -21.43% | -19.32% | -16.97% | -15.51% | -12.47% | -10.11% | -4.78% | |
| Pro Forma Cash Flow | |||||||||||||
| Month 1 | Month 2 | Month 3 | Month 4 | Month 5 | Month 6 | Month 7 | Month 8 | Month 9 | Month 10 | Month 11 | Month 12 | ||
| Cash Received | |||||||||||||
| Cash from Operations | |||||||||||||
| Cash Sales | $0 | $3,996 | $6,495 | $7,623 | $9,728 | $11,617 | $11,883 | $12,424 | $12,783 | $13,603 | $14,316 | $16,242 | |
| Subtotal Cash from Operations | $0 | $3,996 | $6,495 | $7,623 | $9,728 | $11,617 | $11,883 | $12,424 | $12,783 | $13,603 | $14,316 | $16,242 | |
| Additional Cash Received | |||||||||||||
| Sales Tax, VAT, HST/GST Received | 0.00% | $0 | $0 | $0 | $0 | $0 | $0 | $0 | $0 | $0 | $0 | $0 | $0 |
| New Current Borrowing | $0 | $0 | $0 | $0 | $0 | $0 | $0 | $0 | $0 | $0 | $0 | $0 | |
| New Other Liabilities (interest-free) | $0 | $0 | $0 | $0 | $0 | $0 | $0 | $0 | $0 | $0 | $0 | $0 | |
| New Long-term Liabilities | $0 | $0 | $0 | $0 | $0 | $0 | $0 | $0 | $0 | $0 | $0 | $0 | |
| Sales of Other Current Assets | $0 | $0 | $0 | $0 | $0 | $0 | $0 | $0 | $0 | $0 | $0 | $0 | |
| Sales of Long-term Assets | $0 | $0 | $0 | $0 | $0 | $0 | $0 | $0 | $0 | $0 | $0 | $0 | |
| New Investment Received | $0 | $0 | $0 | $0 | $0 | $0 | $0 | $0 | $0 | $0 | $0 | $0 | |
| Subtotal Cash Received | $0 | $3,996 | $6,495 | $7,623 | $9,728 | $11,617 | $11,883 | $12,424 | $12,783 | $13,603 | $14,316 | $16,242 | |
| Expenditures | Month 1 | Month 2 | Month 3 | Month 4 | Month 5 | Month 6 | Month 7 | Month 8 | Month 9 | Month 10 | Month 11 | Month 12 | |
| Expenditures from Operations | |||||||||||||
| Cash Spending | $2,500 | $2,500 | $2,500 | $4,000 | $4,000 | $4,000 | $4,500 | $4,500 | $4,500 | $4,500 | $4,500 | $4,500 | |
| Bill Payments | $53 | $1,669 | $4,468 | $6,216 | $7,257 | $8,745 | $10,025 | $9,625 | $9,973 | $10,217 | $10,749 | $11,239 | |
| Subtotal Spent on Operations | $2,553 | $4,169 | $6,968 | $10,216 | $11,257 | $12,745 | $14,525 | $14,125 | $14,473 | $14,717 | $15,249 | $15,739 | |
| Additional Cash Spent | |||||||||||||
| Sales Tax, VAT, HST/GST Paid Out | $0 | $0 | $0 | $0 | $0 | $0 | $0 | $0 | $0 | $0 | $0 | $0 | |
| Principal Repayment of Current Borrowing | $0 | $0 | $0 | $0 | $0 | $0 | $0 | $0 | $0 | $0 | $0 | $0 | |
| Other Liabilities Principal Repayment | $0 | $0 | $0 | $0 | $0 | $0 | $0 | $0 | $0 | $0 | $0 | $0 | |
| Long-term Liabilities Principal Repayment | $0 | $0 | $0 | $0 | $0 | $0 | $0 | $0 | $0 | $0 | $0 | $0 | |
| Purchase Other Current Assets | $0 | $0 | $0 | $0 | $0 | $0 | $0 | $0 | $0 | $0 | $0 | $0 | |
| Purchase Long-term Assets | $0 | $0 | $0 | $0 | $0 | $0 | $0 | $0 | $0 | $0 | $0 | $0 | |
| Dividends | $0 | $0 | $0 | $0 | $0 | $0 | $0 | $0 | $0 | $0 | $0 | $0 | |
| Subtotal Cash Spent | $2,553 | $4,169 | $6,968 | $10,216 | $11,257 | $12,745 | $14,525 | $14,125 | $14,473 | $14,717 | $15,249 | $15,739 | |
| Net Cash Flow | ($2,553) | ($174) | ($473) | ($2,593) | ($1,528) | ($1,128) | ($2,642) | ($1,701) | ($1,690) | ($1,113) | ($933) | $503 | |
| Cash Balance | $57,173 | $56,999 | $56,525 | $53,932 | $52,404 | $51,275 | $48,634 | $46,932 | $45,243 | $44,130 | $43,197 | $43,700 | |
| Pro Forma Balance Sheet | |||||||||||||
| Month 1 | Month 2 | Month 3 | Month 4 | Month 5 | Month 6 | Month 7 | Month 8 | Month 9 | Month 10 | Month 11 | Month 12 | ||
| Assets | Starting Balances | ||||||||||||
| Current Assets | |||||||||||||
| Cash | $59,725 | $57,173 | $56,999 | $56,525 | $53,932 | $52,404 | $51,275 | $48,634 | $46,932 | $45,243 | $44,130 | $43,197 | $43,700 |
| Other Current Assets | $0 | $0 | $0 | $0 | $0 | $0 | $0 | $0 | $0 | $0 | $0 | $0 | $0 |
| Total Current Assets | $59,725 | $57,173 | $56,999 | $56,525 | $53,932 | $52,404 | $51,275 | $48,634 | $46,932 | $45,243 | $44,130 | $43,197 | $43,700 |
| Long-term Assets | |||||||||||||
| Long-term Assets | $4,000 | $4,000 | $4,000 | $4,000 | $4,000 | $4,000 | $4,000 | $4,000 | $4,000 | $4,000 | $4,000 | $4,000 | $4,000 |
| Accumulated Depreciation | $0 | $67 | $133 | $200 | $266 | $333 | $400 | $466 | $533 | $599 | $666 | $733 | $799 |
| Total Long-term Assets | $4,000 | $3,933 | $3,867 | $3,800 | $3,734 | $3,667 | $3,600 | $3,534 | $3,467 | $3,401 | $3,334 | $3,267 | $3,201 |
| Total Assets | $63,725 | $61,106 | $60,865 | $60,326 | $57,666 | $56,071 | $54,876 | $52,167 | $50,400 | $48,643 | $47,464 | $46,464 | $46,901 |
| Liabilities and Capital | Month 1 | Month 2 | Month 3 | Month 4 | Month 5 | Month 6 | Month 7 | Month 8 | Month 9 | Month 10 | Month 11 | Month 12 | |
| Current Liabilities | |||||||||||||
| Accounts Payable | $0 | $1,523 | $4,262 | $5,976 | $6,967 | $8,411 | $9,705 | $9,293 | $9,633 | $9,859 | $10,375 | $10,824 | $12,036 |
| Current Borrowing | $0 | $0 | $0 | $0 | $0 | $0 | $0 | $0 | $0 | $0 | $0 | $0 | $0 |
| Other Current Liabilities | $0 | $0 | $0 | $0 | $0 | $0 | $0 | $0 | $0 | $0 | $0 | $0 | $0 |
| Subtotal Current Liabilities | $0 | $1,523 | $4,262 | $5,976 | $6,967 | $8,411 | $9,705 | $9,293 | $9,633 | $9,859 | $10,375 | $10,824 | $12,036 |
| Long-term Liabilities | $0 | $0 | $0 | $0 | $0 | $0 | $0 | $0 | $0 | $0 | $0 | $0 | $0 |
| Total Liabilities | $0 | $1,523 | $4,262 | $5,976 | $6,967 | $8,411 | $9,705 | $9,293 | $9,633 | $9,859 | $10,375 | $10,824 | $12,036 |
| Paid-in Capital | $70,000 | $70,000 | $70,000 | $70,000 | $70,000 | $70,000 | $70,000 | $70,000 | $70,000 | $70,000 | $70,000 | $70,000 | $70,000 |
| Retained Earnings | ($6,275) | ($6,275) | ($6,275) | ($6,275) | ($6,275) | ($6,275) | ($6,275) | ($6,275) | ($6,275) | ($6,275) | ($6,275) | ($6,275) | ($6,275) |
| Earnings | $0 | ($4,142) | ($7,121) | ($9,375) | ($13,026) | ($16,065) | ($18,554) | ($20,850) | ($22,958) | ($24,940) | ($26,637) | ($28,084) | ($28,860) |
| Total Capital | $63,725 | $59,583 | $56,604 | $54,350 | $50,699 | $47,660 | $45,171 | $42,875 | $40,767 | $38,785 | $37,088 | $35,641 | $34,865 |
| Total Liabilities and Capital | $63,725 | $61,106 | $60,865 | $60,326 | $57,666 | $56,071 | $54,876 | $52,167 | $50,400 | $48,643 | $47,464 | $46,464 | $46,901 |
| Net Worth | $63,725 | $59,583 | $56,604 | $54,350 | $50,699 | $47,660 | $45,171 | $42,875 | $40,767 | $38,785 | $37,088 | $35,641 | $34,865 |


