
Simplistic Labyrinth Design Studio
Executive Summary
Simplistic Labyrinth Design Studio is a designer/prototyper for a wide range of outdoor gear. Simplistic Labyrinth will create a prototype from customer specifications or from Simplistic’s imagination. Once the protype is made, the customer can then license the product and sell it as their own. This service is useful for companies that do not have an in-house design studio as well as those that do, but for whatever reason cannot produce some “one-off” models.
In addition to designs that are requested by manufacturers, Simplistic Labyrinth has several products that they have already designed and will try to find the right company to market and manufacture the product. Simplistic Labyrinth Design Studio will leverage their competitive advantages of imagination and expertise to gain market share. Profits will be variable over time, a function of the revenue cycle for this type of business.

1.1 Objectives
The objectives for the first three years of operation include:
- To create a service-based company whose primary goal is to exceed customers’ expectations.
- The utilization of Simplistic Labyrinth by at least four multi-million dollar companies.
- To increase the number of clients by 20% per year.
- To develop a sustainable home-based design studio that licenses designs to the top manufacturers in their respective fields.
1.2 Mission
Simplistic Labyrinth Design Studio’s mission is to provide cutting edge designs to be licensed by manufacturers. We exist to attract and maintain customers. When we adhere to this maxim, everything else will fall into place. Our services will exceed the expectations of our customers.
Company Summary
Simplistic Labyrinth Design Studio is a company that designs products, primarily outdoor gear, that is then licensed. Some of the products are designed and then a licensee is searched for to purchase the design. Other times a manufacturer will come to Simplistic and ask them to develop a product for them.
Simplistic Labyrinth Design Studio was founded by Ikan Fabreekate and is based out of Ikan’s studio in his home in Portland, Oregon. Simplistic Labyrinth Design Studio’s revenue is from license fees and one-off prototypes. Simplistic Labyrinth Design Studio will reach profitability by month four and will have yearly revenues of $6,000 for year two.
2.1 Company Ownership
Simplistic Labyrinth Design Studio is a sole proprietorship owned by Ikan Fabreekate.
2.2 Start-up Summary
Simplistic Labyrinth Design Studio will incur the following start-up expenses:
- Computer system with CD-RW, printer, Microsoft Office, QuickBooks Pro, CAD/CAM software, and a DSL connection.
- A commercial walking foot sewing machine.
- A serger.
- A heat press for applying 2-ply hot tape, 3-ply hot tape, polyurethane hot tape, and nitrile hot tape.
- Hot knife.
- Bar tacker.
- Assorted threads, needles, scissors, and fabric cutters.
- Extra phone line.
- Web page development.
Please note that the following items which are considered assets to be used for more than a year will labeled long-term assets and will be depreciated using G.A.A.P. approved straight-line depreciation method.

| Start-up Funding | |
| Start-up Expenses to Fund | $200 |
| Start-up Assets to Fund | $17,800 |
| Total Funding Required | $18,000 |
| Assets | |
| Non-cash Assets from Start-up | $6,350 |
| Cash Requirements from Start-up | $11,450 |
| Additional Cash Raised | $0 |
| Cash Balance on Starting Date | $11,450 |
| Total Assets | $17,800 |
| Liabilities and Capital | |
| Liabilities | |
| Current Borrowing | $0 |
| Long-term Liabilities | $0 |
| Accounts Payable (Outstanding Bills) | $0 |
| Other Current Liabilities (interest-free) | $0 |
| Total Liabilities | $0 |
| Capital | |
| Planned Investment | |
| Ikan | $18,000 |
| Investor 2 | $0 |
| Other | $0 |
| Additional Investment Requirement | $0 |
| Total Planned Investment | $18,000 |
| Loss at Start-up (Start-up Expenses) | ($200) |
| Total Capital | $17,800 |
| Total Capital and Liabilities | $17,800 |
| Total Funding | $18,000 |
| Start-up | |
| Requirements | |
| Start-up Expenses | |
| Legal | $100 |
| Stationery etc. | $100 |
| Other | $0 |
| Total Start-up Expenses | $200 |
| Start-up Assets | |
| Cash Required | $11,450 |
| Other Current Assets | $0 |
| Long-term Assets | $6,350 |
| Total Assets | $17,800 |
| Total Requirements | $18,000 |
Services
Simplistic Labyrinth Design Studio is a full-service design studio for outdoor gear. Simplistic Labyrinth creates designs as per specifications given to them by a manufacturer as well as has designs that were created independently of a request.
Some of Simplistic Labyrinth’s designs in the past have included an simple velcro watch band that is far more secure than traditional bands yet low profile, and an insulated wine/beer bag that maintains the internal temperature made out of 1000 denier Cordura fabric for durability, simple shoe bags for securing and separating footwear within suitcases for travel, a water hydration pack for ultramarathon running, a bag for bicycling that mounts on top of a rear rack and is completely waterproof, a strap system for securing trekking poles together, bicycling messenger bags, and a slim line padded laptop computer case/envelope. The design of the product is only limited by the clients willingness to pay.
Simplistic Labyrinth derives their revenue from license fees and prototyping fees. The license fees will be the cost charged to the company to use the product for production. This differs from a royalty because a license fee will be a one time fee for a set number of items in production. A royalty is typically a per item fee. The prototyping fees are the fees charged for the production of a prototype, or working model if you will.
Some of the items designed and produced by Simplistic Labyrinth will be patented, but only if 1) the design is novel enough to receive intellectual property protection, and 2) if the design is unique enough so that the patent is not easily avoided by changing a relatively insignificant part of the design.
Market Analysis Summary
Simplistic Labyrinth Design Studio has two targeted customers, manufacturers who are interested in Simplistic developing a prototype from their specifications or for Simplistic to develop the design. Simplistic will also target entrepreneurs who either have a general idea of some product that they think would sell well and they will have Simplistic design it.
These groups will be targeted primarily through activities within the outdoor industry like trade shows and advertisements in industry journals. Additionally, Simplistic will also specifically target entrepreneurs who are interested in taking a design to market by finding someone to manufacture it for them.
4.1 Market Segmentation
Simplistic Labyrinth’s customers can be divided into two different groups:
- Manufacturers who are looking to sell a specific design and either do not have a design facility in-house, or are in need of the design quicker than their in-house staff can offer.
- Entrepreneurs who will license the design and then shop it around to different manufacturers.
The majority of the business will be with the first group. It is not unusual for a manufacturer to look outside of their company to have a prototype made. There are many companies that are considered manufacturers yet they do not even make any of their products, they farm that work out to subcontractors. Manufacturers will also farm out the design and prototyping work as a cost saving measure against large overhead charges.
Some of the market does consist of entrepreneurs who will license a design and then shop it around to different manufacturers, often overseas to have the product mass produced. Sometimes they will be responsible for the distribution and marketing of the product, sometimes they will sell the license to their customer.

| Market Analysis | |||||||
| Year 1 | Year 2 | Year 3 | Year 4 | Year 5 | |||
| Potential Customers | Growth | CAGR | |||||
| Manufacturers | 9% | 1,245 | 1,357 | 1,479 | 1,612 | 1,757 | 8.99% |
| Entrepreneurs | 10% | 12,455 | 13,701 | 15,071 | 16,578 | 18,236 | 10.00% |
| Other | 0% | 0 | 0 | 0 | 0 | 0 | 0.00% |
| Total | 9.91% | 13,700 | 15,058 | 16,550 | 18,190 | 19,993 | 9.91% |

4.2 Target Market Segment Strategy
Simplistic Labyrinth will target their different market segments with a three-pronged approach:
- Outdoor industry trade shows. These shows typically occur two times a year in different locations. These trade shows are quite extensive, they have retailers, manufacturers, designers, wholesalers as well as the media. The who’s who can always be found at these trade shows. Attendance/display booths are by far the best way to network and gain business in this industry.
- Advertisements in industry journals. This is another targeted method of reaching the desired audience. In this case, only industry personnel have access to subscriptions so the audience is very targeted.
- Web page. A Web page will be used to advertise the company. Previous designs, as well as service offerings, will be listed on the page. The Web page allows companies that are geographically far away to be able to see past designs and learn more about Simplistic Labyrinth.
- Advertisements in entrepreneur magazines. These advertisements will be used to reach the market segments of entrepreneurs who are not necessarily in the outdoor industry but have an idea and would like it prototyped, or have money to buy a design created by Simplistic Labyrinth and will then take care of the manufacturing and marketing.
Strategy and Implementation Summary
Simplistic Labyrinth Design Studio will use their competitive advantage of imagination and expertise to help generate sales. Simplistic will generally be in touch with prospective customers either at the industry trade shows or when the customer calls with inquiries. During these conversations, Simplistic will be completely customer focused to give off the impression of professionalism. In addition to this customer centered attitude, Simplistic will leverage past designs to provide the impression of outstanding design. These efforts will lead to steady sales growth.
5.1 Milestones
Simplistic Labyrinth will have several milestones early on:
- Business plan completion. This will be done as a roadmap for the organization. This will be an indispensable tool for the ongoing performance and improvement of the company.
- Office set up.
- Portfolio and website completed.
- Profitability.
| Milestones | |||||
| Milestone | Start Date | End Date | Budget | Manager | Department |
| Business plan completion | 1/1/2001 | 2/1/2001 | $0 | ABC | Marketing |
| Office set up | 1/1/2001 | 2/1/2001 | $0 | ABC | Department |
| Portfolio and web site completed. | 1/1/2001 | 2/1/2001 | $0 | ABC | Department |
| Profitability | 1/1/2001 | 4/30/2001 | $0 | ABC | / |
| Totals | $0 | ||||
5.2 Competitive Edge
Simplistic Labyrinth’s competitive edge is imagination and expertise. Since Ikan was initially self taught in his sewing and design work, he was not limited by the “traditional” techniques of construction. This allows Ikan to “think out of the box,” meaning that he is able to come up with creative solutions to design constraints. Ikan is able to approach a project from a multitude of angles, from a cost benefit analysis, ultimate features, and extreme durability (Ikan’s specialty). This versatility based on imagination is certainly a competitive advantage.
Simplistic Labyrinth other competitive advantage is expertise. This paragraph will briefly touch on his expertise, for more detailed information please see the management summary section. Ikan has been designing for over five years. As stated before, Ikan was initially self taught. After purchasing a sewing machine at a thrift store, he started to experiment. After getting fairly proficient Ikan interned at Wy’East Fabrics, a prototyper of jackets, tents, expedition tarps, bivi sacks and packs. After interning at Wy’East Fabrics, working directly under Steve Eck, President and 15 year veteran, Ikan worked for Watershed, a custom manufacturer of Gore-Tex rain wear for search and rescue teams, police, fire units, etc. This diverse experience has given Ikan the necessary skills and experience to design a multitude of products.
5.3 Sales Strategy
Simplistic Labyrinth’s sales strategy will be to emphasize customer service and previous designs as an example of his work. Customer service will be emphasized to indicate Simplistic Labyrinth’s commitment to making sure that the customer is thrilled will all aspects of service provided. This includes professionalism in regards to all communications, accurate design proposals, continuous updates on progress, step by step approval process for the design, accurate delivery dates, and complete attention to detail.
Simplistic Labyrinth will also leverage all of their previous designs as a portfolio of their work. The portfolio will clearly indicate Ikan’s level of design, expertise, and potential. All the items that Ikan has in the portfolio have been trademarked and patented so Ikan will freely disperse the portfolio to impress prospective clients.
The prospective client will either approach Ikan at the industry trade show or call on the phone. Either way will be Ikan’s only occasion to turn the information gatherer into a long-term customer. Ikan will spend as much time as needed with the company to convince them that the obvious choice should be Simplistic Labyrinth.
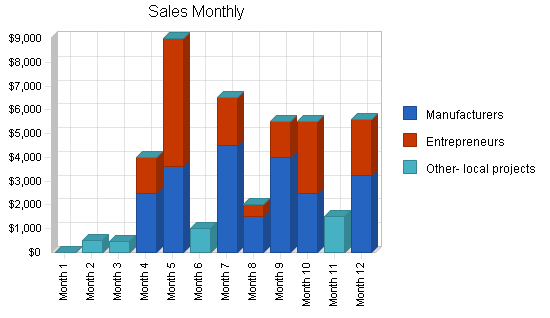
5.3.1 Sales Forecast
The first month will be used to set up the design studio in the basement of Ikan’s home, sign up for the upcoming trade shows, and get advertisements in the appropriate journals and magazines. Getting the word out to the industry that Simplistic Labyrinth is in business will take several months. To help cover the bills Ikan will be doing repair work and prototyping solicited through local outdoor stores. Ikan is friends with the owners of three stores and they are more than happy to point customers in his direction.
During month three Ikan will begin to get business that was generated through the trade show. This business will be somewhat lumpy, meaning that the revenues will come in large chunks, a large amount one month and nothing for the next. While this theoretically causes cash flow problems, Ikan is well aware of this nature and will guard against any possible problems.
From month three on, sales will steadily grow.
| Sales Forecast | |||
| Year 1 | Year 2 | Year 3 | |
| Sales | |||
| Manufacturers | $21,865 | $29,788 | $32,455 |
| Entrepreneurs | $16,245 | $26,455 | $30,145 |
| Other- local projects | $3,455 | $3,500 | $4,500 |
| Total Sales | $41,565 | $59,743 | $67,100 |
| Direct Cost of Sales | Year 1 | Year 2 | Year 3 |
| Manufacturers | $2,187 | $2,979 | $3,246 |
| Entrepreneurs | $1,625 | $2,646 | $3,015 |
| Other- local projects | $346 | $350 | $450 |
| Subtotal Direct Cost of Sales | $4,157 | $5,974 | $6,710 |
Web Plan Summary
The website will be used as a portfolio for prospective customers. It will be specially submitted to multiple search engines so companies that are searching for design firms will be able to find Simplistic Labyrinth. The website will display many different examples of Ikan’s work. The photographs of the work product examples will be very detailed with multiple views of the product. The website will also detail Ikan’s work experience. Lastly, the website will provide the prospective customer with a way to contact Simplistic Labyrinth with service requests or questions.
Management Summary
Ikan Fabreekate graduated from Washington and Jefferson College with a philosophy degree. While in school Ikan worked in an outdoor store part time to help fund college. Ikan continued to work in the outdoor store following college. Ikan decided to go to law school believing he wanted to participate in the justice system as a prosecutor. He enrolled at Willamette University in Oregon and during the first year of law school he quickly realized that he had no interest in being a prosecutor. Ikan still finished law school recognizing that the education was quite useful although not sure of what he wanted to do. During law school he found a source of inexpensive, slightly damaged, outdoor clothing and fabrics and with his limited sewing knowledge he repaired them.
Ikan was first introduced to the industry when he brough a fleece jacket into Wy’East Fabrics to have pit zips sewn in. Although Ikan had yet to develop the sewing skills at that point, he was quite proficient at the design of the modification and gave Wy’East Fabrics very specific instructions for the modification. When the job was done Ikan inspected the work, was generally impressed with the sewing quality, but politely pointed out how the work could be improved. Steve, the president of Wy’East Fabrics, recognized Ikan’s constructive feedback and made the necessary changes, vastly improving the modification. While in the store, Ikan picked up some fabric and notions and began to play with his sewing machine. Within a few months Ikan had gotten quite proficient with his sewing and had developed good relationship with Steve.
While still in school Ikan set up an internship that allowed him to use all of Wy’East Fabrics’ equipment in exchange for watching over the store and helping out customers. This is where Ikan’s skills really improved. This later developed in to an apprenticeship where Steve was refining Ikan’s skills as well as learning a few things from Ikan.
Upon graduation, Ikan was not excited about practicing law and he accepted a job with Watershed, a large custom Gore-tex manufacturer of rainwear for government agencies. Ikan worked hand in hand with the President and chief designer Bruce. Soon Ikan was doing a lot of the design work himself. At this point Ikan realized that he had the skills to open his own design studio and the rest they say is history.
7.1 Personnel Plan
Ikan is Simplistic Labyrinth Design Studio, the sole employee.
| Personnel Plan | |||
| Year 1 | Year 2 | Year 3 | |
| Owner | $36,000 | $40,000 | $50,000 |
| Name or Title | $0 | $0 | $0 |
| Name or Title | $0 | $0 | $0 |
| Other | $0 | $0 | $0 |
| Total People | 0 | 0 | 0 |
| Total Payroll | $36,000 | $40,000 | $50,000 |
Financial Plan
The following sections will outline important financial information.
8.1 Important Assumptions
The following table details important financial assumptions.
| General Assumptions | |||
| Year 1 | Year 2 | Year 3 | |
| Plan Month | 1 | 2 | 3 |
| Current Interest Rate | 10.00% | 10.00% | 10.00% |
| Long-term Interest Rate | 10.00% | 10.00% | 10.00% |
| Tax Rate | 30.00% | 30.00% | 30.00% |
| Other | 0 | 0 | 0 |
8.2 Break-even Analysis
The Break-even Analysis indicates the break-even point.

| Break-even Analysis | |
| Monthly Revenue Break-even | $4,081 |
| Assumptions: | |
| Average Percent Variable Cost | 10% |
| Estimated Monthly Fixed Cost | $3,673 |
8.3 Projected Profit and Loss
The following table will indicate projected profit and loss.


| Pro Forma Profit and Loss | |||
| Year 1 | Year 2 | Year 3 | |
| Sales | $41,565 | $59,743 | $67,100 |
| Direct Cost of Sales | $4,157 | $5,974 | $6,710 |
| Other Production Expenses | $0 | $0 | $0 |
| Total Cost of Sales | $4,157 | $5,974 | $6,710 |
| Gross Margin | $37,409 | $53,769 | $60,390 |
| Gross Margin % | 90.00% | 90.00% | 90.00% |
| Expenses | |||
| Payroll | $36,000 | $40,000 | $50,000 |
| Sales and Marketing and Other Expenses | $4,580 | $2,280 | $1,980 |
| Depreciation | $1,272 | $1,272 | $0 |
| Leased Equipment | $0 | $0 | $0 |
| Utilities | $1,440 | $1,440 | $1,440 |
| Insurance | $780 | $780 | $780 |
| Rent | $0 | $0 | $0 |
| Payroll Taxes | $0 | $0 | $0 |
| Other | $0 | $0 | $0 |
| Total Operating Expenses | $44,072 | $45,772 | $54,200 |
| Profit Before Interest and Taxes | ($6,664) | $7,997 | $6,190 |
| EBITDA | ($5,392) | $9,269 | $6,190 |
| Interest Expense | $0 | $0 | $0 |
| Taxes Incurred | $0 | $2,399 | $1,857 |
| Net Profit | ($6,664) | $5,598 | $4,333 |
| Net Profit/Sales | -16.03% | 9.37% | 6.46% |
8.4 Projected Cash Flow
The following chart and table will indicate projected cash flow.

| Pro Forma Cash Flow | |||
| Year 1 | Year 2 | Year 3 | |
| Cash Received | |||
| Cash from Operations | |||
| Cash Sales | $41,565 | $59,743 | $67,100 |
| Subtotal Cash from Operations | $41,565 | $59,743 | $67,100 |
| Additional Cash Received | |||
| Sales Tax, VAT, HST/GST Received | $0 | $0 | $0 |
| New Current Borrowing | $0 | $0 | $0 |
| New Other Liabilities (interest-free) | $0 | $0 | $0 |
| New Long-term Liabilities | $0 | $0 | $0 |
| Sales of Other Current Assets | $0 | $0 | $0 |
| Sales of Long-term Assets | $0 | $0 | $0 |
| New Investment Received | $0 | $0 | $0 |
| Subtotal Cash Received | $41,565 | $59,743 | $67,100 |
| Expenditures | Year 1 | Year 2 | Year 3 |
| Expenditures from Operations | |||
| Cash Spending | $36,000 | $40,000 | $50,000 |
| Bill Payments | $10,029 | $12,742 | $12,776 |
| Subtotal Spent on Operations | $46,029 | $52,742 | $62,776 |
| Additional Cash Spent | |||
| Sales Tax, VAT, HST/GST Paid Out | $0 | $0 | $0 |
| Principal Repayment of Current Borrowing | $0 | $0 | $0 |
| Other Liabilities Principal Repayment | $0 | $0 | $0 |
| Long-term Liabilities Principal Repayment | $0 | $0 | $0 |
| Purchase Other Current Assets | $0 | $0 | $0 |
| Purchase Long-term Assets | $0 | $0 | $0 |
| Dividends | $0 | $0 | $0 |
| Subtotal Cash Spent | $46,029 | $52,742 | $62,776 |
| Net Cash Flow | ($4,464) | $7,001 | $4,324 |
| Cash Balance | $6,986 | $13,986 | $18,311 |
8.5 Projected Balance Sheet
The following table will indicate the projected balance sheet.
| Pro Forma Balance Sheet | |||
| Year 1 | Year 2 | Year 3 | |
| Assets | |||
| Current Assets | |||
| Cash | $6,986 | $13,986 | $18,311 |
| Other Current Assets | $0 | $0 | $0 |
| Total Current Assets | $6,986 | $13,986 | $18,311 |
| Long-term Assets | |||
| Long-term Assets | $6,350 | $6,350 | $6,350 |
| Accumulated Depreciation | $1,272 | $2,544 | $2,544 |
| Total Long-term Assets | $5,078 | $3,806 | $3,806 |
| Total Assets | $12,064 | $17,792 | $22,117 |
| Liabilities and Capital | Year 1 | Year 2 | Year 3 |
| Current Liabilities | |||
| Accounts Payable | $927 | $1,058 | $1,049 |
| Current Borrowing | $0 | $0 | $0 |
| Other Current Liabilities | $0 | $0 | $0 |
| Subtotal Current Liabilities | $927 | $1,058 | $1,049 |
| Long-term Liabilities | $0 | $0 | $0 |
| Total Liabilities | $927 | $1,058 | $1,049 |
| Paid-in Capital | $18,000 | $18,000 | $18,000 |
| Retained Earnings | ($200) | ($6,864) | ($1,266) |
| Earnings | ($6,664) | $5,598 | $4,333 |
| Total Capital | $11,137 | $16,734 | $21,067 |
| Total Liabilities and Capital | $12,064 | $17,792 | $22,117 |
| Net Worth | $11,136 | $16,734 | $21,067 |
8.6 Business Ratios
Business ratios for the years of this plan are shown below. Industry profile ratios based on the Standard Industrial Classification (SIC) code 8711 (or NAICS 541330), Engineering Servicse, are shown for comparison.
| Ratio Analysis | ||||
| Year 1 | Year 2 | Year 3 | Industry Profile | |
| Sales Growth | 0.00% | 43.73% | 12.31% | 7.10% |
| Percent of Total Assets | ||||
| Other Current Assets | 0.00% | 0.00% | 0.00% | 38.30% |
| Total Current Assets | 57.91% | 78.61% | 82.79% | 77.40% |
| Long-term Assets | 42.09% | 21.39% | 17.21% | 22.60% |
| Total Assets | 100.00% | 100.00% | 100.00% | 100.00% |
| Current Liabilities | 7.68% | 5.95% | 4.74% | 44.50% |
| Long-term Liabilities | 0.00% | 0.00% | 0.00% | 11.70% |
| Total Liabilities | 7.68% | 5.95% | 4.74% | 56.20% |
| Net Worth | 92.32% | 94.05% | 95.26% | 43.80% |
| Percent of Sales | ||||
| Sales | 100.00% | 100.00% | 100.00% | 100.00% |
| Gross Margin | 90.00% | 90.00% | 90.00% | 0.00% |
| Selling, General & Administrative Expenses | 112.82% | 78.99% | 71.95% | 81.80% |
| Advertising Expenses | 4.61% | 2.67% | 1.92% | 0.20% |
| Profit Before Interest and Taxes | -16.03% | 13.39% | 9.23% | 2.50% |
| Main Ratios | ||||
| Current | 7.54 | 13.22 | 17.45 | 1.69 |
| Quick | 7.54 | 13.22 | 17.45 | 1.37 |
| Total Debt to Total Assets | 7.68% | 5.95% | 4.74% | 56.20% |
| Pre-tax Return on Net Worth | -59.83% | 47.79% | 29.38% | 6.00% |
| Pre-tax Return on Assets | -55.24% | 44.94% | 27.99% | 13.60% |
| Additional Ratios | Year 1 | Year 2 | Year 3 | |
| Net Profit Margin | -16.03% | 9.37% | 6.46% | n.a |
| Return on Equity | -59.83% | 33.45% | 20.57% | n.a |
| Activity Ratios | ||||
| Accounts Payable Turnover | 11.82 | 12.17 | 12.17 | n.a |
| Payment Days | 27 | 28 | 30 | n.a |
| Total Asset Turnover | 3.45 | 3.36 | 3.03 | n.a |
| Debt Ratios | ||||
| Debt to Net Worth | 0.08 | 0.06 | 0.05 | n.a |
| Current Liab. to Liab. | 1.00 | 1.00 | 1.00 | n.a |
| Liquidity Ratios | ||||
| Net Working Capital | $6,058 | $12,928 | $17,261 | n.a |
| Interest Coverage | 0.00 | 0.00 | 0.00 | n.a |
| Additional Ratios | ||||
| Assets to Sales | 0.29 | 0.30 | 0.33 | n.a |
| Current Debt/Total Assets | 8% | 6% | 5% | n.a |
| Acid Test | 7.54 | 13.22 | 17.45 | n.a |
| Sales/Net Worth | 3.73 | 3.57 | 3.19 | n.a |
| Dividend Payout | 0.00 | 0.00 | 0.00 | n.a |
Appendix
| Sales Forecast | |||||||||||||
| Month 1 | Month 2 | Month 3 | Month 4 | Month 5 | Month 6 | Month 7 | Month 8 | Month 9 | Month 10 | Month 11 | Month 12 | ||
| Sales | |||||||||||||
| Manufacturers | 0% | $0 | $0 | $0 | $2,500 | $3,600 | $0 | $4,520 | $1,500 | $4,000 | $2,500 | $0 | $3,245 |
| Entrepreneurs | 0% | $0 | $0 | $0 | $1,500 | $5,400 | $0 | $2,000 | $500 | $1,500 | $3,000 | $0 | $2,345 |
| Other- local projects | 0% | $0 | $500 | $455 | $0 | $0 | $1,000 | $0 | $0 | $0 | $0 | $1,500 | $0 |
| Total Sales | $0 | $500 | $455 | $4,000 | $9,000 | $1,000 | $6,520 | $2,000 | $5,500 | $5,500 | $1,500 | $5,590 | |
| Direct Cost of Sales | Month 1 | Month 2 | Month 3 | Month 4 | Month 5 | Month 6 | Month 7 | Month 8 | Month 9 | Month 10 | Month 11 | Month 12 | |
| Manufacturers | $0 | $0 | $0 | $250 | $360 | $0 | $452 | $150 | $400 | $250 | $0 | $325 | |
| Entrepreneurs | $0 | $0 | $0 | $150 | $540 | $0 | $200 | $50 | $150 | $300 | $0 | $235 | |
| Other- local projects | $0 | $50 | $46 | $0 | $0 | $100 | $0 | $0 | $0 | $0 | $150 | $0 | |
| Subtotal Direct Cost of Sales | $0 | $50 | $46 | $400 | $900 | $100 | $652 | $200 | $550 | $550 | $150 | $559 | |
| Personnel Plan | |||||||||||||
| Month 1 | Month 2 | Month 3 | Month 4 | Month 5 | Month 6 | Month 7 | Month 8 | Month 9 | Month 10 | Month 11 | Month 12 | ||
| Owner | 0% | $3,000 | $3,000 | $3,000 | $3,000 | $3,000 | $3,000 | $3,000 | $3,000 | $3,000 | $3,000 | $3,000 | $3,000 |
| Name or Title | 0% | $0 | $0 | $0 | $0 | $0 | $0 | $0 | $0 | $0 | $0 | $0 | $0 |
| Name or Title | 0% | $0 | $0 | $0 | $0 | $0 | $0 | $0 | $0 | $0 | $0 | $0 | $0 |
| Other | 0% | $0 | $0 | $0 | $0 | $0 | $0 | $0 | $0 | $0 | $0 | $0 | $0 |
| Total People | 0 | 0 | 0 | 0 | 0 | 0 | 0 | 0 | 0 | 0 | 0 | 0 | |
| Total Payroll | $3,000 | $3,000 | $3,000 | $3,000 | $3,000 | $3,000 | $3,000 | $3,000 | $3,000 | $3,000 | $3,000 | $3,000 | |
| General Assumptions | |||||||||||||
| Month 1 | Month 2 | Month 3 | Month 4 | Month 5 | Month 6 | Month 7 | Month 8 | Month 9 | Month 10 | Month 11 | Month 12 | ||
| Plan Month | 1 | 2 | 3 | 4 | 5 | 6 | 7 | 8 | 9 | 10 | 11 | 12 | |
| Current Interest Rate | 10.00% | 10.00% | 10.00% | 10.00% | 10.00% | 10.00% | 10.00% | 10.00% | 10.00% | 10.00% | 10.00% | 10.00% | |
| Long-term Interest Rate | 10.00% | 10.00% | 10.00% | 10.00% | 10.00% | 10.00% | 10.00% | 10.00% | 10.00% | 10.00% | 10.00% | 10.00% | |
| Tax Rate | 30.00% | 30.00% | 30.00% | 30.00% | 30.00% | 30.00% | 30.00% | 30.00% | 30.00% | 30.00% | 30.00% | 30.00% | |
| Other | 0 | 0 | 0 | 0 | 0 | 0 | 0 | 0 | 0 | 0 | 0 | 0 | |
| Pro Forma Profit and Loss | |||||||||||||
| Month 1 | Month 2 | Month 3 | Month 4 | Month 5 | Month 6 | Month 7 | Month 8 | Month 9 | Month 10 | Month 11 | Month 12 | ||
| Sales | $0 | $500 | $455 | $4,000 | $9,000 | $1,000 | $6,520 | $2,000 | $5,500 | $5,500 | $1,500 | $5,590 | |
| Direct Cost of Sales | $0 | $50 | $46 | $400 | $900 | $100 | $652 | $200 | $550 | $550 | $150 | $559 | |
| Other Production Expenses | $0 | $0 | $0 | $0 | $0 | $0 | $0 | $0 | $0 | $0 | $0 | $0 | |
| Total Cost of Sales | $0 | $50 | $46 | $400 | $900 | $100 | $652 | $200 | $550 | $550 | $150 | $559 | |
| Gross Margin | $0 | $450 | $410 | $3,600 | $8,100 | $900 | $5,868 | $1,800 | $4,950 | $4,950 | $1,350 | $5,031 | |
| Gross Margin % | 0.00% | 90.00% | 90.00% | 90.00% | 90.00% | 90.00% | 90.00% | 90.00% | 90.00% | 90.00% | 90.00% | 90.00% | |
| Expenses | |||||||||||||
| Payroll | $3,000 | $3,000 | $3,000 | $3,000 | $3,000 | $3,000 | $3,000 | $3,000 | $3,000 | $3,000 | $3,000 | $3,000 | |
| Sales and Marketing and Other Expenses | $215 | $1,215 | $215 | $215 | $215 | $215 | $215 | $1,215 | $215 | $215 | $215 | $215 | |
| Depreciation | $106 | $106 | $106 | $106 | $106 | $106 | $106 | $106 | $106 | $106 | $106 | $106 | |
| Leased Equipment | $0 | $0 | $0 | $0 | $0 | $0 | $0 | $0 | $0 | $0 | $0 | $0 | |
| Utilities | $120 | $120 | $120 | $120 | $120 | $120 | $120 | $120 | $120 | $120 | $120 | $120 | |
| Insurance | $65 | $65 | $65 | $65 | $65 | $65 | $65 | $65 | $65 | $65 | $65 | $65 | |
| Rent | $0 | $0 | $0 | $0 | $0 | $0 | $0 | $0 | $0 | $0 | $0 | $0 | |
| Payroll Taxes | 15% | $0 | $0 | $0 | $0 | $0 | $0 | $0 | $0 | $0 | $0 | $0 | $0 |
| Other | $0 | $0 | $0 | $0 | $0 | $0 | $0 | $0 | $0 | $0 | $0 | $0 | |
| Total Operating Expenses | $3,506 | $4,506 | $3,506 | $3,506 | $3,506 | $3,506 | $3,506 | $4,506 | $3,506 | $3,506 | $3,506 | $3,506 | |
| Profit Before Interest and Taxes | ($3,506) | ($4,056) | ($3,097) | $94 | $4,594 | ($2,606) | $2,362 | ($2,706) | $1,444 | $1,444 | ($2,156) | $1,525 | |
| EBITDA | ($3,400) | ($3,950) | ($2,991) | $200 | $4,700 | ($2,500) | $2,468 | ($2,600) | $1,550 | $1,550 | ($2,050) | $1,631 | |
| Interest Expense | $0 | $0 | $0 | $0 | $0 | $0 | $0 | $0 | $0 | $0 | $0 | $0 | |
| Taxes Incurred | $0 | $0 | $0 | $0 | $0 | $0 | $0 | $0 | $0 | $0 | $0 | $0 | |
| Net Profit | ($3,506) | ($4,056) | ($3,097) | $94 | $4,594 | ($2,606) | $2,362 | ($2,706) | $1,444 | $1,444 | ($2,156) | $1,525 | |
| Net Profit/Sales | 0.00% | -811.20% | -680.55% | 2.35% | 51.04% | -260.60% | 36.23% | -135.30% | 26.25% | 26.25% | -143.73% | 27.28% | |
| Pro Forma Cash Flow | |||||||||||||
| Month 1 | Month 2 | Month 3 | Month 4 | Month 5 | Month 6 | Month 7 | Month 8 | Month 9 | Month 10 | Month 11 | Month 12 | ||
| Cash Received | |||||||||||||
| Cash from Operations | |||||||||||||
| Cash Sales | $0 | $500 | $455 | $4,000 | $9,000 | $1,000 | $6,520 | $2,000 | $5,500 | $5,500 | $1,500 | $5,590 | |
| Subtotal Cash from Operations | $0 | $500 | $455 | $4,000 | $9,000 | $1,000 | $6,520 | $2,000 | $5,500 | $5,500 | $1,500 | $5,590 | |
| Additional Cash Received | |||||||||||||
| Sales Tax, VAT, HST/GST Received | 0.00% | $0 | $0 | $0 | $0 | $0 | $0 | $0 | $0 | $0 | $0 | $0 | $0 |
| New Current Borrowing | $0 | $0 | $0 | $0 | $0 | $0 | $0 | $0 | $0 | $0 | $0 | $0 | |
| New Other Liabilities (interest-free) | $0 | $0 | $0 | $0 | $0 | $0 | $0 | $0 | $0 | $0 | $0 | $0 | |
| New Long-term Liabilities | $0 | $0 | $0 | $0 | $0 | $0 | $0 | $0 | $0 | $0 | $0 | $0 | |
| Sales of Other Current Assets | $0 | $0 | $0 | $0 | $0 | $0 | $0 | $0 | $0 | $0 | $0 | $0 | |
| Sales of Long-term Assets | $0 | $0 | $0 | $0 | $0 | $0 | $0 | $0 | $0 | $0 | $0 | $0 | |
| New Investment Received | $0 | $0 | $0 | $0 | $0 | $0 | $0 | $0 | $0 | $0 | $0 | $0 | |
| Subtotal Cash Received | $0 | $500 | $455 | $4,000 | $9,000 | $1,000 | $6,520 | $2,000 | $5,500 | $5,500 | $1,500 | $5,590 | |
| Expenditures | Month 1 | Month 2 | Month 3 | Month 4 | Month 5 | Month 6 | Month 7 | Month 8 | Month 9 | Month 10 | Month 11 | Month 12 | |
| Expenditures from Operations | |||||||||||||
| Cash Spending | $3,000 | $3,000 | $3,000 | $3,000 | $3,000 | $3,000 | $3,000 | $3,000 | $3,000 | $3,000 | $3,000 | $3,000 | |
| Bill Payments | $13 | $435 | $1,417 | $457 | $817 | $1,273 | $518 | $1,070 | $1,578 | $950 | $937 | $564 | |
| Subtotal Spent on Operations | $3,013 | $3,435 | $4,417 | $3,457 | $3,817 | $4,273 | $3,518 | $4,070 | $4,578 | $3,950 | $3,937 | $3,564 | |
| Additional Cash Spent | |||||||||||||
| Sales Tax, VAT, HST/GST Paid Out | $0 | $0 | $0 | $0 | $0 | $0 | $0 | $0 | $0 | $0 | $0 | $0 | |
| Principal Repayment of Current Borrowing | $0 | $0 | $0 | $0 | $0 | $0 | $0 | $0 | $0 | $0 | $0 | $0 | |
| Other Liabilities Principal Repayment | $0 | $0 | $0 | $0 | $0 | $0 | $0 | $0 | $0 | $0 | $0 | $0 | |
| Long-term Liabilities Principal Repayment | $0 | $0 | $0 | $0 | $0 | $0 | $0 | $0 | $0 | $0 | $0 | $0 | |
| Purchase Other Current Assets | $0 | $0 | $0 | $0 | $0 | $0 | $0 | $0 | $0 | $0 | $0 | $0 | |
| Purchase Long-term Assets | $0 | $0 | $0 | $0 | $0 | $0 | $0 | $0 | $0 | $0 | $0 | $0 | |
| Dividends | $0 | $0 | $0 | $0 | $0 | $0 | $0 | $0 | $0 | $0 | $0 | $0 | |
| Subtotal Cash Spent | $3,013 | $3,435 | $4,417 | $3,457 | $3,817 | $4,273 | $3,518 | $4,070 | $4,578 | $3,950 | $3,937 | $3,564 | |
| Net Cash Flow | ($3,013) | ($2,935) | ($3,962) | $543 | $5,183 | ($3,273) | $3,002 | ($2,070) | $922 | $1,550 | ($2,437) | $2,026 | |
| Cash Balance | $8,437 | $5,502 | $1,540 | $2,083 | $7,266 | $3,993 | $6,994 | $4,924 | $5,846 | $7,396 | $4,959 | $6,986 | |
| Pro Forma Balance Sheet | |||||||||||||
| Month 1 | Month 2 | Month 3 | Month 4 | Month 5 | Month 6 | Month 7 | Month 8 | Month 9 | Month 10 | Month 11 | Month 12 | ||
| Assets | Starting Balances | ||||||||||||
| Current Assets | |||||||||||||
| Cash | $11,450 | $8,437 | $5,502 | $1,540 | $2,083 | $7,266 | $3,993 | $6,994 | $4,924 | $5,846 | $7,396 | $4,959 | $6,986 |
| Other Current Assets | $0 | $0 | $0 | $0 | $0 | $0 | $0 | $0 | $0 | $0 | $0 | $0 | $0 |
| Total Current Assets | $11,450 | $8,437 | $5,502 | $1,540 | $2,083 | $7,266 | $3,993 | $6,994 | $4,924 | $5,846 | $7,396 | $4,959 | $6,986 |
| Long-term Assets | |||||||||||||
| Long-term Assets | $6,350 | $6,350 | $6,350 | $6,350 | $6,350 | $6,350 | $6,350 | $6,350 | $6,350 | $6,350 | $6,350 | $6,350 | $6,350 |
| Accumulated Depreciation | $0 | $106 | $212 | $318 | $424 | $530 | $636 | $742 | $848 | $954 | $1,060 | $1,166 | $1,272 |
| Total Long-term Assets | $6,350 | $6,244 | $6,138 | $6,032 | $5,926 | $5,820 | $5,714 | $5,608 | $5,502 | $5,396 | $5,290 | $5,184 | $5,078 |
| Total Assets | $17,800 | $14,681 | $11,640 | $7,572 | $8,009 | $13,086 | $9,707 | $12,602 | $10,426 | $11,242 | $12,686 | $10,143 | $12,064 |
| Liabilities and Capital | Month 1 | Month 2 | Month 3 | Month 4 | Month 5 | Month 6 | Month 7 | Month 8 | Month 9 | Month 10 | Month 11 | Month 12 | |
| Current Liabilities | |||||||||||||
| Accounts Payable | $0 | $387 | $1,402 | $431 | $773 | $1,257 | $483 | $1,017 | $1,547 | $918 | $918 | $532 | $927 |
| Current Borrowing | $0 | $0 | $0 | $0 | $0 | $0 | $0 | $0 | $0 | $0 | $0 | $0 | $0 |
| Other Current Liabilities | $0 | $0 | $0 | $0 | $0 | $0 | $0 | $0 | $0 | $0 | $0 | $0 | $0 |
| Subtotal Current Liabilities | $0 | $387 | $1,402 | $431 | $773 | $1,257 | $483 | $1,017 | $1,547 | $918 | $918 | $532 | $927 |
| Long-term Liabilities | $0 | $0 | $0 | $0 | $0 | $0 | $0 | $0 | $0 | $0 | $0 | $0 | $0 |
| Total Liabilities | $0 | $387 | $1,402 | $431 | $773 | $1,257 | $483 | $1,017 | $1,547 | $918 | $918 | $532 | $927 |
| Paid-in Capital | $18,000 | $18,000 | $18,000 | $18,000 | $18,000 | $18,000 | $18,000 | $18,000 | $18,000 | $18,000 | $18,000 | $18,000 | $18,000 |
| Retained Earnings | ($200) | ($200) | ($200) | ($200) | ($200) | ($200) | ($200) | ($200) | ($200) | ($200) | ($200) | ($200) | ($200) |
| Earnings | $0 | ($3,506) | ($7,562) | ($10,659) | ($10,565) | ($5,971) | ($8,577) | ($6,215) | ($8,921) | ($7,477) | ($6,033) | ($8,189) | ($6,664) |
| Total Capital | $17,800 | $14,294 | $10,238 | $7,142 | $7,236 | $11,830 | $9,224 | $11,586 | $8,880 | $10,324 | $11,768 | $9,612 | $11,137 |
| Total Liabilities and Capital | $17,800 | $14,681 | $11,640 | $7,572 | $8,009 | $13,086 | $9,707 | $12,602 | $10,426 | $11,242 | $12,686 | $10,143 | $12,064 |
| Net Worth | $17,800 | $14,294 | $10,238 | $7,141 | $7,235 | $11,829 | $9,223 | $11,585 | $8,879 | $10,323 | $11,767 | $9,611 | $11,136 |


