
Studio67
Executive Summary
This restaurant business plan is for Studio67, a new medium-sized restaurant located in a trendy neighborhood of Portland, Oregon. Studio67’s emphasis will be on organic and creative ethnic food. An emphasis on organic ingredients is based on Studio67’s dedication to sustainable development. Additionally, the restaurant procures local foods when possible, reducing their dependence on fossil fuels used for transportation.
Services
Studio67 offers Portlanders a trendy, fun place to have great food in a social environment. Chef Mario Langostino has a large repertoire of ethnic ingredients and recipes. Studio67 forecasts that the majority of purchases will be from the chef’s recommendations. Ethnic recipes will be used to provide the customers with a diverse, unusual menu. Chef Mario will also be emphasizing healthy dishes, recognizing the trend within the restaurant industry for the demand for healthy cuisine.
Customers
Studio67 believes that the market can be segmented into four distinct groups that it aims to target. The first group is the lonely rich which number 400,000 people. The second group that will be targeted is young happy customers which are growing at an annual rate of 8% with 150,000 potential customers. The third group is rich hippies who naturally desire organic foods as well as ethnic cuisine. The last group which is particularly interested in the menu’s healthy offerings is dieting women which number 350,000 in the Portland area.
Management
Studio67 has assembled a strong management team. Andrew Flounderson will be the general manager. Andrew has extensive management experience of organizations ranging from six to 45 people. Jane Flap will be responsible for all of the finance and accounting functions. Jane has seven years experience as an Arthur Andersen CPA. Jane’s financial control skills will be invaluable in keeping Studio67 on track and profitable. Lastly, Studio67 has chef Marion Langostino who will be responsible for the back-end production of the venture. Chef Mario has over 12 years of experience and is a published, visible fixture in the Portland community.
Most important to Studio67 is the financial success which will be achieved through strict financial controls. Additionally, success will be ensured by offering a high-quality service and extremely clean, non-greasy food with interesting twists. Studio67 does plan to raise menu rates as the restaurant gets more and more crowded, and to make sure that they are charging a premium for the feeling of being in the “in crowd.”
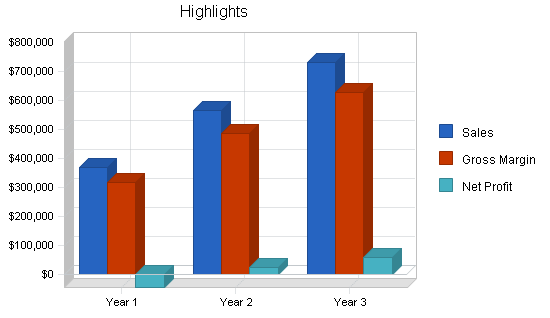
The market and financial analyses indicate that with a start-up expenditure of $141,000, Studio67 can generate over $365,000 in sales by year one, $565,000 in sales by the end of year two and produce net profits of over 7.5% on sales by the end of year three. Profitability will be reached by year two.
Objectives
- Sales of $350K the first year, more than half a million the second.
- Personnel costs less than $300K the first year, less than $400K the second year.
- Profitable in year two, better than 7.5% profits on sales by year three.
Mission
Studio67 is a great place to eat, combining an intriguing atmosphere with excellent, interesting food that is also very good for the people who eat there. We want fair profit for the owners, and a rewarding place to work for the employees.
Company Summary
Studio67 is a single-unit, medium-sized restaurant. We focus on organic and creative food. The restaurant will be located in a prime neighborhood of Portland. Most important to us is our financial success, but we believe this will be achieved by offering high-quality service and extremely clean, non-greasy food with interesting twists.
Company Ownership
The restaurant will start out as a simple sole proprietorship, owned by its founders.
Start-up Summary
The founders of the company are Andrew Flounderson and his companion Jane Flap. Jane focuses on the financial issues and Andrew on the personnel issues. Jane earned her business major undergraduate degree from the University of Berkeley.
We have found the location and secured the lease for $2,000 per month. We will be able to set up shop in time to begin turning back a profit by the end of month eleven and be profitable in the second year. The place is already equipped as a restaurant so we plan to come up with a total of $40,000 in capital, plus a $100,000 SBA-guaranteed loan, to start up the company.

| Start-up Funding | |
| Start-up Expenses to Fund | $3,000 |
| Start-up Assets to Fund | $138,000 |
| Total Funding Required | $141,000 |
| Assets | |
| Non-cash Assets from Start-up | $50,000 |
| Cash Requirements from Start-up | $88,000 |
| Additional Cash Raised | $0 |
| Cash Balance on Starting Date | $88,000 |
| Total Assets | $138,000 |
| Liabilities and Capital | |
| Liabilities | |
| Current Borrowing | $0 |
| Long-term Liabilities | $100,000 |
| Accounts Payable (Outstanding Bills) | $1,000 |
| Other Current Liabilities (interest-free) | $0 |
| Total Liabilities | $101,000 |
| Capital | |
| Planned Investment | |
| Investor 1 | $25,000 |
| Investor 2 | $15,000 |
| Additional Investment Requirement | $0 |
| Total Planned Investment | $40,000 |
| Loss at Start-up (Start-up Expenses) | ($3,000) |
| Total Capital | $37,000 |
| Total Capital and Liabilities | $138,000 |
| Total Funding | $141,000 |
| Start-up | |
| Requirements | |
| Start-up Expenses | |
| Legal | $1,000 |
| Stationery etc. | $1,000 |
| Other | $1,000 |
| Total Start-up Expenses | $3,000 |
| Start-up Assets | |
| Cash Required | $88,000 |
| Other Current Assets | $50,000 |
| Long-term Assets | $0 |
| Total Assets | $138,000 |
| Total Requirements | $141,000 |
Services
The Menu
The menu is going to be extremely simple but changing every day. We will keep a small group of constants on the menu and then feature a chef’s recommendation that we plan to have 85% of meals ordering. This will help us to reduce waste and plan ingredients and purchasing.
Organic Ingredients
The organic ingredient element will allow us to price to the extremely wealthy Internet entrepreneurs who are looking to spend an exorbitant amount of money to have peace of mind that their money is still coming back to themselves. We will be extremely ecologically conscious as well, and spread this across our literature. Eating at Studio67 will feel like having contributed to the Sierra Club and drinking fresh squeezed orange juice.
Ethnic Ingredients and Recipes
Our chef will have great latitude in designing and producing menu offerings from many different world cultures. We will endeavor to procure all the traditional, authentic ingredients necessary to hold true to these varied and interesting cultural recipes.
Interior Accoutrements
People need to keep life interesting, and our artwork will reflect the world influences that are core to the attitude of the Studio67 chef.
Market Analysis Summary
Because of the founders’ connections within the very trendy area of Portland, we have an excellent feel for the area and its core group of customers. They will all share something alike, which is a feeling of being in the “in crowd” and having “gotten it” in life. Although the crew will be different and not connect with each other in each segment, each segment is complementary to the others. We do plan to raise menu rates as the restaurant gets more and more crowded, and to make sure we are charging a premium for the feeling of being in the “in crowd.”
Market Segmentation
The Lonely Rich
Most of the lonely rich are tech workers these days, and most of those tech workers are Internet workers. Their life has become their website servers and code they write, and the people who help them to make the decisions in that world. They hang out with each other, but desperately want to get away from it and use the money they are racking up. Because this wealth has come fairly easily for them, it is particularly easy to separate them from their money again – they spend the most on drinks, appetizers and tips.

Young Happy Couples
The restaurant will have an atmosphere that encourages people to bring dates and to have couples arrive. It won’t be awkward for others, and Studio67 does want to be a social place where people meet each other and develop a network. These young couples are generally very successful but balanced and won’t be spending as much on drinks.
The Rich Hippies
The rich hippies in Portland are a massive group with tremendous influence over the city’s government and private enterprise. They wear tie-die but drive BMWs and crave the feeling of being in a social circle that is changing the world – even if in different ways than in their glory days. We will cater to their ecological ideology and contribute to charities to help them part with more of their money.
Dieting Women
The organic food menu will always have a line of extremely delicious very low-fat meals. Studio67 will have tables of women meeting like they do in shows like Sex and the City, to discuss all types of matters while feeling good about the food they eat.

| Market Analysis | |||||||
| Year 1 | Year 2 | Year 3 | Year 4 | Year 5 | |||
| Potential Customers | Growth | CAGR | |||||
| Lonely Rich | 10% | 400,000 | 440,000 | 484,000 | 532,400 | 585,640 | 10.00% |
| Young Happy Couples | 8% | 150,000 | 162,000 | 174,960 | 188,957 | 204,074 | 8.00% |
| Rich Hippies | 6% | 250,000 | 265,000 | 280,900 | 297,754 | 315,619 | 6.00% |
| Dieting Women | 7% | 350,000 | 374,500 | 400,715 | 428,765 | 458,779 | 7.00% |
| Other | 5% | 50,000 | 52,500 | 55,125 | 57,881 | 60,775 | 5.00% |
| Total | 7.87% | 1,200,000 | 1,294,000 | 1,395,700 | 1,505,757 | 1,624,887 | 7.87% |
Strategy and Implementation Summary
Our strategy is simple, we intend to succeed by giving people a combination of great,healthy, interesting food, and an environment that attracts “trendy” people like a magnet. Implementation isn’t simple, but that’s in the doing of it, not in the plan.
Competitive Edge
Our competitive edge is the menu, the chef, the environment, and the tie-in to what’s trendy.
Sales Strategy
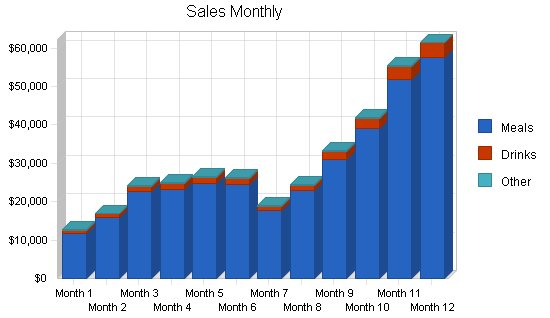
As the table shows, we intend to deliver sales of about $350K in the first year, and to double that by the third year of the plan.
| Sales Forecast | |||
| Year 1 | Year 2 | Year 3 | |
| Unit Sales | |||
| Meals | 22,822 | 35,000 | 45,000 |
| Drinks | 11,415 | 17,500 | 22,500 |
| Other | 240 | 500 | 1,000 |
| Total Unit Sales | 34,477 | 53,000 | 68,500 |
| Unit Prices | Year 1 | Year 2 | Year 3 |
| Meals | $15.00 | $15.00 | $15.00 |
| Drinks | $2.00 | $2.00 | $2.00 |
| Other | $10.00 | $10.00 | $10.00 |
| Sales | |||
| Meals | $342,330 | $525,000 | $675,000 |
| Drinks | $22,830 | $35,000 | $45,000 |
| Other | $2,400 | $5,000 | $10,000 |
| Total Sales | $367,560 | $565,000 | $730,000 |
| Direct Unit Costs | Year 1 | Year 2 | Year 3 |
| Meals | $2.00 | $2.00 | $2.00 |
| Drinks | $0.50 | $0.50 | $0.50 |
| Other | $1.00 | $1.00 | $1.00 |
| Direct Cost of Sales | |||
| Meals | $45,644 | $70,000 | $90,000 |
| Drinks | $5,708 | $8,750 | $11,250 |
| Other | $240 | $500 | $1,000 |
| Subtotal Direct Cost of Sales | $51,592 | $79,250 | $102,250 |
Management Summary
Andrew has great experience managing personnel and we are quite confident of his ability to find the best staff possible. Our chef, Mario Langostino, is already on board and has a published cookbook that will add prestige to the restaurant immediately. We will be looking to find a young, ultra-hip staff to make sure we add the edge that makes Studio67 so trendy.
Personnel Plan
As the personnel plan shows, we expect to invest in a good team, fairly compensated. We think the planned staff is in good proportion to the size of the restaurant and projected revenues.
| Personnel Plan | |||
| Year 1 | Year 2 | Year 3 | |
| Manager | $60,000 | $65,000 | $70,000 |
| Hostess | $42,000 | $45,000 | $50,000 |
| Chef | $54,000 | $60,000 | $65,000 |
| Cleaning | $30,000 | $35,000 | $40,000 |
| Waiters | $72,000 | $100,000 | $130,000 |
| Other | $24,000 | $52,000 | $55,000 |
| Total People | 8 | 10 | 12 |
| Total Payroll | $282,000 | $357,000 | $410,000 |
Financial Plan
We expect to raise $40,000 of our own capital, and to borrow $100,000 guaranteed by the SBA as a 10-year loan. This provides the bulk of the start-up financing required.
Break-even Analysis
Our break-even analysis is based on the average of the first-year numbers for total sales by meal served, total cost of sales, and all operating expenses. These are presented as per-unit revenue, per-unit cost, and fixed costs. We realize that this is not really the same as fixed cost, but these conservative assumptions make for a better estimate of real risk.

| Break-even Analysis | |
| Monthly Units Break-even | 3,205 |
| Monthly Revenue Break-even | $34,171 |
| Assumptions: | |
| Average Per-Unit Revenue | $10.66 |
| Average Per-Unit Variable Cost | $1.50 |
| Estimated Monthly Fixed Cost | $29,375 |
Projected Profit and Loss
As the profit and loss table shows, we expect to become barely profitable in the second year of business, and to make an acceptable profit in the third year.

| Pro Forma Profit and Loss | |||
| Year 1 | Year 2 | Year 3 | |
| Sales | $367,560 | $565,000 | $730,000 |
| Direct Cost of Sales | $51,592 | $79,250 | $102,250 |
| Other | $0 | $0 | $0 |
| Total Cost of Sales | $51,592 | $79,250 | $102,250 |
| Gross Margin | $315,969 | $485,750 | $627,750 |
| Gross Margin % | 85.96% | 85.97% | 85.99% |
| Expenses | |||
| Payroll | $282,000 | $357,000 | $410,000 |
| Sales and Marketing and Other Expenses | $27,000 | $35,830 | $72,122 |
| Depreciation | $0 | $0 | $0 |
| Utilities | $1,200 | $1,260 | $1,323 |
| Payroll Taxes | $42,300 | $53,550 | $61,500 |
| Other | $0 | $0 | $0 |
| Total Operating Expenses | $352,500 | $447,640 | $544,945 |
| Profit Before Interest and Taxes | ($36,532) | $38,110 | $82,806 |
| EBITDA | ($36,532) | $38,110 | $82,806 |
| Interest Expense | $9,673 | $8,887 | $7,637 |
| Taxes Incurred | $0 | $7,306 | $19,105 |
| Net Profit | ($46,204) | $21,917 | $56,063 |
| Net Profit/Sales | -12.57% | 3.88% | 7.68% |
Projected Cash Flow
The cash flow projection shows that starting cost and provisions for ongoing expenses are adequate to meet our needs until the business itself generates its own cash flow sufficient to support operations.

| Pro Forma Cash Flow | |||
| Year 1 | Year 2 | Year 3 | |
| Cash Received | |||
| Cash from Operations | |||
| Cash Sales | $367,560 | $565,000 | $730,000 |
| Subtotal Cash from Operations | $367,560 | $565,000 | $730,000 |
| Additional Cash Received | |||
| Sales Tax, VAT, HST/GST Received | $0 | $0 | $0 |
| New Current Borrowing | $0 | $0 | $0 |
| New Other Liabilities (interest-free) | $0 | $0 | $0 |
| New Long-term Liabilities | $0 | $0 | $0 |
| Sales of Other Current Assets | $0 | $0 | $0 |
| Sales of Long-term Assets | $0 | $0 | $0 |
| New Investment Received | $0 | $0 | $0 |
| Subtotal Cash Received | $367,560 | $565,000 | $730,000 |
| Expenditures | Year 1 | Year 2 | Year 3 |
| Expenditures from Operations | |||
| Cash Spending | $282,000 | $357,000 | $410,000 |
| Bill Payments | $117,968 | $185,584 | $257,538 |
| Subtotal Spent on Operations | $399,968 | $542,584 | $667,538 |
| Additional Cash Spent | |||
| Sales Tax, VAT, HST/GST Paid Out | $0 | $0 | $0 |
| Principal Repayment of Current Borrowing | $0 | $0 | $0 |
| Other Liabilities Principal Repayment | $0 | $0 | $0 |
| Long-term Liabilities Principal Repayment | $6,133 | $10,000 | $15,000 |
| Purchase Other Current Assets | $0 | $0 | $0 |
| Purchase Long-term Assets | $0 | $0 | $0 |
| Dividends | $0 | $0 | $0 |
| Subtotal Cash Spent | $406,101 | $552,584 | $682,538 |
| Net Cash Flow | ($38,541) | $12,416 | $47,462 |
| Cash Balance | $49,459 | $61,875 | $109,337 |
Projected Balance Sheet
The table shows projected balance sheet for three years.
| Pro Forma Balance Sheet | |||
| Year 1 | Year 2 | Year 3 | |
| Assets | |||
| Current Assets | |||
| Cash | $49,459 | $61,875 | $109,337 |
| Other Current Assets | $50,000 | $50,000 | $50,000 |
| Total Current Assets | $99,459 | $111,875 | $159,337 |
| Long-term Assets | |||
| Long-term Assets | $0 | $0 | $0 |
| Accumulated Depreciation | $0 | $0 | $0 |
| Total Long-term Assets | $0 | $0 | $0 |
| Total Assets | $99,459 | $111,875 | $159,337 |
| Liabilities and Capital | Year 1 | Year 2 | Year 3 |
| Current Liabilities | |||
| Accounts Payable | $14,796 | $15,294 | $21,693 |
| Current Borrowing | $0 | $0 | $0 |
| Other Current Liabilities | $0 | $0 | $0 |
| Subtotal Current Liabilities | $14,796 | $15,294 | $21,693 |
| Long-term Liabilities | $93,867 | $83,867 | $68,867 |
| Total Liabilities | $108,663 | $99,161 | $90,560 |
| Paid-in Capital | $40,000 | $40,000 | $40,000 |
| Retained Earnings | ($3,000) | ($49,204) | ($27,287) |
| Earnings | ($46,204) | $21,917 | $56,063 |
| Total Capital | ($9,204) | $12,713 | $68,776 |
| Total Liabilities and Capital | $99,459 | $111,875 | $159,337 |
| Net Worth | ($9,204) | $12,713 | $68,776 |
Business Ratios
Business ratios for the years of this plan are shown below. Industry Profile ratios based on the Standard Industrial Classification (SIC) code 5813, Eating Places, are shown for comparison.
| Ratio Analysis | ||||
| Year 1 | Year 2 | Year 3 | Industry Profile | |
| Sales Growth | n.a. | 53.72% | 29.20% | 7.60% |
| Percent of Total Assets | ||||
| Other Current Assets | 50.27% | 44.69% | 31.38% | 35.60% |
| Total Current Assets | 100.00% | 100.00% | 100.00% | 43.70% |
| Long-term Assets | 0.00% | 0.00% | 0.00% | 56.30% |
| Total Assets | 100.00% | 100.00% | 100.00% | 100.00% |
| Current Liabilities | 14.88% | 13.67% | 13.61% | 32.70% |
| Long-term Liabilities | 94.38% | 74.97% | 43.22% | 28.50% |
| Total Liabilities | 109.25% | 88.64% | 56.84% | 61.20% |
| Net Worth | -9.25% | 11.36% | 43.16% | 38.80% |
| Percent of Sales | ||||
| Sales | 100.00% | 100.00% | 100.00% | 100.00% |
| Gross Margin | 85.96% | 85.97% | 85.99% | 60.50% |
| Selling, General & Administrative Expenses | 98.90% | 82.32% | 78.45% | 39.80% |
| Advertising Expenses | 0.65% | 1.77% | 6.16% | 3.20% |
| Profit Before Interest and Taxes | -9.94% | 6.75% | 11.34% | 0.70% |
| Main Ratios | ||||
| Current | 6.72 | 7.31 | 7.34 | 0.98 |
| Quick | 6.72 | 7.31 | 7.34 | 0.65 |
| Total Debt to Total Assets | 109.25% | 88.64% | 56.84% | 61.20% |
| Pre-tax Return on Net Worth | 501.98% | 229.87% | 109.29% | 1.70% |
| Pre-tax Return on Assets | -46.46% | 26.12% | 47.18% | 4.30% |
| Additional Ratios | Year 1 | Year 2 | Year 3 | |
| Net Profit Margin | -12.57% | 3.88% | 7.68% | n.a |
| Return on Equity | 0.00% | 172.40% | 81.52% | n.a |
| Activity Ratios | ||||
| Accounts Payable Turnover | 8.91 | 12.17 | 12.17 | n.a |
| Payment Days | 27 | 30 | 26 | n.a |
| Total Asset Turnover | 3.70 | 5.05 | 4.58 | n.a |
| Debt Ratios | ||||
| Debt to Net Worth | 0.00 | 7.80 | 1.32 | n.a |
| Current Liab. to Liab. | 0.14 | 0.15 | 0.24 | n.a |
| Liquidity Ratios | ||||
| Net Working Capital | $84,663 | $96,580 | $137,643 | n.a |
| Interest Coverage | -3.78 | 4.29 | 10.84 | n.a |
| Additional Ratios | ||||
| Assets to Sales | 0.27 | 0.20 | 0.22 | n.a |
| Current Debt/Total Assets | 15% | 14% | 14% | n.a |
| Acid Test | 6.72 | 7.31 | 7.34 | n.a |
| Sales/Net Worth | 0.00 | 44.44 | 10.61 | n.a |
| Dividend Payout | 0.00 | 0.00 | 0.00 | n.a |
Appendix
| Sales Forecast | |||||||||||||
| Month 1 | Month 2 | Month 3 | Month 4 | Month 5 | Month 6 | Month 7 | Month 8 | Month 9 | Month 10 | Month 11 | Month 12 | ||
| Unit Sales | |||||||||||||
| Meals | 0% | 779 | 1,053 | 1,505 | 1,553 | 1,652 | 1,633 | 1,173 | 1,520 | 2,066 | 2,602 | 3,451 | 3,835 |
| Drinks | 50% | 390 | 527 | 753 | 777 | 826 | 817 | 587 | 760 | 1,033 | 1,301 | 1,726 | 1,918 |
| Other | 0% | 20 | 20 | 20 | 20 | 20 | 20 | 20 | 20 | 20 | 20 | 20 | 20 |
| Total Unit Sales | 1,189 | 1,600 | 2,278 | 2,350 | 2,498 | 2,470 | 1,780 | 2,300 | 3,119 | 3,923 | 5,197 | 5,773 | |
| Unit Prices | Month 1 | Month 2 | Month 3 | Month 4 | Month 5 | Month 6 | Month 7 | Month 8 | Month 9 | Month 10 | Month 11 | Month 12 | |
| Meals | $15.00 | $15.00 | $15.00 | $15.00 | $15.00 | $15.00 | $15.00 | $15.00 | $15.00 | $15.00 | $15.00 | $15.00 | |
| Drinks | $2.00 | $2.00 | $2.00 | $2.00 | $2.00 | $2.00 | $2.00 | $2.00 | $2.00 | $2.00 | $2.00 | $2.00 | |
| Other | $10.00 | $10.00 | $10.00 | $10.00 | $10.00 | $10.00 | $10.00 | $10.00 | $10.00 | $10.00 | $10.00 | $10.00 | |
| Sales | |||||||||||||
| Meals | $11,685 | $15,795 | $22,575 | $23,295 | $24,780 | $24,495 | $17,595 | $22,800 | $30,990 | $39,030 | $51,765 | $57,525 | |
| Drinks | $780 | $1,054 | $1,506 | $1,554 | $1,652 | $1,634 | $1,174 | $1,520 | $2,066 | $2,602 | $3,452 | $3,836 | |
| Other | $200 | $200 | $200 | $200 | $200 | $200 | $200 | $200 | $200 | $200 | $200 | $200 | |
| Total Sales | $12,665 | $17,049 | $24,281 | $25,049 | $26,632 | $26,329 | $18,969 | $24,520 | $33,256 | $41,832 | $55,417 | $61,561 | |
| Direct Unit Costs | Month 1 | Month 2 | Month 3 | Month 4 | Month 5 | Month 6 | Month 7 | Month 8 | Month 9 | Month 10 | Month 11 | Month 12 | |
| Meals | 0.00% | $2.00 | $2.00 | $2.00 | $2.00 | $2.00 | $2.00 | $2.00 | $2.00 | $2.00 | $2.00 | $2.00 | $2.00 |
| Drinks | 0.00% | $0.50 | $0.50 | $0.50 | $0.50 | $0.50 | $0.50 | $0.50 | $0.50 | $0.50 | $0.50 | $0.50 | $0.50 |
| Other | 0.00% | $1.00 | $1.00 | $1.00 | $1.00 | $1.00 | $1.00 | $1.00 | $1.00 | $1.00 | $1.00 | $1.00 | $1.00 |
| Direct Cost of Sales | |||||||||||||
| Meals | $1,558 | $2,106 | $3,010 | $3,106 | $3,304 | $3,266 | $2,346 | $3,040 | $4,132 | $5,204 | $6,902 | $7,670 | |
| Drinks | $195 | $264 | $377 | $389 | $413 | $409 | $294 | $380 | $517 | $651 | $863 | $959 | |
| Other | $20 | $20 | $20 | $20 | $20 | $20 | $20 | $20 | $20 | $20 | $20 | $20 | |
| Subtotal Direct Cost of Sales | $1,773 | $2,390 | $3,407 | $3,515 | $3,737 | $3,695 | $2,660 | $3,440 | $4,669 | $5,875 | $7,785 | $8,649 | |
| Personnel Plan | |||||||||||||
| Month 1 | Month 2 | Month 3 | Month 4 | Month 5 | Month 6 | Month 7 | Month 8 | Month 9 | Month 10 | Month 11 | Month 12 | ||
| Manager | 0% | $5,000 | $5,000 | $5,000 | $5,000 | $5,000 | $5,000 | $5,000 | $5,000 | $5,000 | $5,000 | $5,000 | $5,000 |
| Hostess | 0% | $3,500 | $3,500 | $3,500 | $3,500 | $3,500 | $3,500 | $3,500 | $3,500 | $3,500 | $3,500 | $3,500 | $3,500 |
| Chef | 0% | $4,500 | $4,500 | $4,500 | $4,500 | $4,500 | $4,500 | $4,500 | $4,500 | $4,500 | $4,500 | $4,500 | $4,500 |
| Cleaning | 0% | $2,500 | $2,500 | $2,500 | $2,500 | $2,500 | $2,500 | $2,500 | $2,500 | $2,500 | $2,500 | $2,500 | $2,500 |
| Waiters | 0% | $6,000 | $6,000 | $6,000 | $6,000 | $6,000 | $6,000 | $6,000 | $6,000 | $6,000 | $6,000 | $6,000 | $6,000 |
| Other | 0% | $2,000 | $2,000 | $2,000 | $2,000 | $2,000 | $2,000 | $2,000 | $2,000 | $2,000 | $2,000 | $2,000 | $2,000 |
| Total People | 8 | 8 | 8 | 8 | 8 | 8 | 8 | 8 | 8 | 8 | 8 | 8 | |
| Total Payroll | $23,500 | $23,500 | $23,500 | $23,500 | $23,500 | $23,500 | $23,500 | $23,500 | $23,500 | $23,500 | $23,500 | $23,500 | |
| General Assumptions | |||||||||||||
| Month 1 | Month 2 | Month 3 | Month 4 | Month 5 | Month 6 | Month 7 | Month 8 | Month 9 | Month 10 | Month 11 | Month 12 | ||
| Plan Month | 1 | 2 | 3 | 4 | 5 | 6 | 7 | 8 | 9 | 10 | 11 | 12 | |
| Current Interest Rate | 10.00% | 10.00% | 10.00% | 10.00% | 10.00% | 10.00% | 10.00% | 10.00% | 10.00% | 10.00% | 10.00% | 10.00% | |
| Long-term Interest Rate | 10.00% | 10.00% | 10.00% | 10.00% | 10.00% | 10.00% | 10.00% | 10.00% | 10.00% | 10.00% | 10.00% | 10.00% | |
| Tax Rate | 30.00% | 25.00% | 25.00% | 25.00% | 25.00% | 25.00% | 25.00% | 25.00% | 25.00% | 25.00% | 25.00% | 25.00% | |
| Other | 0 | 0 | 0 | 0 | 0 | 0 | 0 | 0 | 0 | 0 | 0 | 0 | |
| Pro Forma Profit and Loss | |||||||||||||
| Month 1 | Month 2 | Month 3 | Month 4 | Month 5 | Month 6 | Month 7 | Month 8 | Month 9 | Month 10 | Month 11 | Month 12 | ||
| Sales | $12,665 | $17,049 | $24,281 | $25,049 | $26,632 | $26,329 | $18,969 | $24,520 | $33,256 | $41,832 | $55,417 | $61,561 | |
| Direct Cost of Sales | $1,773 | $2,390 | $3,407 | $3,515 | $3,737 | $3,695 | $2,660 | $3,440 | $4,669 | $5,875 | $7,785 | $8,649 | |
| Other | $0 | $0 | $0 | $0 | $0 | $0 | $0 | $0 | $0 | $0 | $0 | $0 | |
| Total Cost of Sales | $1,773 | $2,390 | $3,407 | $3,515 | $3,737 | $3,695 | $2,660 | $3,440 | $4,669 | $5,875 | $7,785 | $8,649 | |
| Gross Margin | $10,892 | $14,660 | $20,875 | $21,535 | $22,895 | $22,635 | $16,310 | $21,080 | $28,588 | $35,958 | $47,632 | $52,912 | |
| Gross Margin % | 86.00% | 85.98% | 85.97% | 85.97% | 85.97% | 85.97% | 85.98% | 85.97% | 85.96% | 85.96% | 85.95% | 85.95% | |
| Expenses | |||||||||||||
| Payroll | $23,500 | $23,500 | $23,500 | $23,500 | $23,500 | $23,500 | $23,500 | $23,500 | $23,500 | $23,500 | $23,500 | $23,500 | |
| Sales and Marketing and Other Expenses | $2,250 | $2,250 | $2,250 | $2,250 | $2,250 | $2,250 | $2,250 | $2,250 | $2,250 | $2,250 | $2,250 | $2,250 | |
| Depreciation | 5% | $0 | $0 | $0 | $0 | $0 | $0 | $0 | $0 | $0 | $0 | $0 | $0 |
| Utilities | 5% | $100 | $100 | $100 | $100 | $100 | $100 | $100 | $100 | $100 | $100 | $100 | $100 |
| Payroll Taxes | 15% | $3,525 | $3,525 | $3,525 | $3,525 | $3,525 | $3,525 | $3,525 | $3,525 | $3,525 | $3,525 | $3,525 | $3,525 |
| Other | $0 | $0 | $0 | $0 | $0 | $0 | $0 | $0 | $0 | $0 | $0 | $0 | |
| Total Operating Expenses | $29,375 | $29,375 | $29,375 | $29,375 | $29,375 | $29,375 | $29,375 | $29,375 | $29,375 | $29,375 | $29,375 | $29,375 | |
| Profit Before Interest and Taxes | ($18,483) | ($14,716) | ($8,501) | ($7,841) | ($6,480) | ($6,741) | ($13,066) | ($8,295) | ($788) | $6,583 | $18,257 | $23,537 | |
| EBITDA | ($18,483) | ($14,716) | ($8,501) | ($7,841) | ($6,480) | ($6,741) | ($13,066) | ($8,295) | ($788) | $6,583 | $18,257 | $23,537 | |
| Interest Expense | $829 | $825 | $821 | $817 | $813 | $808 | $804 | $800 | $795 | $791 | $787 | $782 | |
| Taxes Incurred | $0 | $0 | $0 | $0 | $0 | $0 | $0 | $0 | $0 | $0 | $0 | $0 | |
| Net Profit | ($19,312) | ($15,541) | ($9,322) | ($8,657) | ($7,293) | ($7,549) | ($13,870) | ($9,095) | ($1,583) | $5,791 | $17,470 | $22,755 | |
| Net Profit/Sales | -152.49% | -91.15% | -38.39% | -34.56% | -27.38% | -28.67% | -73.12% | -37.09% | -4.76% | 13.84% | 31.53% | 36.96% | |
| Pro Forma Cash Flow | |||||||||||||
| Month 1 | Month 2 | Month 3 | Month 4 | Month 5 | Month 6 | Month 7 | Month 8 | Month 9 | Month 10 | Month 11 | Month 12 | ||
| Cash Received | |||||||||||||
| Cash from Operations | |||||||||||||
| Cash Sales | $12,665 | $17,049 | $24,281 | $25,049 | $26,632 | $26,329 | $18,969 | $24,520 | $33,256 | $41,832 | $55,417 | $61,561 | |
| Subtotal Cash from Operations | $12,665 | $17,049 | $24,281 | $25,049 | $26,632 | $26,329 | $18,969 | $24,520 | $33,256 | $41,832 | $55,417 | $61,561 | |
| Additional Cash Received | |||||||||||||
| Sales Tax, VAT, HST/GST Received | 0.00% | $0 | $0 | $0 | $0 | $0 | $0 | $0 | $0 | $0 | $0 | $0 | $0 |
| New Current Borrowing | $0 | $0 | $0 | $0 | $0 | $0 | $0 | $0 | $0 | $0 | $0 | $0 | |
| New Other Liabilities (interest-free) | $0 | $0 | $0 | $0 | $0 | $0 | $0 | $0 | $0 | $0 | $0 | $0 | |
| New Long-term Liabilities | $0 | $0 | $0 | $0 | $0 | $0 | $0 | $0 | $0 | $0 | $0 | $0 | |
| Sales of Other Current Assets | $0 | $0 | $0 | $0 | $0 | $0 | $0 | $0 | $0 | $0 | $0 | $0 | |
| Sales of Long-term Assets | $0 | $0 | $0 | $0 | $0 | $0 | $0 | $0 | $0 | $0 | $0 | $0 | |
| New Investment Received | $0 | $0 | $0 | $0 | $0 | $0 | $0 | $0 | $0 | $0 | $0 | $0 | |
| Subtotal Cash Received | $12,665 | $17,049 | $24,281 | $25,049 | $26,632 | $26,329 | $18,969 | $24,520 | $33,256 | $41,832 | $55,417 | $61,561 | |
| Expenditures | Month 1 | Month 2 | Month 3 | Month 4 | Month 5 | Month 6 | Month 7 | Month 8 | Month 9 | Month 10 | Month 11 | Month 12 | |
| Expenditures from Operations | |||||||||||||
| Cash Spending | $23,500 | $23,500 | $23,500 | $23,500 | $23,500 | $23,500 | $23,500 | $23,500 | $23,500 | $23,500 | $23,500 | $23,500 | |
| Bill Payments | $1,283 | $8,498 | $9,123 | $10,106 | $10,214 | $10,423 | $10,343 | $9,365 | $10,156 | $11,379 | $12,604 | $14,475 | |
| Subtotal Spent on Operations | $24,783 | $31,998 | $32,623 | $33,606 | $33,714 | $33,923 | $33,843 | $32,865 | $33,656 | $34,879 | $36,104 | $37,975 | |
| Additional Cash Spent | |||||||||||||
| Sales Tax, VAT, HST/GST Paid Out | $0 | $0 | $0 | $0 | $0 | $0 | $0 | $0 | $0 | $0 | $0 | $0 | |
| Principal Repayment of Current Borrowing | $0 | $0 | $0 | $0 | $0 | $0 | $0 | $0 | $0 | $0 | $0 | $0 | |
| Other Liabilities Principal Repayment | $0 | $0 | $0 | $0 | $0 | $0 | $0 | $0 | $0 | $0 | $0 | $0 | |
| Long-term Liabilities Principal Repayment | $488 | $492 | $496 | $500 | $505 | $509 | $513 | $517 | $522 | $526 | $530 | $535 | |
| Purchase Other Current Assets | $0 | $0 | $0 | $0 | $0 | $0 | $0 | $0 | $0 | $0 | $0 | $0 | |
| Purchase Long-term Assets | $0 | $0 | $0 | $0 | $0 | $0 | $0 | $0 | $0 | $0 | $0 | $0 | |
| Dividends | $0 | $0 | $0 | $0 | $0 | $0 | $0 | $0 | $0 | $0 | $0 | $0 | |
| Subtotal Cash Spent | $25,271 | $32,490 | $33,119 | $34,106 | $34,219 | $34,432 | $34,356 | $33,382 | $34,178 | $35,405 | $36,634 | $38,510 | |
| Net Cash Flow | ($12,606) | ($15,441) | ($8,838) | ($9,057) | ($7,587) | ($8,103) | ($15,387) | ($8,862) | ($922) | $6,427 | $18,783 | $23,051 | |
| Cash Balance | $75,394 | $59,954 | $51,115 | $42,058 | $34,472 | $26,369 | $10,981 | $2,120 | $1,198 | $7,625 | $26,408 | $49,459 | |
| Pro Forma Balance Sheet | |||||||||||||
| Month 1 | Month 2 | Month 3 | Month 4 | Month 5 | Month 6 | Month 7 | Month 8 | Month 9 | Month 10 | Month 11 | Month 12 | ||
| Assets | Starting Balances | ||||||||||||
| Current Assets | |||||||||||||
| Cash | $88,000 | $75,394 | $59,954 | $51,115 | $42,058 | $34,472 | $26,369 | $10,981 | $2,120 | $1,198 | $7,625 | $26,408 | $49,459 |
| Other Current Assets | $50,000 | $50,000 | $50,000 | $50,000 | $50,000 | $50,000 | $50,000 | $50,000 | $50,000 | $50,000 | $50,000 | $50,000 | $50,000 |
| Total Current Assets | $138,000 | $125,394 | $109,954 | $101,115 | $92,058 | $84,472 | $76,369 | $60,981 | $52,120 | $51,198 | $57,625 | $76,408 | $99,459 |
| Long-term Assets | |||||||||||||
| Long-term Assets | $0 | $0 | $0 | $0 | $0 | $0 | $0 | $0 | $0 | $0 | $0 | $0 | $0 |
| Accumulated Depreciation | $0 | $0 | $0 | $0 | $0 | $0 | $0 | $0 | $0 | $0 | $0 | $0 | $0 |
| Total Long-term Assets | $0 | $0 | $0 | $0 | $0 | $0 | $0 | $0 | $0 | $0 | $0 | $0 | $0 |
| Total Assets | $138,000 | $125,394 | $109,954 | $101,115 | $92,058 | $84,472 | $76,369 | $60,981 | $52,120 | $51,198 | $57,625 | $76,408 | $99,459 |
| Liabilities and Capital | Month 1 | Month 2 | Month 3 | Month 4 | Month 5 | Month 6 | Month 7 | Month 8 | Month 9 | Month 10 | Month 11 | Month 12 | |
| Current Liabilities | |||||||||||||
| Accounts Payable | $1,000 | $8,195 | $8,787 | $9,766 | $9,866 | $10,077 | $10,032 | $9,027 | $9,778 | $10,961 | $12,123 | $13,965 | $14,796 |
| Current Borrowing | $0 | $0 | $0 | $0 | $0 | $0 | $0 | $0 | $0 | $0 | $0 | $0 | $0 |
| Other Current Liabilities | $0 | $0 | $0 | $0 | $0 | $0 | $0 | $0 | $0 | $0 | $0 | $0 | $0 |
| Subtotal Current Liabilities | $1,000 | $8,195 | $8,787 | $9,766 | $9,866 | $10,077 | $10,032 | $9,027 | $9,778 | $10,961 | $12,123 | $13,965 | $14,796 |
| Long-term Liabilities | $100,000 | $99,512 | $99,020 | $98,524 | $98,024 | $97,519 | $97,010 | $96,497 | $95,980 | $95,458 | $94,932 | $94,402 | $93,867 |
| Total Liabilities | $101,000 | $107,707 | $107,807 | $108,290 | $107,890 | $107,596 | $107,042 | $105,524 | $105,758 | $106,419 | $107,055 | $108,367 | $108,663 |
| Paid-in Capital | $40,000 | $40,000 | $40,000 | $40,000 | $40,000 | $40,000 | $40,000 | $40,000 | $40,000 | $40,000 | $40,000 | $40,000 | $40,000 |
| Retained Earnings | ($3,000) | ($3,000) | ($3,000) | ($3,000) | ($3,000) | ($3,000) | ($3,000) | ($3,000) | ($3,000) | ($3,000) | ($3,000) | ($3,000) | ($3,000) |
| Earnings | $0 | ($19,312) | ($34,853) | ($44,174) | ($52,832) | ($60,124) | ($67,673) | ($81,543) | ($90,638) | ($92,221) | ($86,429) | ($68,959) | ($46,204) |
| Total Capital | $37,000 | $17,688 | $2,147 | ($7,174) | ($15,832) | ($23,124) | ($30,673) | ($44,543) | ($53,638) | ($55,221) | ($49,429) | ($31,959) | ($9,204) |
| Total Liabilities and Capital | $138,000 | $125,394 | $109,954 | $101,115 | $92,058 | $84,472 | $76,369 | $60,981 | $52,120 | $51,198 | $57,625 | $76,408 | $99,459 |
| Net Worth | $37,000 | $17,688 | $2,147 | ($7,174) | ($15,832) | ($23,124) | ($30,673) | ($44,543) | ($53,638) | ($55,221) | ($49,429) | ($31,959) | ($9,204) |

