
The College Cafe
Executive Summary
The College Cafe is a student-to-student Internet marketplace providing college students with the opportunity to buy, sell and trade college textbooks, participate in auctions, post classified ads, provide teacher evaluations, and buy products for college. The College Cafe’s target market consists of over 15.8 million college students who spend $200 billion annually. The College Cafe was founded in July and is presently in its start-up stage.
1.1 Solution
The College Cafe will enable students to buy, sell, and trade used textbooks directly to other students, by-passing the university bookstores. By selling textbooks to other students, the seller can receive more money than the bookstore will pay and the buyer can pay less than the bookstore charges. In addition to textbooks, students will be able to sell class notes, old tests, computers, dorm accessories, used CDs, tutoring services or anything students wish to sell via an online student-to-student marketplace. In addition, the College Cafe will offer other services such as classifieds, teacher evaluations, weblogs (bloggers), specialized content and retail.
The College Cafe will establish itself as the leading online student-to-student marketplace by combining extensive market-specific expertise with Internet technologies to generate revenue while creating a win-win solution for students. The College Cafe will achieve market dominance by utilizing extensive domain experience, a local grass roots marketing strategy, an exceptional management team, superior software, and the formation of strategic alliances, memberships and partnerships with companies within the college market.
1.2 Market
The U.S. college student market is a growing yet underserved niche market. The U.S. Department of Education expects the U.S. college student market to grow from 15.8 million students to 17.2 million in the next five years. According to Harris Interactive college students are expected to spend over $200 billion this year.
1.3 Opportunity
College students are eager to find ways to get “quick cash” at the end of every semester. One method college students use is to sell their old textbooks at the end of every semester, however the re-sell market is controlled by the local university bookstore. Because university bookstores monopolize the market, students receive only a fraction of the value paid for the book, typically 75% or less of the purchase prices. The bookstores then re-sell the books back to other students, receiving over 125% profit. The current situation creates a lose-lose situation for students and a win-win situation for bookstores. Students are looking for convenient, money saving ways to purchase textbooks and to receive more value when re-selling textbooks at the end of each semester.
1.4 Financial & Capital Requirements
According to the opportunities and requirements for The College Cafe described in this business plan, we have determined the following financial projections:
- Generate exceptional revenues by the end of year one.
- Report profits during the 9th month of operation.
- Exceed a 1.5x increase in sales and profits by the end of year three.
The College Cafe will require an initial seed investment as well as later rounds of investment. The initial seed capital will be used for marketing and customer acquisition, software and website development.
1.5 Objectives
The College Cafe will strive to achieve the following objectives:
- Become the leading Internet student-to-student marketplace
- Attract 500,000 registered users in the first year
- Achieve 50,000 visits per month
- Establish sustainable profitability within the first year
Company Summary
The College Cafe was founded in July and is presently in its start-up stage. The College Cafe website has been in operation with limited functionality since August of last year. The College Cafe is currently being test marketed at Georgia State University.
2.1 Company Locations and Facilities
800 Peachtree Street – Unit 8429
Atlanta, GA 30308
United States
www.thecollegeCafe .com
www.thecollegeCafe .net
The College Cafe’s data center is hosted and maintained by Atl-Connect Internet Services. Atl-Connect is located in Atlanta, Georgia.
2.2 Mission
The College Cafe’s mission is to provide college students a valuable and unique source for products, services and information. In order to achieve our mission, The College Cafe commits to the following philosophies:
- It’s all about the product.
- Our customers are our employers.
- Don’t be greedy.
- Keep our employees happy.
2.3 Ownership
The College Cafe is a Limited Liability Company and is solely owned by its founder, Gerald Owens.
2.4 Keys to Success
Our key to success will lie in our ability to execute our business model. In order to achieve success, we need to focus on the following areas to establish The College Cafe as a successful and profitable enterprise. They are:
- Recruit an exceptional management and marketing team with extensive domain experience in the college market.
- Create and maintain a “Grass Roots” marketing campaign.
- Offer innovative and unique products and services.
- Form strategic alliances and partnerships with companies suppling products to the college market.
2.5 Management Summary
The strength of The College Cafe’s management team stems from the combined expertise in both management and technical areas. The College Cafe recognizes that additional staff is required to properly support marketing, sales, research, and support functions. Currently, The College Cafe is supported by three people with experience in e-commerce strategy, website architecture and design and graphic design. Additional employees may be required in the areas of senior level management, Web development, marketing, sales, human resources/recruiting, administration, customer support and other critical operational positions.
The College Cafe will utilize current college students to fill positions in the areas of regional campus marketing, local advertisement sales, administration, customer support other non-critical operational positions. These positions will be full-time, part-time and intern positions depending on the local market. Using current college students will enable The College Cafe to receive inexpensive local employment and valuable market feedback from The College Cafe’s target market while also providing real world work experience to college students.
The College Cafe will utilize consultants and contractors during website enhancements and development efforts.
Board of Directors
At this time The College Cafe is seeking individuals for a Board of Directors. These individuals will include highly qualified business and industry professionals/experts along with members of the investment team. These individuals will assist our management team in making appropriate decisions, forming strategic alliances and taking the most effective action to be the industry leader.
2.6 Management Team
Our management team consists of three dedicated employees and two technical advisors. Their backgrounds consist of more than 30 years of experience in e-commerce, marketing and the Internet technology. In addition to their professional experience, the management team has over 30 years of college domain experience.
Gerald Owens, Founder, Chief Technical Officer/Web Development
Mr. Owens has over 12 years of work experience including engineering, programming and sales. He was successful in founding the start-up company, DCSi-Online, an online intermediary serving the building automation industry. Mr. Owens has a Bachelor of Science degree in Electrical Engineering form North Carolina State University and a MBA with a concentration in E-commerce and Computer Information Systems from Georgia State University. He is an active member of the Technology Association of Georgia (TAG) and the Southeastern Regional Internet Society (SERIS).

Kelly Mitchell – Online User Experience and Marketing
Ms. Mitchell has 7 years’ experience in the interactive space, specializing in online branding, marketing, and user experience design. Her most recent position involves leading a user experience team for a Fortune-50 company. Ms. Mitchell has a Bachelor of Science degree from the University of Georgia and has received art direction training from the Woodruff School of Art in Atlanta. She is an active member of the Atlanta Interactive Marketing Association.
Andréa Powers – Marketing and Communications
Ms. Powers has 10 years marketing and communications experience. She has worked for two major corporations headquartered in Atlanta, Georgia and has experience in sales, employee communications, public relations, interactive communications and technology marketing. Ms. Powers has a wealth of knowledge regarding interactive web management, project management, account/vendor management, customer needs analysis, concept strategy, and building quality strategic interpersonal relationships. She has a Bachelor of Science degree in Communications from Florida State University.
Chris Durant – Advisor
Mr. Durant has 10 years technology and business experience in system integration. He has worked for both large corporations, such as Georgia Pacific Corporation, and small start-up firms. Mr. Durant has a Bachelor Business Administration in Management Science and Computer Information Systems from the University of Georgia as well as an MBA and graduated top of the MS/CIS program from Georgia State University with a concentration in electronic Commerce. He also holds extensive network design experience and is an industry certified Network Engineer.
Brian Dupree – Advisor
Mr. Dupree has 20 years experience in the technology industry. He has extensive experience managing and developing mission critical software systems for business applications. Recently, he has worked as a senior consultant for an e-business consulting company where he has participated in advanced web application projects. Mr. Dupree holds a Masters Degree in Mathematics and Computer Science and a MBA with a concentration in e-commerce from Georgia State University.
2.7 Start-up Summary
Our start-up costs assumptions are shown in the following table and chart, and include Web hosting, software, development and marketing expenses. The start-up costs were financed by direct owner investment.

| Start-up | |
| Requirements | |
| Start-up Expenses | |
| Domain Name Registration | $15 |
| SSL Encrynption | $100 |
| GeoTrust True Site Certificate | $100 |
| Auction & Classified Software (Xcent) | $800 |
| Legal Fees | $150 |
| Utilitizes | $100 |
| Merchant Account Fees | $200 |
| Computers (2 @ $2000) | $4,000 |
| Programming & Site Development | $50,000 |
| Site Hosting (1st 3 months) | $120 |
| Miscellance Expenses | $1,000 |
| Beta Launch Promotions | $1,000 |
| Search Engine Registration | $100 |
| Total Start-up Expenses | $57,685 |
| Start-up Assets | |
| Cash Required | $2,315 |
| Other Current Assets | $5,000 |
| Long-term Assets | $150,000 |
| Total Assets | $157,315 |
| Total Requirements | $215,000 |
Product Summary
The College Cafe will offer college students a unique blend of products, services, and content that is not offered by any single company on the Internet. The College Cafe will aggregate participants, products, services and content to create a student-to-student marketplace and retail website targeting 15.8 million college students. The following describe The College Cafe’s revenue models:
3.1 Textbook Exchange
The College Cafe will offer functionality to allow students to buy, sell and trade their used textbooks with other students. Specifically, the Textbook Exchange functionality allows students to post their textbooks online for sale or trade, upload images, and indicate the condition of the book. Students looking for used textbooks will be able to search for used textbooks for sale or trade in their local area or nationwide. A fee will be charge for posting textbooks. The fee may vary based on the asking price of the textbook. Sample textbook categories include:
- Accounting
- Business
- Computer Science
- Engineering
- Marketing
- History
- Law
- Physics
- Political Science
3.2 Auctions
The College Cafe will offer a powerful auction package. The Auction functionality will have many features such as Standard, Reverse, Multi Item, Dutch and Blind auctions; Flash Buy and Proxy Bidding. A fee will be charged for posting items to be auctioned. The posting fee structure will be similar to eBay’s. Sample auctions categories include:
- Textbooks
- Class Notes
- Old Tests
- Used CDs & DVDs
- Computer Equipment
- Tickets
- Electronics
- Games
- Dorm Furnishing
3.3 Classifieds
The College Cafe will offer fee based, student targeted, classifieds ads. Here many features such as image upload, Web links and nested categories will be offered. A fee will be charged for posting a classified. The amount charged will be based on the length of time the classified will be posted. Sample classified categories include:
- Textbooks
- Class Notes
- Tutors
- Room Wanted
- For Rent
- For Sale
- Tickets
- Rides
- Help Wanted
- For Hire
3.4 Retail
The College Cafe will sell products targeted to college students. Margins will range from 10% to 50% depending on the product. Sample product categories include:
- Textbooks
- CDs & DVDs
- Computer Equipment
- Electronics
- Games
- Appliances
- Dorm Furnishings
- University Merchandise
- Clothes
- General Merchandise
3.5 Teacher Evaluations
The College Cafe will enable students to post and review teacher evaluations. The teacher evaluation functionality will be a value added service encouraging students to visit the site each semester. Revenue for teacher evaluations will be generated from the sale of banner ad space located within the teacher evaluation pages. Banner ad sales will be targeted toward local businesses on or around campus. The fee for banner ad space will be determined by the length of posting, number of users for teacher evaluations and demand.
3.6 Bloggers
The College Cafe will offer Weblogs (Bloggers) services with topics tailored toward students. Weblog functionality will be a value added service to encourage students to return to the site. Revenue for the Weblog will be generated from the sale of banner ad space located within the Weblog pages. Depending on the Weblog topic, banner ad sales will be targeted toward either local businesses in or around campus or national companies. The fees for banner ad space will be determined by the length of posting, number of users for the Weblog and demand. Weblog topics will include:
- College Sports
- Politics
- Entertainment
- Technology
- News
3.7 Future Products
Overall, we conclude that our current products, services and banner ad strategy will ensure a strong market presence and continued revenue growth. However as part of our growth model, we will regularly examine new services, products, categories and content to support demand.
Brick & Mortar Locations – The College Cafe will evaluate opening retail outlets in proximity to college campuses to support and complement the online presences. Franchise rights may also be available.
Employment Opportunities – The College Cafe will offer a local and national job posting service so that students may search for new opportunities within the local community and nationwide. A fee will be charged for posting jobs.
Apartment Finder – The College Cafe will offer a local and national apartment finder service so that students may search for apartments within the local community and nationwide. A fee will be charged for postings.
Club & Organization Finder – The College Cafe will offer a local and national club and organization finder service so that students may search for clubs and organization within the local community and nationwide. A fee will be charged for posting.
Targeted Content – The College Cafe will offer content. Sample topics will include:
- News
- Wine & Dine
- Weather
- What’s Happening
- Best Of
Market Analysis Summary
The U.S. college student market is a growing yet under-served niche market. The U.S. Department of Education expects the U.S. college student market to grow from 15.8 million students in 2003 to 17.2 million in 2008. According to a Harris Interactive study conducted in the spring of 2002, college students spend an estimated $200 billion dollars per year. As of 2003, it is estimated that college students were spending $1.4 billion online.
John Geraci, Vice President of Youth Research at Harris Interactive concludes: “The college consumer is easily overlooked since most information sources that marketers rely on for tracking consumer behavior tend to under-represent college students. However, it is a consumer group that marketers should recognize as offering substantial opportunity. Connecting with consumers during the college years can pay great dividends, both now and well into the future.”
4.1 Market Growth
According to the findings from the 360 Youth/Harris Interactive College Explorer Study estimated the U.S. college market will spend nearly $200 billion dollars a year.
University Bookstores
The National Association of College Stores estimated U.S./Canadian university bookstore sales to be $11.12 billion for the 2001-2002 academic year and online textbooks sales to be an estimated $1.8 billion. University bookstores sell a variety of items, ranging from textbooks to toothpaste. The following table display the estimate of average product sales in the entire university bookstore market, from largest to smallest segments[1].
| Course materials |
70.67% |
$7.858 billion |
| General/trade books |
3.40% |
$.378 billion |
| Student supplies |
5.49% |
$.611 billion |
| Computer products |
7.63% |
$.849 billion |
| Insignia merchandise |
7.85% |
$.872 billion |
| Other merchandise |
4.96% |
$.552 billion |
| Total |
100% |
$11.12 billion |
Textbooks
The total textbook/course materials market is estimated to be $7.8 billion based on sales data for the 2001-2002 academic year. The textbook market is made up of three segments – new texts, used texts, and custom-published materials(or course packs). The percent of total store sales and estimated market size of each segment is provided below.
| New texts |
54.71% |
$6.1 billion |
| Used texts |
14.86% |
$1.6 billion |
| Course packs |
1.10% |
$0.1 billion |
| Total Course Materials |
70.67% |
$7.8 billion |
Online Retail
Jupiter forecasts that online retail spending in the will grow by 28 percent in 2003 to $52 billion. The research company estimates that by 2007, online retail spending will reach $105 billion and account for five percent of all retail spending. Jupiter estimates that the online retail will grow at an average annual growth rate of 21 percent between 2002 and 2007.
[1] National Association of College Stores (2000-2001)
4.2 Market Trends
The follow statistics indicate that college students are receptive to the Internet channel for the products, services and content offered by the College Cafe. The following U.S. college student statistics were based on a report by the Student Monitor and the Harris Interactive Explorer Study.
- 99% of college students use the Internet
- 93% of college students use the Internet every month
- 72% of college students access the Internet at least daily
- 92% of college students own a computer
- 13% of college students plan on buying a computer in the next year
- 15% of college students indicated they are the first to buy a new tech gadget or device
- Students average 9 hours per week online
Students average 9 hours per week watching TV - Students average 10 hours per week listening to the radio
According to the Harris Interactive Study, college students spend an average of $287 per month on discretionary items (which is defined as spending on anything other than tuition, room/board, rent/mortgage, books/school fees).
Participation/Spending by College Students on Entertainment and Leisure Activities
|
Spending Category |
Projected Yearly Spending (in millions)* |
% Students Participating in Past Year |
| Purchase Videos/DVDs (not including equipment) |
$2,754 |
70% |
| Purchase Music CDs, Tapes, etc. |
$2,746 |
76% |
| Purchase Video Games (not including equipment) |
$2,284 |
37% |
| Vacation Travel |
$4,607 |
61% |
| Purchase reading material (not for use in school) |
$1,009 |
83% |
| Going to Movies |
$887 |
91% |
| Attending Music Concerts |
$791 |
49% |
| Going to an Amusement Park |
$456 |
41% |
Projections based on Spring 2002 360 Youth/Harris Interactive College Explorer Study; this represents a partial list of categories for entertainment and leisure activities.
The National Association of College Stores estimates U.S. college store sales to be $11.12 billion for the 2001-2002 academic year. College stores sell a variety of items, ranging from textbooks to toothpaste.
4.3 Market Segmentation
The following table illustrates the future growth of rate of college students by age group and sex.
SOURCE: U.S. Department of Commerce, Bureau of the Census, Current Population Reports, Series P-25, Nos. 1092, 1095, and “National Population Estimates,” December 2001, and “Annual Projections of the Total Resident Population: 1999 to 2100,” January 2000

4.4 Target Market Segment Strategy
The potential market for The College Cafe consists of 15.8 million college students enrolled in over 4,180 institutions. For the Phase 1 launch of The College Cafe, we plan to focus our marketing effort on a subset market located in the Southeastern U.S. We plan to expand to new markets with a phased approach focusing on a new region of the country each semester. The Phase 1 target market segment will consist of the following universities:
| University/College |
Enrollment |
| Auburn University |
21,505 |
| Clemson University |
16,396 |
| East Carolina University |
18,271 |
| Emory University |
11,300 |
| Florida State University |
30,401 |
| Georgia State University |
23,000 |
| Georgia Tech |
13,800 |
| Miami-Dade Community College |
46,834 |
| Mississippi State University |
15,628 |
| North Carolina State |
28,281 |
| Tulane University |
10,921 |
| University of Alabama |
18,342 |
| University of Florida |
45,114 |
| University of Georgia |
31,280 |
| University of Kentucky |
23,540 |
| University of Miami |
13,651 |
| University of North Carolina |
24,368 |
| University of South Carolina |
25,447 |
| University of Tennessee |
25,401 |
| Total |
419,940 |
Phase 2 will focus on additional colleges and universities located in the southeast with the addition of colleges and universities in the Northeast.
4.5 Competitive Anaylsis
Competitors of The College Cafe includes traditional university bookstores, online textbook retailers, textbook exchange sites, textbook price comparison sites, online auction sites and online content specific sites targeting the college student market.
4.5.1 University Bookstores
The major objective and strategy of university bookstores is to maintain competitive pricing and customer service. The strengths of the traditional university bookstores are current customer relationships and location to the University. The major weaknesses of university bookstores are the limited product selection and lack of value added services that can be offered online.
The National Association of College Stores estimates U.S./Canadian university bookstore sales to be $11.12 billion for the 2001-2002 academic year.
There are approximately 4,840 college bookstores serving 4,182 institutions in the United States and 170 college stores in Canada. Larger universities will often have several stores to serve students, smaller schools in a local area may be served by a single store, and several schools in an urban community may share multiple retail outlets. While many college stores share a common mission, they vary widely in size, location, ownership, and customer base.
The majority of stores are owned or operated by the university they serve. On-campus stores are mostly institutional, but they may also be contract managed, cooperatives, or student associations. Off-campus stores are typically privately owned.
Sales volume in college stores is determined by many factors, but the major influence on sales seems most closely tied to the size of the institution served. According to the NACS College Store Industry Financial Report 2003, average sales per college store were $6,320,556 while the median was $3,303,062. The majority of college stores have less than $1 million in sales each year.
According to the NACS College Store Industry Financial Report 2003, college stores returned a median net income of 7.3% of net sales to their institutions.
NACS Membership by Sales Volume
| Sales Volume in $$ | Member Stores |
| Under $1 million | 57.0% |
| $1 to $3 million | 27.5 % |
| $3 to $7 million | 9.8% |
| Over $7 million | 5.8% |
4.5.2 Online Bookstores & Retail Websites
The major objective and strategy of online competitors is to maintain brand awareness, offer value added services, product selection/availability, order fulfillment and customer service. The strengths of existing online bookstores and retail sites are current customer relationships and brand awareness. The major weaknesses of online competitors is barriers to entry, concern about security & fraud, shipping charges, on-time fulfillment and returns processing.
Based on the 2003 College Store Industry Financial Report, total online sales at university bookstores for 2001-2002 are estimated to be $150 million or 1.41% of total college store sales. With a “click and mortar” strategy, the university bookstore can offer the convenience of web ordering, paired with:
- Ease of returns
- The ability to pick up items for immediate use
- One-stop shopping
- Accurate information on what textbooks students need for their courses
- The trust and security of buying from a well-known source with an on-campus location
The following table lists some of the major independent online retailers not associated with a university bookstore:
| Company | Business Model |
| Amazon.com | Online retailer |
| Barnes & Noble.com | Online retailer |
| Bigwords.com | Allows student to buy and sell textbooks |
| Collegebooksdirect.com | Buys and sells new and used textbooks |
| Collegeclub.com |
Integrated media and ecommerce |
| Ebay.com | Online Auction |
| Ecampus.com | Discount college textbooks Merchandise Limited content |
| Efollett.com | Online textbook retailer Network of university bookstore for brick and mortar presences |
| Half.com | Online Auction |
| JourneyEd.com | Online student discounts on software |
| Lazystudents.com | Online retail – various college market merchandise Online research papers assistance |
| Studentmarket.com | Online retail – various college market merchandise |
| TextbooksDirect.com | Textbook price comparison engine |
| Textbooksource.net | Buys and sells used textbooks Offline buy-back Online sales |
| TextbooksX.com | Buys and sells new and used textbooks |
| Varsitybooks.com | Buys and sells new and used textbooks |
Marketing Strategy
The College Cafe’s customers will be the 15.8 million college students in the United States. This segment is a niche market that has no single business entity accounting for any significant percentage of total aggregated college student purchases.
The main business model for The College Cafe relies on college students providing textbooks, auctions, classifieds and teacher evaluations available on the website. Therefore, our focus will be on the marketing strategy to increase student traffic and usage. In turn, visitor volume and transactions will maintain the inventory of products and services offered.
The College Cafe recognizes the key to success as an extensive promotion strategy to attract users. Once additional funding is secured the advertising and promotion plan will be implemented.
5.1 Strategic Alliances
The College Cafe is looking to form relationships with major companies in the college student market. Companies that we will approach included university merchandise manufacturers or resellers, specialized content suppliers, new and used textbook wholesalers and local businesses.
5.2 Promotion Strategy
The College Cafe’s overall advertising and promotional objectives are to:
- Acquire customers and generate sales.
- Position The College Cafe as the market leader.
- Increase company awareness and brand name recognition among college students.
- Collect market research to create immediate and long-term marketing plans.
5.3 Marketing Programs
The College Cafe will attract customers by using a mixture of traditional and online advertising strategies to create a grassroots marketing campaign.
Since the majority of The College Cafe’s customer acquisition will result from direct promotion local to universities, The College Cafe will recruit current college students to fill positions in the areas of campus marketing, local advertisement sales and implementation of a “grassroots” marketing campaign.
The following is a list of advertising and promotional channels The College Cafe will utilize:
- Posting Flyer in and around campuses
- Direct Mailings
- University and local newspaper advertising and inserts
- Promotional item distribution
- Advertisements at on-campus kiosk
- “Welcome Back to School” registration booths
- “Welcome Back to School” care-package inserts
- Sponsorship of recreational/intermural team sports
- Sponsorships of campus or community events
- University and local newspaper advertising
- Indoor/outdoor billboard advertisements at college sporting events
- Banner ads on select related sites with a significant level of traffic
- Links on related web sites
- Traditional media including direct mailings, magazines, radio and TV
- Registration with all the major search engines
Sourcing
The main business model for The College Cafe relies on college students providing the textbooks, auctions, classifieds and teacher evaluations that are posted on the website. Therefore, our focus relies heavily on the marketing strategy that will increase traffic and usage and, in turn, maintain our inventory of products and services.
For the retail business component we will establish relationships with manufacturers or distributors that offer drop-shipments direct to the customer. This will allow The College Cafe to keep expenses associated with inventory and distribution to a minimum.
We will be contracting students as subject matter experts to provide the content in the weblogs. The use of students as weblog content experts will help keep costs to a minium yet still providing interesting and relevant content.
For content and other value added service we will establish relationships with 3rd party vendors. This will enable The College Cafe to offer a wide variety of products and services online yet allow The College Cafe to focus on the key business elements; textbooks, auctions, classifieds and teacher evaluations.
Services and Technology
The website is designed with the needs of the college student as the focus. The College Cafe is built using Microsoft technologies which will provide the flexibility to easily expand products and service offerings in the future. The College Cafe will initially host the website with an external web-hosting vendor thus reducing initial start-up cost. At a later date, The College Cafe may elect to bring hosting in-house for better support and maintenance.
The Textbook Exchange, Auction, Classified, and User Administration software was purchased from Xcent Software, Inc and modified to support The College Cafe’s business needs. The rights to the source code of the Xcent’s software were included in the purchase price of the software. This will enable our programmers to customize the software to support The College Cafe’s growing business needs.
The College Cafe website and databases are hosted by Atl-Connect Internet Services which guarantees 99.99% uptime. In addition to Web hosting, Atl-Connects provides site monitoring and statistical performance metrics that include uptime, page views, unique users, banner impressions, search keywords stats and link stats from other sites.
Milestones
The accompanying table lists important milestones with dates and managers in charge. The milestone schedule also indicates our initial beta launch of the website at Georgia State University.

Financial Plan
The following are the summarized points from The College Cafe’s financial plan. All charts and tables supporting these results are included in the appendix at the end of the business plan:
- The College Cafe will generate assertive revenues by the end of year one.
- The College Cafe will start reporting sustained profits during the 9th month of the 1st year.
- Sales and profits by year three will top 1.5x that of year one.
- The College Cafe will require an initial investment in capital to finance the marketing campaign and launch strategy.
- The College Cafe will require additional investment to fund additional Web development, sales and marketing efforts and general operating expenses.
The College Cafe will provide a complete student-to-student marketplace. Investment contacts have already been approached and their expressions of satisfaction and encouragement are numerous. We intend to continue our advances with more unique and effective business solutions for the the college market. Based on the attached financial projections, we believe that this venture represents a sound business investment.
9.1 Important Assumptions
The financial projections are based on the following assumptions and facts for the industry as outlined in our market analysis:
- As of 2003, college students spend and estimated $200 billion annually.
- There are over 15.8 million college students.
- The founders have contributed significant capital.
- The fee for posting textbooks will equal $3 per textbook.
- The fee for posting classifieds will equal $5 per classified.
- The sales margin for products sold will average 15% and vary based on product.
9.2 Start-up Funding
In order to implement The College Cafe Phase 1 marketing campaign and launch strategy, we are seeking an initial seed investment of $150,000. An additional investment of $1 million will be required for operational expenses, continuing marketing campaigns, additional website enhancements, maintenance and support as necessary to establish and maintain The College Cafe as the leading online student-to-student market place.
As detailed in the Cash Balance chart for one year, The College Cafe will be able to begin and sustain its operations with the above mentioned investments. We are confident the opportunities in the market place are so compelling that with year one cash flows, The College Cafe will grow and take advantage of the growth in the college market.
9.3 Use of Funds
Initial funding proceeds will be used primarily for marketing, additional website development and maintenance. All the equipment needed will be leased or purchased, and included in the operational expenses. The rest of the funds will be used as working capital to maintain the operations until revenues generated by The College Cafe will be at the point where we can sustain operational expenses.
9.4 Exit Strategy
The financial projections indicate that The College Cafe will have generated enough cash in the next five years to permit the exit of the outside investors if so desired. It is the founders’ choice to continue with the company’s profitable operations until The College Cafe is presented with a viable offer for acquisition or the opportunity of an IPO is contemplated.
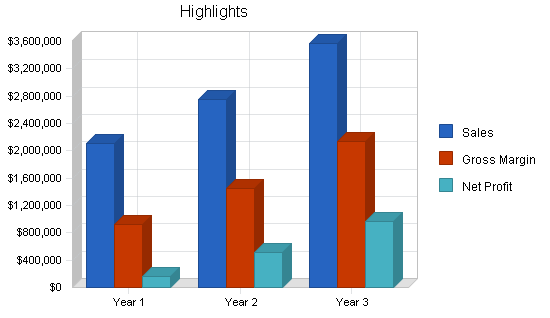
9.5 Key Financial Indicators
The following chart shows changes in key financial indicators: sales, gross margin, and operating expenses.

9.6 Break-even Analysis
A break-even analysis table has been completed on the basis of average costs/prices.

9.7 Sales Forcast
The table and charts below show our forecasts for sales and costs of sales. Annual figures for three years are shown. Monthly estimates for the first year are included in the appendix.


9.8 Personnel Plan
The table below shows our forecasts for personnel. Annual figures for three years are shown. Monthly estimates for the first year are included in the appendix.
9.9 Projected Profit and Loss
The table and charts below present our forecasted for profit and loss. Annual figures for three years are shown. Monthly estimates for the first year are included in the appendix.


9.10 Projected Cash Flow
The table and chart below show our cash flow predictions. Annual figures for three years are shown. Monthly estimates for the first year are included in the appendix.

9.11 Projected Balance Sheet
The table below details our projected balance sheet. Annual figures for three years are shown. Monthly estimates for the first year are included in the appendix.
9.12 Business Ratios
Business ratios for the years of this plan are shown below. Industry profile ratios based on the Standard Industrial Classification (SIC) code 5942.9904, College book stores, are shown for comparison.


