
Bizcomm, Inc
Executive Summary
Introduction
BizComm, Inc. (Bizcomm) creates specialized customer communication products, its strength being specialized generic cards. These cards are for business-to-business communication, as well as business-to-client communication. The core product is a card a business might send to its customers to, for example, thank them for their patronage, or to remind a patient of a checkup.
The focus of this business plan is to put forth objectives to solve the present cash-flow squeeze, and to increase profits from the present break-even level to net profits of $54,650 by the end of the first year. We intend to accomplish this by focusing on modifying our website, repackaging our more popular products for the large retail chains, and to concentrate on our designated target markets.
The Company
Bizcomm’s mission is to provide specialized customer communication products through the mail. These products are either not available at the retail level, or are too expensive if obtained from normal commercial printers.
Bizcomm, through a series of ownership changes, has lost touch with the know-how that is needed to consistently achieve profitable response rates through mail order. Inadequate initial working capital has hamstrung the company’s acquisition of these skills by forcing the owner to resort to commercial printing activity. These setbacks will be remedied according to Bizcomm’s reconfigured market and sales approach.
Bizcomm is a limited liability corporation that is fully owned by one person, Mr. Pullman. Mr. Pullman comes from an office supply background. The knowledge, experience, and contacts accumulated during that period have led to changes in the traditional modus operandi of Bizcomm. Commercial printing work and ad specialties have taken an increasing percentage of Bizcomm’s sales.
At the present time, Bizcomm’s facilities are all located in Bronxville, New York. The space is much larger than present operations would dictate, especially the office space portion, and plans are in place to move the entire operation to Jefferson in September of this year, at the end of the present lease. There are currently less than ten employees of Bizcomm. The growth of the company will be determined by how accurately and efficiently the company is able to implement the facets of this business plan.
The Products
A general description of Bizcomm’s core products would be client communication cards. Cards which, for example, an auto dealer might send to someone who had recently come into the showroom and expressed an interest in his make of car. Bizcomm could personalize the cards with the auto dealer’s logo and could print any special message the dealer wanted. A normal commercial printer cannot compete in this type of work.
Some of the products Bizcomm offers are: Slida-Cards, Cirlo-Cards, Presentation and custom pocket folders, and promotional products such as keychains, pens, etc.
The Market
There is a huge market in the United States for customer communication products, with plenty of profitable business to be had. Nearly 700,000 businesses have been identified as attractive in addition to those market sectors to which Bizcomm has directed its attention. Capturing market share at a profit is definitely achievable.
The company will refocus on a number of key industries that have a high level of consumption of our products. These include banks, insurance companies, funeral homes, doctors/dentists, travel agents and auto dealers. The use of specialty catalogues oriented strictly for these industries will be the tool to create greater market share.
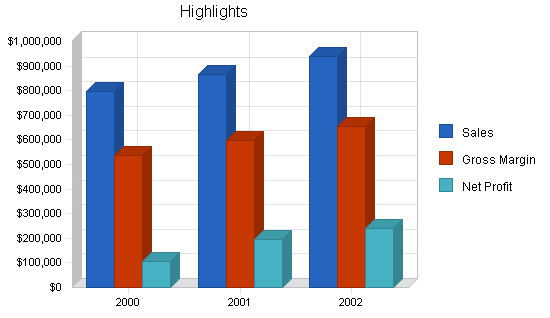
Financial path to Success
With Bizcomm’s refocus on its key industries and the creation of an effective website, the company expects its profits to steadily increase.
Revenues are projected to increase by almost 19% over the next three years, from ~$800,000 to ~$950,000. We expect net profits will increase substantially by year three. Such a large increase in profits is projected because we will be decreasing our marketing and advertising costs by a significant amount and increasing the efficiency of these activities. To implement our marketing changes and maintain sufficient cash, the company will be borrowing $47,000 this year in a short-term loan. Our projected cash flow will increase our cash balance and allow us to leverage this asset to creating new opportunities. During this time, we do not expect any difficulties in maintaining sufficient sales to meet our costs.
1.1 Mission
Bizcomm’s mission is to provide specialized customer communication products through the mail. These products are either not available at the retail level, or are too expensive if obtained from normal commercial printers.
1.2 Keys to Success
There are five generally accepted keys to success in the mail order industry:
- Identify the market.
- Prepare the mail order package.
- Choose the list.
- Test mail.
- Roll out if successful.
There is a huge market in the United States for customer communication products, with plenty of profitable business to be had. Nearly 700,000 businesses have been identified as attractive in addition to those market sectors to which Bizcomm has directed its attention. Capturing market share at a profit is definitely achievable if the above five steps are skillfully executed.
1.3 Objectives
There are four major objectives to this business plan, of which three are immediate and the fourth is of a longer-term nature:
- Solve the present working capital shortage. This will allow some flex space to pursue the more permanent marketing solution expressed in the fourth objective mentioned below. Bizcomm should immediately arrange to factor its accounts receivable. A major lending company has agreed to provide the necessary funding to Bizcomm, on the basis of an 80% advance. The first weekly transaction will take place in the second week of February.
- Modify the Bizcomm website. This will result in more sales; and, with adjustments, the Internet site will increase exposure and will result in even greater sales. Two meetings have already been held with a Web designer. He is convinced that he can completely overhaul Bizcomm’s registration with the major search engines, as well as the Yahoo! Store, which will result in visitors to Bizcomm’s website in large numbers.
- To prepare and package some of Bizcomm’s more popular generic Slida-Card™ products so that they will be accepted by large discount retail chains. By inserting a small brochure inside these retail packets, mail order leads for Bizcomm’s traditional customized offering will result without the high cost of sending out mailers.
- To replace Bizcomm’s shotgun approach to mail order selling of cards to more of a rifle method aimed at one or two targeted industries. Key words: Market Segmentation. This objective must be executed carefully after adequate market research, careful design of the mailer, using the traditional skills of direct mail while considering new technology and trends. Results are not expected to appear until the second and third years of this plan.
Company Summary
Bizcomm, through a series of ownership changes, has lost touch with the know-how that is needed to consistently achieve profitable response rates through mail order. Inadequate initial working capital has hamstrung the company’s acquisition of these skills by forcing the owner to resort to commercial printing activity. These setbacks are the cause for this business plan, and will be remedied according to Bizcomm’s reconfigured market and sales approach.
2.1 Company History
Bizcomm was sold to its present owner in October of 1998, therefore, comparable financial results will not be available until 1999. However, past financial information indicates there is plenty of room for improvement by the company under its new ownership:

- The income tax returns for 1996 show gross sales of $722,635 and an operating loss of $76,470.
- The returns for 1997 show sales of only $476,194 and operating profits of $38,223.
- Contributing to the bottom line improvement during that period, according to the tax returns, was an increase in the gross profit margin from 42% to 64%, and a $70,000 reduction in depreciation, payroll taxes, utilities, insurance and other expenses.
Considering the company was sold in 1998, the improvements on the 1997 tax return might have included a degree of window dressing to achieve a better sales price.
Bizcomm, through several changes in ownership, has lost continuity in respect to the knowledge and experience gained over the years in direct mail. The company, under its present management, cannot continue to engage in expensive mass mailings with any reasonable expectation of quick success. This business plan will put forth other means to expand the company and give it adequate breathing room to again engage in direct mail in a less-hurried, more professionally researched way.
The table varies somewhat from the auditor’s figures of December 31, 1999. For one thing, the current portion of long term debt was removed from current liabilities to avoid problems arising from assuming that all debt technically classified as “current” would be repaid in the current year. Total long-term debt of $271,874 can be broken down by this table below:
| Loan | Percent of Interest | Amount Owed |
| Revolving Credit | 11% | $24,852 |
| Mortgage at | 10.5% | $141,147 |
| Time Note | 11.25% | $20,500 |
| Debt to Former Owner | 8% | $12,500 |
| EDIC Debt | 6% | $72,875 |
| Total Amount Owed | $271,874 |
Depreciation and amortization have been lumped in together. Capital assets include intangibles of $56,406.
Notes payable to stockholder of $26,912 represent money owed to the owner, Mr. Pullman, and do not accrue interest. To more accurately reflect the equity nature of these funds, and for ease of projecting interest charges, this $26,912 has been placed into the capital stock category.

| Past Performance | |||
| 1997 | 1998 | 1999 | |
| Sales | $0 | $0 | $650,546 |
| Gross Margin | $0 | $0 | $489,564 |
| Gross Margin % | 0.00% | 0.00% | 75.25% |
| Operating Expenses | $0 | $0 | $533,537 |
| Collection Period (days) | 0 | 0 | 18 |
| Inventory Turnover | 0.00 | 0.00 | 2.50 |
| Balance Sheet | |||
| 1997 | 1998 | 1999 | |
| Current Assets | |||
| Cash | $0 | $0 | $16,187 |
| Accounts Receivable | $0 | $0 | $58,721 |
| Inventory | $0 | $0 | $99,430 |
| Other Current Assets | $0 | $0 | $2,000 |
| Total Current Assets | $0 | $0 | $176,338 |
| Long-term Assets | |||
| Long-term Assets | $0 | $0 | $226,967 |
| Accumulated Depreciation | $0 | $0 | $43,015 |
| Total Long-term Assets | $0 | $0 | $183,952 |
| Total Assets | $0 | $0 | $360,290 |
| Current Liabilities | |||
| Accounts Payable | $0 | $0 | $91,955 |
| Current Borrowing | $0 | $0 | $0 |
| Other Current Liabilities (interest free) | $0 | $0 | $0 |
| Total Current Liabilities | $0 | $0 | $91,955 |
| Long-term Liabilities | $0 | $0 | $271,874 |
| Total Liabilities | $0 | $0 | $363,829 |
| Paid-in Capital | $0 | $0 | $46,912 |
| Retained Earnings | $0 | $0 | $20,631 |
| Earnings | $0 | $0 | ($71,082) |
| Total Capital | $0 | $0 | ($3,539) |
| Total Capital and Liabilities | $0 | $0 | $360,290 |
| Other Inputs | |||
| Payment Days | 0 | 0 | 30 |
| Sales on Credit | $0 | $0 | $585,491 |
| Receivables Turnover | 0.00 | 0.00 | 9.97 |
2.2 Company Locations and Facilities
At the present time, Bizcomm’s facilities are all located in Bronxville, New York. The space is much larger than present operations would dictate, especially the office space portion, and plans are in place to move the entire operation to Jefferson (nearer to the owner’s residence) in September, 2000, at the end of the present lease. This planned move is expected to bring a reduction of $1,500 in the monthly rent.
2.3 Company Ownership
Bizcomm is a limited liability corporation that is fully owned by one person, Mr. Pullman. Originally, the corporation was named Eric Rutherford Inc., and was operating under the name Bizcomm, Inc. Recently, the corporate name was changed to Bizcomm, Inc. Mr. Pullman comes from an office supply background. The knowledge, experience, and contacts accumulated during that period have led to changes in the traditional modus operandi of Bizcomm. Commercial printing work and ad specialties have taken an increasing percentage of Bizcomm’s sales.
Products and Services
The following subtopics discuss Bizcomm’s products, how these products are produced, and an overview of competitor’s products.
3.1 Product and Service Description
A general description of Bizcomm’s core products would be client communication cards. Cards which, for example, an auto dealer might send to someone who had recently come into the showroom and expressed an interest in his make of car. The card would say something like “Thank you for your visit” or “It was a pleasure serving you.” Bizcomm could personalize the cards with the auto dealer’s logo and could print any special message the dealer wanted. The company maintains a large stock of printed cards which can fairly easily be removed from inventory, have a special logo overprinted on them, and sent off in the mail. A normal commercial printer cannot compete in this type of work.
- Slida-Card®. This makes it possible for a business to personalize a generic “Thank You” card by providing special slits into which a business card can be inserted.
- Cirlo-Card®. These are specially die-cut cards that form the lower section of a fold-over “Thank You” card. The client receiving the card can punch out the die-cut and place it into his Rolodex file.
- Presentation and custom pocket folders, custom stationery and envelopes of various type and size, memo pads, customized shipping labels, etc.
- Another category of products encompasses ad specialty and promotional products (key chains, note cubes, pens, etc.). Bizcomm is a member of the American Society of Indexers (ASI). ASI is an organization that represents thousands of manufacturers of specialty items. These items are depicted and described on DVD where it is possible to search through thousands of items using key words, and then choose items especially suited to a particular industry. These products are a recent addition to the Bizcomm line and have not yet been fully marketed.
3.2 Competitive Comparison
For a competitive comparison of Bizcomm’s core product, the Slida-Card®, the following options are considered:
- Retail Outlets: Here, only a very limited number of generic cards are available, and these are without slits, and are blank inside. A box of 20 “Thank You” cards is available at Staples for $3.29, and are without slits. The design is uninspired and the size is slightly smaller than Bizcomm’s Slida-Card®. The price works out to $164.50 per thousand. Bizcomm sells via mail order out-of-state at $199 per thousand which includes a wider choice of messages, slits for a business card, and offers the addition of a personalized logo for only $15 more (one time set-up charge). Some larger cards, on thicker stock, similar to Bizcomm’s Executive and/or Formal Collection with “Congratulations” and “It Was Good to Meet You” are also available at Staples for $4.74 for 10 cards. This works out to $474 per thousand versus Bizcomm’s price of $359. Again special optional colors, special logos and custom messaging is available from Bizcomm that can’t be offered at the retail level.
- Mail-order Competitor: Rockford, located in nearby Marblehead, offers virtually the same product as Bizcomm’s Slida-Card® for $202 per thousand (slightly higher than Bizcomm’s $199), and a similar Executive card for $312 per thousand versus Bizcomm’s price of $359.
- Do-it-yourself Desk Top Publishing Programs: This method is often tried, but is not very competitive. Ink jet printers can only handle certain paper stock, folding by hand leaves an unattractive result, and it is usually more expensive if one factors in the high cost of ink cartridges.
- Other Competitors: Some catalogs which target a specialized industry offer cards similar to the Executive cards that Bizcomm produces at $490 per thousand, as well as personalized cards of lighter stock (without slits) for $139 per thousand. Competition from this sector is very powerful even given a high price differential.
3.3 Fulfillment
Sourcing is not a major concern for Bizcomm. The cards are manufactured using only ink, paper stock, and envelopes–all of which are available from a number of paper suppliers. Bizcomm has a close relationship with Etheridge Ferry Papers in Livingston, NY. who provides special payment terms which permit Bizcomm to purchase in large quantity to take advantage of attractive pricing while allowing payment term to begin only when a pallet is opened.
Ad specialty and promotional items are supplied by a large number of manufacturers on a drop-ship basis. ASI provides a list of suppliers for any particular ad specialty. If one manufacturer can’t make a delivery, Bizcomm can choose another from the list.
3.4 Technology
Technology has not had a great effect on this business over the past couple decades; however, a new trend in the business is specialized services. Companies with large customer bases can download addresses and names over the Internet and have a host of customer communications out-sourced. A company, such as a furniture retailer, could arrange to have a card automatically sent to every buyer on the first anniversary of the purchase.
Technological advances in electronic mail are also attracting the attention of companies who depend on direct mail for leads. Despite filters against “spam” (unsolicited email) there are ways to reach direct mail targets via email ads. How skillful the direct mailer is in the design of the email message, and how clever he is in skirting the spam filters, can mean substantial profits–especially when coupled with an exciting website.
3.5 Future Products and Services
The main product which Bizcomm has on the drawing board is a catalog especially designed to cater to the needs of a targeted industry. This market segmentation approach is necessary to secure a stable market share of business communication products against invasion by specialty catalogs.
Market Analysis Summary
The overall market for customer communication products is immense. This business plan has identified over seven million businesses that have a potential need to maintain and/or win customers. In reality, all businesses are in need of a product that will enable them to maintain positive customer relations. Bizcomm has the products necessary for this to happen; whether it is a doctor’s office sending reminders to their patients, or a software company sending holiday cards to its clientele, it is imperative for all types of businesses to remain on a personal level with their clients.
4.1 Market Segmentation
Many industries have been heavily marketed in the past by Bizcomm. Some industry sectors, such as insurance companies, and Doctors/Dentists, are targeted with extensive well-established catalogs, making entry by others difficult. The following industry sectors listed under the table heading “Attractive Possibilities” are likely to offer the best opportunity for new territory and market segmentation:
| Industry Sector | Total Businesses |
| Animal Hospitals (Veterinarians) | 55,455 |
| Beauty Salons (Manicurists) | 266,275 |
| Caterers | 44,477 |
| Alternative Medicine | 133,777 |
| Employment Agencies | 40,745 |
| Retailers (Furniture and Jewelry) | 44,352 |
| Health Clubs | 13,579 |
| Interior Decorators | 30,519 |
| Marinas (Boat Yards and Dealers) | 22,915 |
The “Other” category in the Market Analysis table and chart represents the total businesses that have sales of $1,000,000 or less. It is assumed that the very large businesses either are too difficult to reach effectively by direct mail (owner doesn’t see the mail; junk mail is routinely discarded by secretary, etc.), or are so large that they have more sophisticated customer communication products or have their own established printing channels.

| Market Analysis | |||||||
| 2000 | 2001 | 2002 | 2003 | 2004 | |||
| Potential Customers | Growth | CAGR | |||||
| Banks, Credit Unions | -1% | 85,531 | 84,676 | 83,829 | 82,991 | 82,161 | -1.00% |
| Auto Dealers, Funeral Homes | 1% | 105,114 | 106,165 | 107,227 | 108,299 | 109,382 | 1.00% |
| Doctors, Dentists | 2% | 644,232 | 657,117 | 670,259 | 683,664 | 697,337 | 2.00% |
| Travel Agents, Real Estate | 0% | 215,903 | 215,903 | 215,903 | 215,903 | 215,903 | 0.00% |
| Attractive Possibilities | 2% | 691,524 | 705,354 | 719,461 | 733,850 | 748,527 | 2.00% |
| Other | 3% | 5,308,000 | 5,467,240 | 5,631,257 | 5,800,195 | 5,974,201 | 3.00% |
| Total | 2.65% | 7,050,304 | 7,236,455 | 7,427,936 | 7,624,902 | 7,827,511 | 2.65% |
4.2 Target Market Segment Strategy
The largest category is the “Other” category which consists of over five million businesses of $1 million or less. These businesses are too difficult to separate and accurately analyze, however, they are all likely to patronize large retailers because of the pricing systems in place there. The customer communication products presently on the shelves of these retailers are limited.
The specialized market sectors such as banks, insurance companies, and auto dealers have all received marketing attention in the past from Bizcomm. Some of these sectors (insurance agencies, dentists, etc.) have been the targets of market segmentation on the part of comprehensive catalogs that try to present themselves as the “super store” to that industry.
The 700,000 businesses listed as “Attractive Possibilities” are in industries that have not received as much attention via direct mail. The businesses mentioned are likely to be owner-run–a business in which the owner is likely to receive the mail.
4.2.1 Market Needs
Needs have changed significantly in recent years. With the era of computer service, not customer service, it is even more important now for a client to receive a man-made token of appreciation. One can never underestimate the value of a Thank You note.People want to feel like their patronage is important to a business; they want to know that there are people behind the automated customer service engines. This is why Bizcomm is essential to all companies. Bizcomm provides businesses with a means to show their appreciation to their customers. There is something about receiving a Thank You note or reminder about a check-up in the mail. It is real, it is tangible, and it cannot be deleted. Bizcomm creates notes that are heartfelt, elegant, and to-the-point. These notes are a sincere way to extend customer service to the human level.
4.2.2 Market Trends
Traditionally, Bizcomm has sent mailers to various industry sectors. Those receiving the mail offer decide they need the product, and will fill out the form and call in an order. Market trends have moved in the following direction:
- With the increase in the level of “junk” mail it has become increasing difficult to get noticed in the mail.
- Mail costs have increased.
- Competition from market segmentation has increased. In the past, customer communication products were only offered to a wide range of businesses (with some specialization/personalization). Now we see the advent of companies segmenting the market by concentrating on one specialized industry. When that happens, (e.g. insurance agencies, dentists, auto dealerships) direct mail companies with limited offerings of a less-specialized nature are put at a disadvantage.
- Overall competition has increased.
- A growth in the use of the Internet to search for services. With the increase of potential customers resorting to the Internet for their customer communications products, Bizcomm must create an efficient website.
4.2.3 Market Growth
The market for customer base development products is expected to grow. Increased competition for purchasing dollars will fuel this growth. Despite the revolution in technology, the effect of a customer receiving a Thank You note in the mail is still an elegant way to say your patronage is appreciated. Customer loyalty is built this way, and no suitable alternatives are in sight.
4.3 Service Business Analysis
In industries where the product purchased is very similar to products offered by the competition (such as auto insurance, or the booking of an airline ticket), businesses have long recognized the importance of finding economic tools to win and maintain customers. Where a business cannot offer a price savings or some other clearly recognized advantage, customer communication products have proven useful. Below is a list of situations in which a doctor or a dentist might use a customer communication product:
- Patient Acquisition: To attract a new resident to the practice. From a list of new residents to the town.
- Welcome Patients: Make a good first-visit impression by sending a warm welcome card.
- Promotional gifts: Keep patients coming back by sending them home with reminders of the practice (pens, magnets, etc.).
- Recall Card: After six months, send a recall card.
- Reminder Notices: To avoid missed appointments.
- Thanks for Referral: A simple gesture that goes a long way.
- Reactivate: Be able to know when a customer stops coming and inform them that they are missed.
As simple as it may be, this method of communication has an important effect on the bottom line: People want to give their business to those who appreciate it. Skillful use of these products will bring in business equal to a thousand times their cost.
Traditionally, these business communication products have been offered via direct mail. Bizcomm has been offering these products to a broad spectrum of businesses for years. The products of these companies have been relatively generic. That is to say that the cards have a simple message like “Thank You” which can be used by a long list of businesses. Slits in the cards to hold a business card help to personalize it and adding a company logo (at a slight additional charge) will personalize it further. The degree of success enjoyed by companies selling these products is closely related to their skill at direct mailing. Choosing lists carefully, running purges to eliminate doubles, carefully designing the marketing letter (as well as the envelope), including coupons, samples, design of the order form, etc. are all important factors. Companies that sell these generic products (with some customizing) over a broad spectrum of industries are probably viewed alike by those on the receiving end of the direct mail; according to Bizcomm telemarketers, they often get phoned-in orders with Rockford’s product codes.
Another method of selling customer-base management/client communication products is a method used by the specialty catalogues. Instead of taking a shotgun approach (i.e. mass mailings to many industries), they concentrate on one industry. They put together a comprehensive catalog of all products that the industry might need. The catalog will include marketing tools, such as printed brochures. Their offering of client communication post cards will have a marketing theme, as will their letterhead, and presentation folders. Bizcomm will be viewed as being the push cart with only a few products; and it would be very difficult for any competitor to gain entry once a “supermarket” had been established to serve a particular industry’s special needs. Therefore, Bizcomm must focus its attention on more profitable market segments.
4.3.1 Main Competitors
The competition for this market is fierce because of customer loyalty. Once a business decides to go with a certain card company, it is extremely difficult for another card company to break in to that business. Therefore, Bizcomm must renew its effort to regain its old clientele from Rockford.
Bizcomm’s main competitor is Rockford, this is because their products are virtually identical. Their approach is broad spectrum (as has been Bizcomm’s). This is a healthy competition, with equal spoils going to both competitors. Bizcomm has taken an edge over their competitor because of the ability of the company to do its own printing. Rockford cannot make this claim. This enables Bizcomm to promise–and deliver–quick shipments of accurate orders. There is one less step for Bizcomm to go through when processing an order. As a result, there will be fewer mistakes and more responsible customer service.
Strategy and Implementation Summary
The primary focus for Bizcomm’s marketing strategy must be to increase sales and profitability in its core card business quickly without resorting to the expense of direct mail flyers that have not been thoroughly market-tested. This can be achieved by gaining entry into the large business supply retailers, and to take the necessary steps to make Bizcomm’s website a useful sales generating tool.
5.1 Competitive Edge
The advantages Bizcomm has over the competition are numerous:
- Bizcomm does its own printing. Rockford has it all done by outside printers.
- Bizcomm has an Internet site as well as an online store (www.Bizcomm.com).
- Bizcomm has a multitude of unused printing capacity: there is an unlimited amount of growth potential. Sales to the large retailers can be arranged quickly (within 60 days) without a great outlay in retooling or developmental costs. Bizcomm must also utilize fully its slight head-start in the internet. The expertise needed to create an interesting website is readily available from a number of consultants. There is a good chance that, by getting a lead on the pack early with a dynamic Internet store and web address, many leads generated by mass mailings sent out by competitors could materialize as purchase orders passed on to Bizcomm over the Internet.
- Bizcomm also owns two trademarks: Slida-Card ®, and Cirlo-Card®. Both of which should be leveraged.
5.2 Marketing Strategy
The first strategic move for Bizcomm must be to improve its website. An amount of $5,000 has been set aside for this purpose. A contract will be signed by the end of February, 2000, with completion due by the end of April in that same year. Assume 50% payable at signing and the rest upon completion. The site must have a shopping cart capability to allow on-line secured credit card transactions. Bizcomm’s in-house designer has had some formal training in this type of work, and should be able to cooperate effectively with the person chosen to construct the site.
It is essential that care be taken to cause the most important search engines to find Bizcomm’s website using a variety of key words. Multiple hostings are likely to be necessary to accomplish this. Similar skill needs to be undertaken to bring many more visitors to Bizcomm’s site from the online store.
While the above work is being done, Bizcomm must immediately take steps to enter the retail market with several of Bizcomm’s most popular Slida-Card® products. There are more than five million small businesses in the United States with sales of $1 million or less. These five million businesses are in addition to the industries that are normally targeted by Bizcomm and its competitors. An initial brief investigation of the retail shelves at large discounters indicate that this level of retail is appropriate for these limited products. To dedicate the proper time and effort to this launch, $5,000 has been ear-marked for a consultant who will research the appropriate outlets and put together prototypes of attractively packaged cards, working in conjunction with Bizcomm’s in-house designer. The consultant will need a full month to handle the project and get the finished packets in front of the right people. Sales are expected to begin in April (90,000 cards monthly). This is not overly ambitious considering the size of the potential market. Unattractive cards, without business card slits, are presently on the shelves aimed at this very market. Since Bizcomm can print its own cards, this gives Bizcomm an advantage over the competition. The important thing to remember in this market strategy is that the first one to devote the time and effort to the large discounters is likely to shut out the competition. Another important aspect of this retail launch is the residual effect of extensive retail sales. The brand name, Slida-Card®, will gain greater exposure, and Bizcomm can insert a small leaflet that informs the buyer of other available products. Here, Bizcomm can list in a brief, attractive way the customized options that are available, and give phone numbers and refer to the website. The advantages of this manner of reaching the interested businessman are many:
- Unlike leaflets sent out through direct mail mass mailings, every leaflet will get seen by a buyer who has just bought our generic product. This is exactly the person Bizcomm wants to speak with when offering the various personalized custom products.
- There are no mailing costs, address label costs, etc., to get that leaflet out.
- The greater the volume of retail packets sold, the greater the distribution of the individual cards in those packets. Bizcomm has its name and logo on the back of each one. This means increased likelihood of new leads in the form of visitors to Bizcomm’s website.
The above advantages far out-weigh any fears that the large retailer may eventually squeeze Bizcomm on price. Even if Bizcomm were to break even on the retail card packets, the leads generated from them will be substantial.
A longer-term market strategy will require some extensive research to locate at least one business communication market sector that is at present:
- Attractive in terms of its size and reach via targeted lists.
- Interesting and varied in terms of its specialized needs.
- Not already heavily served (market-segmented).
After locating the perfect market sector the task then becomes to design and structure specialized business communication solutions, specialized printing needs, and ad specialties targeted to this market sector(s) in such a concentrated and thorough way that “generic” business communication products will not have a chance to compete.
5.2.1 Distribution Strategy
Apart from distributing Bizcomm’s products (only a few popular generic Slida-Cards®) in the retail market, other new channels will be considered on an on-going basis. Bizcomm could, without a great deal of expense, get a brochure together for distribution to ad specialty dealers. There are 17,000 of these dealers. A limited mailing will be done to test the waters first.
In performing the research to locate an ideal market sector, ripe for market segmentation specialization, Bizcomm will keep an eye peeled for publications that already cater to specialized markets. This will help the company know what is attractive to customers.
5.2.2 Marketing Programs
The specific marketing programs discussed in this plan are:
- Immediate conclusion of a consulting contract to design Bizcomm’s dynamic website. Estimated budget $5,000. Time for completion: six weeks.
- Immediate action to market several Slida-Cards® for the retail market. Concept, packaging, researching outlets, etc. Budget for consultant: $5,000. Time for completion: six weeks.
- Direct mail marketing program. A well-researched marketing study to locate one or two attractive industry sectors which are ripe for market segmentation. Should include a reasonable number of dedicated designs for card faces as well as messages. Specialization in respect to stationery letterhead, name cards, etc. Ad specialties need to be carefully chosen to speak to the chosen industry sector. Budget $15,000. Time for completion: Fall 2000.
5.2.3 Pricing Strategy
Pricing strategy does not appear to be a major consideration. Management, who determine prices, will listen to the opinions of the telemarketers who are more likely to know when Bizcomm is at a disadvantage in respect to the competition.
5.3 Sales Strategy
Bizcomm has a telemarketing department that operates satisfactorily. Each member is adept at making sales. Once this plan’s market programs are installed, closing sales deals over the phone will be much more efficient, and there will be many orders to come through the website.
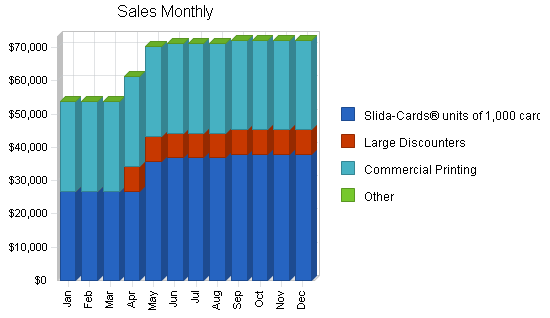
5.3.1 Sales Forecast
To simplify sales projections, we will project only three items: The core business in the form of mail-order Slida-Card®; the same product sold via large discounters (BJ’s, Cosco, Staples); and Commercial Printing.
Slida-Card®: This core business, generated by telemarketers and mail-order, has various price levels beginning at $89.50 for 125 cards and extending to $369 for 2,000 cards. The price per card varies widely from $.71 per card down to $.18 per card. Historically about 10% of sales are 125 counts, 10% are in 250 counts, 40% in 1,000 counts and the remaining 40% in other counts. For the sake of ease of projections we will assume that all sales in this core business are in 1,000 counts ($0.199 per card). In line with recent monthly sales figures we begin by projecting monthly sales (January-April 2000) at 135 units of 1,000 cards at $199 per unit (zero growth rate).
Beginning in May, 2000 positive results should appear from the website, the improvements made to the Yahoo! Store, and from leads for custom cards generated by the retail sales. It is not easy to predict how many inquiries for custom cards will be generated by the purchase of 150 retail packets of 20 cards daily. However, all of these buyers are purchasers of the product. It seems reasonable that a much larger percentage will result in a custom card order than could be hoped for from a blind mailer. Assume one order of 1,000 custom cards will result from the sale of every 150 retail packets. This means sales of 30 units a month (1,000 equals 1 unit). Results from the improved website and Yahoo! Store are also very difficult to predict. Assume another 15 units per month beginning in May 2000, increasing to 20 in June, and again to 25 in September as more orders for custom cards are fed by the retail packet leaflets.
Costs of materials per unit are as follows:
- 70 pound card material (Carnival 21.5 X 33 from Etheridge Ferry) : $72.30 per 1,000 sheets for ivory; $70.15 per 1,000 sheets for white.
- Eight cards can be cut from each sheet = 8,000 cards for $70 or $72 comes to approximately $.009 per card or $9.00 per thousand.
- Envelopes are $9.85 per thousand (also from Etheridge Ferry).
- The outer carton, holding 1,000 cards, costs $0.60.
- The total material cost comes to $19.50 ($9.00+$9.85+$.60+$.05).
Large Discounters: Retail packets of 20 cards and envelopes will be produced and priced to sell at the retail level @ $3.29, and to wholesale to large discounters at $1.65 which works out to be $82.50 per thousand cards. Sales will begin in April, 2000 at a rate of 3000 cards daily or 90,000 per month. The cards will be sold in packets of 20 cards which works out to only five packets per day in 30 outlets.
The same basic costs of material apply here ($19.50 per 1,000), but there will be additional packaging costs from shrink-wrapping each packet of 20 cards, as well as some special handling. This handling and processing will be done by an outside service provider (Goodwill Industries, the ARC, or other similar organization). A generous allowance of $1.50 per 1,000 cards will be assumed. Total material costs per 1,000 cards = $21.00.
Commercial Printing: Commercial printing work is, at the time of this writing, averaging about $27,000 monthly. Some of this work is handled on Bizcomm’s own printing presses, but the majority of it is farmed out to other printers. Assume this level will continue initially. Sales level at $27,000 monthly. Gross profit varies widely from 70% profit on the small jobs to 35% gross profit on the large jobs. Assume large jobs represent 50% of the total. Units don’t apply here. Assume one unit per month of $27,000 with a material cost of $12,825 (weighted average of 47.5%).

| Sales Forecast | |||
| 2000 | 2001 | 2002 | |
| Unit Sales | |||
| Slida-Cards® units of 1,000 cards | 2,035 | 2,280 | 2,525 |
| Large Discounters | 810 | 1,080 | 1,350 |
| Commercial Printing | 12 | 12 | 12 |
| Other | 0 | 0 | 0 |
| Total Unit Sales | 2,857 | 3,372 | 3,887 |
| Unit Prices | 2000 | 2001 | 2002 |
| Slida-Cards® units of 1,000 cards | $199.00 | $199.00 | $199.00 |
| Large Discounters | $82.50 | $82.50 | $82.50 |
| Commercial Printing | $27,000.00 | $27,000.00 | $27,000.00 |
| Other | $0.00 | $0.00 | $0.00 |
| Sales | |||
| Slida-Cards® units of 1,000 cards | $404,965 | $453,720 | $502,475 |
| Large Discounters | $66,825 | $89,100 | $111,375 |
| Commercial Printing | $324,000 | $324,000 | $324,000 |
| Other | $0 | $0 | $0 |
| Total Sales | $795,790 | $866,820 | $937,850 |
| Direct Unit Costs | 2000 | 2001 | 2002 |
| Slida-Cards® units of 1,000 cards | $19.50 | $19.50 | $19.50 |
| Large Discounters | $21.00 | $21.00 | $21.00 |
| Commercial Printing | $12,825.00 | $12,825.00 | $12,825.00 |
| Other | $0.00 | $0.00 | $0.00 |
| Direct Cost of Sales | |||
| Slida-Cards® units of 1,000 cards | $39,683 | $44,460 | $49,238 |
| Large Discounters | $17,010 | $22,680 | $28,350 |
| Commercial Printing | $153,900 | $153,900 | $153,900 |
| Other | $0 | $0 | $0 |
| Subtotal Direct Cost of Sales | $210,593 | $221,040 | $231,488 |
5.4 Milestones
The following table shows some key milestones.
| Milestones | |||||
| Milestone | Start Date | End Date | Budget | Manager | Department |
| Web Site Design | 2/28/2000 | 2/28/2000 | $5,000 | Cathy | Design |
| Retail launch | 3/31/2000 | 3/31/2000 | $5,000 | Outside cons | Marketing |
| Market Sector Research | 10/30/2000 | 10/30/2000 | $15,000 | ABC | Marketing |
| Other | 1/1/1998 | 1/1/1998 | $0 | ABC | Department |
| Totals | $25,000 | ||||
Management Summary
The new management of Bizcomm is not of a direct mail background. The specialized expertise needed to consistently conduct mass mailing and predict the results will need to be built prior to launching the recommended new direct mail marketing program planned for October 30, 2000.
6.1 Personnel Plan
There are currently less than ten employees of Bizcomm. The growth of the company will be determined by how accurately and efficiently the company is able to implement the facets of this business plan.
Each member of the Bizcomm team is highly valued; everyone is expected to have opinions, as it is a team that will make this company excel. It is the mission of the company to employ people who are committed to a high standard of excellence, who thrive on a team atmosphere, and who have outstanding customer service skills. This idealism is represented by the current staff, and will continue to be the guideline by which new team members are hired.
| Personnel Plan | |||
| 2000 | 2001 | 2002 | |
| Production Personnel | |||
| Production Manager -Frank | $49,920 | $49,920 | $49,920 |
| Assistant | $0 | $0 | $0 |
| Other | $0 | $0 | $0 |
| Subtotal | $49,920 | $49,920 | $49,920 |
| Sales and Marketing Personnel | |||
| Telemarketer – Sadie | $6,828 | $6,828 | $6,828 |
| Telemarketer- Jennie | $8,316 | $8,316 | $8,316 |
| Telemarketer- Jack | $16,380 | $16,380 | $16,380 |
| Other | $0 | $0 | $0 |
| Subtotal | $31,524 | $31,524 | $31,524 |
| General and Administrative Personnel | |||
| General Manager – Francis Pullman | $64,992 | $64,992 | $64,992 |
| Art Designer – Vie | $30,000 | $30,000 | $30,000 |
| Secretary – Jonathon | $27,036 | $27,036 | $27,036 |
| Other | $0 | $0 | $0 |
| Subtotal | $122,028 | $122,028 | $122,028 |
| Other Personnel | |||
| Name or title | $0 | $0 | $0 |
| Other | $0 | $0 | $0 |
| Subtotal | $0 | $0 | $0 |
| Total People | 7 | 7 | 7 |
| Total Payroll | $203,472 | $203,472 | $203,472 |
Financial Plan
The following subtopics help present the financial plan for Bizcomm.
7.1 Break-even Analysis
The following table and chart show our Break-even Analysis.

| Break-even Analysis | |
| Monthly Units Break-even | 146 |
| Monthly Revenue Break-even | $40,601 |
| Assumptions: | |
| Average Per-Unit Revenue | $278.54 |
| Average Per-Unit Variable Cost | $73.71 |
| Estimated Monthly Fixed Cost | $29,857 |
7.2 Projected Profit and Loss
The Profit and Loss expenses are summed up below:
- Rent: Rent in Bronxville is split between the factory area and the office area. For the factory, the lease amount is $1,688.80 plus an operations and maintenance fee of $475. For the office area, the lease amount is $1,520.51 plus an operations and maintenance fee of $259. Total comes to $3,943.31. The present lease is up at the end of August, 2000. Beginning September 1, 2000 a move is planned to Jefferson to a smaller facility costing no more than $2,500 per month.
- Depreciation: Depreciation of printing equipment is straight-line over 7 years. Depreciation of computers is over five years. Total provision for depreciation comes to $37,250 annually, or $3,104 monthly. In addition, intangibles (Goodwill, Non-Compete, and some organization charges) are being amortized at an annual rate of $4,348 or $362 monthly. Added together these non-cash charges come to $3,466 monthly.
- Contract Labor: One contract laborer works at $11/hour (30 hrs weekly) = $1430 per month, and another contract worker is putting in 25 hours weekly @ $15/hr = $1,625 monthly. Combined, contract labor equals $3,055.
- Telemarketing Commissions: Only one telemarketer receives commissions of 10% on sales which she generates (12% if she convinces the customer to pay cash). These commissions have traditionally been running about $500 every two weeks ($1,000 per month).
- Utilities: A security alarm system costing $25/month. Electricity averages $366/monthly. Poland Springs water $20/month. Total comes to $411 per month.
- Telephone: There is one cell phone costing about $120 per month. The company’s normal phone bill comes to approximately $850 per month. Total $970 monthly.
- Medical and Dental: Single Blue Cross Blue Shield is $219, family plan runs $619. Company pays 60% for 4 singles, 100% for 1 single and 100% for 2 family plans. Total monthly is $1,982.60 for medical. Dental runs $23 for a single and $68 for the family plan. Company will pay 50% for 1 family plan and 4 singles and 100% for one family and one single. Total for dental comes to $171.
- Insurance: Manager’s life insurance is $140 per quarter. Workers’ Compensation and liability comes to $200 monthly. Auto insurance comes to $250 monthly for the two vehicles. Total monthly is $496.66.
- Leased Vehicles: The company leases two vehicles–one from Ford Credit @ $531.33 and one from Key Bank @ $453.70. Total monthly comes to $985.03.
- Payroll Services: The company uses the services of PAYMEX. Cost is approximately $168 monthly.
- Internet Services: The company pays $22.50 monthly to ShoreNet for Internet connection, $100/monthly to Yahoo! Store, and $75 monthly for Web hosting. Total monthly Internet services come to $197.50.
- Postage: Normal postage (does not include special promotional mailings) will cost approximately $950 per month.


| Pro Forma Profit and Loss | |||
| 2000 | 2001 | 2002 | |
| Sales | $795,790 | $866,820 | $937,850 |
| Direct Cost of Sales | $210,593 | $221,040 | $231,488 |
| Production Payroll | $49,920 | $49,920 | $49,920 |
| Industrial rags | $264 | $264 | $264 |
| Total Cost of Sales | $260,777 | $271,224 | $281,672 |
| Gross Margin | $535,014 | $595,596 | $656,179 |
| Gross Margin % | 67.23% | 68.71% | 69.97% |
| Operating Expenses | |||
| Sales and Marketing Expenses | |||
| Sales and Marketing Payroll | $31,524 | $31,524 | $31,524 |
| Travel | $0 | $0 | $0 |
| Miscellaneous | $0 | $0 | $0 |
| Advertising/Promotion | $25,000 | $0 | $0 |
| Telemarketing commissions | $12,000 | $12,000 | $12,000 |
| Internet Services: | $2,370 | $2,370 | $2,370 |
| Total Sales and Marketing Expenses | $70,894 | $45,894 | $45,894 |
| Sales and Marketing % | 8.91% | 5.29% | 4.89% |
| General and Administrative Expenses | |||
| General and Administrative Payroll | $122,028 | $122,028 | $122,028 |
| Sales and Marketing and Other Expenses | $0 | $0 | $0 |
| Depreciation | $41,592 | $41,592 | $41,592 |
| Leased Vehicles: | $11,820 | $11,820 | $11,820 |
| Utilities | $4,932 | $4,932 | $4,932 |
| Insurance | $5,964 | $5,964 | $5,964 |
| Medical and Dental: | $25,848 | $25,848 | $25,848 |
| Telephone | $11,640 | $12,000 | $12,000 |
| Retirement Acct (P. Vitale): | $3,600 | $3,600 | $3,600 |
| Payroll Services: | $2,016 | $2,016 | $2,016 |
| Postage | $11,400 | $11,400 | $11,400 |
| Rent | $41,544 | $30,000 | $30,000 |
| Payroll Taxes | $0 | $0 | $0 |
| Other General and Administrative Expenses | $0 | $0 | $0 |
| Total General and Administrative Expenses | $282,384 | $271,200 | $271,200 |
| General and Administrative % | 35.48% | 31.29% | 28.92% |
| Other Expenses: | |||
| Other Payroll | $0 | $0 | $0 |
| Consultants | $0 | $0 | $0 |
| Contract/Consultants | $5,000 | $0 | $0 |
| Total Other Expenses | $5,000 | $0 | $0 |
| Other % | 0.63% | 0.00% | 0.00% |
| Total Operating Expenses | $358,278 | $317,094 | $317,094 |
| Profit Before Interest and Taxes | $176,736 | $278,502 | $339,085 |
| EBITDA | $218,328 | $320,094 | $380,677 |
| Interest Expense | $36,688 | $19,185 | $15,885 |
| Taxes Incurred | $34,978 | $64,829 | $82,146 |
| Net Profit | $105,070 | $194,487 | $241,053 |
| Net Profit/Sales | 13.20% | 22.44% | 25.70% |
7.3 Projected Cash Flow
The Cash Flow table and chart are summarized below:
Long-term Debt Repayments: There are, at present, three loans at the Beverly National Bank that can be considered as “long-term” despite the maturity schedule:
- Note 200: This is a revolving line of credit. Outstandings as of year end 1999 come to $24,852.12. The rate is Wall Street Journal plus 2.5%. Presently the rate is 11%. Repayment is not included in cash flow projections 2000-2002.
- Note 201: This is a mortgage loan secured by all assets of the company as well as the owner’s personal home in Jefferson. Originally, the loan amount was $153,000. Present outstandings as of year end 1999 are $141,147.40. Interest rate is fixed at 10.5%. This loan is being repaid monthly in payments of principle and interest of $2,064.51. This loan carries a final maturity of September 29, 2001, however, it is understood that borrower and lender would look at market rates at that time and decide how to restructure the mortgage. The principle portion of the payment for January 2000 is $825 and increases monthly by about $7.00. We will assume that this repayment schedule will continue unchanged (principle portion to increase $7.00 monthly) after rescheduling on September 29, 2000. Principle repayments on this mortgage total $10,362 in 2000, $10,446 in 2001, and $10,530 in 2002.
- Time Note: Originally this amounted to $35,250. Present outstandings are $20,500 due January 7, 2000 and bearing an interest rate of 11.25%. It is assumed that the owner will be successful in rolling over this note. Repayment is not included in the cashflow projections 2000-2002.
In addition to the bank debt, there is $12,500 in principle outstanding on an original $30,000 loan to the seller of Bizcomm, Inc. This is being repaid at the rate of $1,250 monthly and carries an interest rate of 8%.
Also included in reduction in long-term liabilities are repayments due monthly to EDIC. Original loan was $75,000 to be repaid at the rate of $2,083 in principle monthly plus 6% interest. Present outstandings in the EDIC loan include some accumulated interest due to back-due payments. We will assume that from the first of 2000, the monthly payments are met, but that the arrears payments are not caught up. Final maturity will be September, 2002.
The EDIC principle repayments each month added to the repayments to the previous owner of the company amount to $3,333 for the first ten months of 2000, after which the debt to the previous owner is fully repaid. Thereafter, $2,083 principle repayment monthly on the EDIC loan will continue through September of 2002.
Short-term Debt: It is expected that Bizcomm will secure a loan from 80% of outstanding accounts receivable in February. This $46,752 shows up as Short-term Debt which is repaid as soon as possible due to its high cost. Due to the high interest rate built in to these funds, they have been reduced as soon as cash flow permits. They are totally repaid by the end of year 2000.

| Pro Forma Cash Flow | |||
| 2000 | 2001 | 2002 | |
| Cash Received | |||
| Cash from Operations | |||
| Cash Sales | $0 | $0 | $0 |
| Cash from Receivables | $712,449 | $854,140 | $925,170 |
| Subtotal Cash from Operations | $712,449 | $854,140 | $925,170 |
| Additional Cash Received | |||
| Sales Tax, VAT, HST/GST Received | $0 | $0 | $0 |
| New Current Borrowing | $46,752 | $0 | $0 |
| New Other Liabilities (interest-free) | $0 | $0 | $0 |
| New Long-term Liabilities | $0 | $0 | $0 |
| Sales of Other Current Assets | $0 | $0 | $0 |
| Sales of Long-term Assets | $0 | $0 | $0 |
| New Investment Received | $76,000 | $0 | $0 |
| Subtotal Cash Received | $835,201 | $854,140 | $925,170 |
| Expenditures | 2000 | 2001 | 2002 |
| Expenditures from Operations | |||
| Cash Spending | $203,472 | $203,472 | $203,472 |
| Bill Payments | $423,946 | $427,570 | $450,728 |
| Subtotal Spent on Operations | $627,418 | $631,042 | $654,200 |
| Additional Cash Spent | |||
| Sales Tax, VAT, HST/GST Paid Out | $0 | $0 | $0 |
| Principal Repayment of Current Borrowing | $46,752 | $0 | $0 |
| Other Liabilities Principal Repayment | $0 | $0 | $0 |
| Long-term Liabilities Principal Repayment | $47,858 | $35,442 | $35,526 |
| Purchase Other Current Assets | $0 | $0 | $0 |
| Purchase Long-term Assets | $0 | $0 | $0 |
| Dividends | $0 | $0 | $0 |
| Subtotal Cash Spent | $722,028 | $666,484 | $689,726 |
| Net Cash Flow | $113,172 | $187,656 | $235,444 |
| Cash Balance | $129,359 | $317,015 | $552,460 |
7.4 Business Ratios
The following table outlines some of the more important ratios from the Other Commercial Printing industry. The final column, Industry Profile, details specific ratios based on the industry as it is classified by the Standard Industry Classification (SIC) code, 2759 (NAICS Code 323119).
| Ratio Analysis | ||||
| 2000 | 2001 | 2002 | Industry Profile | |
| Sales Growth | 22.33% | 8.93% | 8.19% | 9.85% |
| Percent of Total Assets | ||||
| Accounts Receivable | 32.58% | 25.97% | 20.84% | 26.60% |
| Inventory | 4.65% | 3.57% | 2.77% | 8.47% |
| Other Current Assets | 0.46% | 0.34% | 0.25% | 28.27% |
| Total Current Assets | 67.35% | 83.09% | 92.63% | 63.34% |
| Long-term Assets | 32.65% | 16.91% | 7.37% | 36.66% |
| Total Assets | 100.00% | 100.00% | 100.00% | 100.00% |
| Current Liabilities | 7.91% | 5.91% | 4.63% | 25.65% |
| Long-term Liabilities | 51.37% | 31.65% | 19.05% | 21.72% |
| Total Liabilities | 59.29% | 37.56% | 23.68% | 47.37% |
| Net Worth | 40.71% | 62.44% | 76.32% | 52.63% |
| Percent of Sales | ||||
| Sales | 100.00% | 100.00% | 100.00% | 100.00% |
| Gross Margin | 67.23% | 68.71% | 69.97% | 37.54% |
| Selling, General & Administrative Expenses | 56.91% | 48.91% | 46.56% | 11.38% |
| Advertising Expenses | 0.00% | 0.00% | 0.00% | 0.82% |
| Profit Before Interest and Taxes | 22.21% | 32.13% | 36.16% | 2.23% |
| Main Ratios | ||||
| Current | 8.51 | 14.06 | 20.00 | 2.03 |
| Quick | 7.93 | 13.46 | 19.40 | 1.56 |
| Total Debt to Total Assets | 59.29% | 37.56% | 23.68% | 55.90% |
| Pre-tax Return on Net Worth | 78.89% | 69.71% | 52.72% | 4.93% |
| Pre-tax Return on Assets | 32.12% | 43.52% | 40.23% | 11.17% |
| Additional Ratios | 2000 | 2001 | 2002 | |
| Net Profit Margin | 13.20% | 22.44% | 25.70% | n.a |
| Return on Equity | 59.18% | 52.28% | 39.32% | n.a |
| Activity Ratios | ||||
| Accounts Receivable Turnover | 5.60 | 5.60 | 5.60 | n.a |
| Collection Days | 58 | 62 | 63 | n.a |
| Inventory Turnover | 6.27 | 10.65 | 10.63 | n.a |
| Accounts Payable Turnover | 10.62 | 12.17 | 12.17 | n.a |
| Payment Days | 34 | 30 | 29 | n.a |
| Total Asset Turnover | 1.83 | 1.45 | 1.17 | n.a |
| Debt Ratios | ||||
| Debt to Net Worth | 1.46 | 0.60 | 0.31 | n.a |
| Current Liab. to Liab. | 0.13 | 0.16 | 0.20 | n.a |
| Liquidity Ratios | ||||
| Net Working Capital | $259,187 | $459,824 | $706,943 | n.a |
| Interest Coverage | 4.82 | 14.52 | 21.35 | n.a |
| Additional Ratios | ||||
| Assets to Sales | 0.55 | 0.69 | 0.86 | n.a |
| Current Debt/Total Assets | 8% | 6% | 5% | n.a |
| Acid Test | 3.81 | 9.06 | 14.90 | n.a |
| Sales/Net Worth | 4.48 | 2.33 | 1.53 | n.a |
| Dividend Payout | 0.00 | 0.00 | 0.00 | n.a |
Appendix
| Sales Forecast | |||||||||||||
| Jan | Feb | Mar | Apr | May | Jun | Jul | Aug | Sep | Oct | Nov | Dec | ||
| Unit Sales | |||||||||||||
| Slida-Cards® units of 1,000 cards | 0% | 135 | 135 | 135 | 135 | 180 | 185 | 185 | 185 | 190 | 190 | 190 | 190 |
| Large Discounters | 0% | 0 | 0 | 0 | 90 | 90 | 90 | 90 | 90 | 90 | 90 | 90 | 90 |
| Commercial Printing | 0% | 1 | 1 | 1 | 1 | 1 | 1 | 1 | 1 | 1 | 1 | 1 | 1 |
| Other | 0% | 0 | 0 | 0 | 0 | 0 | 0 | 0 | 0 | 0 | 0 | 0 | 0 |
| Total Unit Sales | 136 | 136 | 136 | 226 | 271 | 276 | 276 | 276 | 281 | 281 | 281 | 281 | |
| Unit Prices | Jan | Feb | Mar | Apr | May | Jun | Jul | Aug | Sep | Oct | Nov | Dec | |
| Slida-Cards® units of 1,000 cards | $199.00 | $199.00 | $199.00 | $199.00 | $199.00 | $199.00 | $199.00 | $199.00 | $199.00 | $199.00 | $199.00 | $199.00 | |
| Large Discounters | $0.00 | $0.00 | $0.00 | $82.50 | $82.50 | $82.50 | $82.50 | $82.50 | $82.50 | $82.50 | $82.50 | $82.50 | |
| Commercial Printing | $27,000.00 | $27,000.00 | $27,000.00 | $27,000.00 | $27,000.00 | $27,000.00 | $27,000.00 | $27,000.00 | $27,000.00 | $27,000.00 | $27,000.00 | $27,000.00 | |
| Other | $0.00 | $0.00 | $0.00 | $0.00 | $0.00 | $0.00 | $0.00 | $0.00 | $0.00 | $0.00 | $0.00 | $0.00 | |
| Sales | |||||||||||||
| Slida-Cards® units of 1,000 cards | $26,865 | $26,865 | $26,865 | $26,865 | $35,820 | $36,815 | $36,815 | $36,815 | $37,810 | $37,810 | $37,810 | $37,810 | |
| Large Discounters | $0 | $0 | $0 | $7,425 | $7,425 | $7,425 | $7,425 | $7,425 | $7,425 | $7,425 | $7,425 | $7,425 | |
| Commercial Printing | $27,000 | $27,000 | $27,000 | $27,000 | $27,000 | $27,000 | $27,000 | $27,000 | $27,000 | $27,000 | $27,000 | $27,000 | |
| Other | $0 | $0 | $0 | $0 | $0 | $0 | $0 | $0 | $0 | $0 | $0 | $0 | |
| Total Sales | $53,865 | $53,865 | $53,865 | $61,290 | $70,245 | $71,240 | $71,240 | $71,240 | $72,235 | $72,235 | $72,235 | $72,235 | |
| Direct Unit Costs | Jan | Feb | Mar | Apr | May | Jun | Jul | Aug | Sep | Oct | Nov | Dec | |
| Slida-Cards® units of 1,000 cards | 0.00% | $19.50 | $19.50 | $19.50 | $19.50 | $19.50 | $19.50 | $19.50 | $19.50 | $19.50 | $19.50 | $19.50 | $19.50 |
| Large Discounters | 0.00% | $0.00 | $0.00 | $0.00 | $21.00 | $21.00 | $21.00 | $21.00 | $21.00 | $21.00 | $21.00 | $21.00 | $21.00 |
| Commercial Printing | 0.00% | $12,825.00 | $12,825.00 | $12,825.00 | $12,825.00 | $12,825.00 | $12,825.00 | $12,825.00 | $12,825.00 | $12,825.00 | $12,825.00 | $12,825.00 | $12,825.00 |
| Other | 0.00% | $0.00 | $0.00 | $0.00 | $0.00 | $0.00 | $0.00 | $0.00 | $0.00 | $0.00 | $0.00 | $0.00 | $0.00 |
| Direct Cost of Sales | |||||||||||||
| Slida-Cards® units of 1,000 cards | $2,633 | $2,633 | $2,633 | $2,633 | $3,510 | $3,608 | $3,608 | $3,608 | $3,705 | $3,705 | $3,705 | $3,705 | |
| Large Discounters | $0 | $0 | $0 | $1,890 | $1,890 | $1,890 | $1,890 | $1,890 | $1,890 | $1,890 | $1,890 | $1,890 | |
| Commercial Printing | $12,825 | $12,825 | $12,825 | $12,825 | $12,825 | $12,825 | $12,825 | $12,825 | $12,825 | $12,825 | $12,825 | $12,825 | |
| Other | $0 | $0 | $0 | $0 | $0 | $0 | $0 | $0 | $0 | $0 | $0 | $0 | |
| Subtotal Direct Cost of Sales | $15,458 | $15,458 | $15,458 | $17,348 | $18,225 | $18,323 | $18,323 | $18,323 | $18,420 | $18,420 | $18,420 | $18,420 | |
| Personnel Plan | |||||||||||||
| Jan | Feb | Mar | Apr | May | Jun | Jul | Aug | Sep | Oct | Nov | Dec | ||
| Production Personnel | |||||||||||||
| Production Manager -Frank | $4,160 | $4,160 | $4,160 | $4,160 | $4,160 | $4,160 | $4,160 | $4,160 | $4,160 | $4,160 | $4,160 | $4,160 | |
| Assistant | $0 | $0 | $0 | $0 | $0 | $0 | $0 | $0 | $0 | $0 | $0 | $0 | |
| Other | $0 | $0 | $0 | $0 | $0 | $0 | $0 | $0 | $0 | $0 | $0 | $0 | |
| Subtotal | $4,160 | $4,160 | $4,160 | $4,160 | $4,160 | $4,160 | $4,160 | $4,160 | $4,160 | $4,160 | $4,160 | $4,160 | |
| Sales and Marketing Personnel | |||||||||||||
| Telemarketer – Sadie | $569 | $569 | $569 | $569 | $569 | $569 | $569 | $569 | $569 | $569 | $569 | $569 | |
| Telemarketer- Jennie | $693 | $693 | $693 | $693 | $693 | $693 | $693 | $693 | $693 | $693 | $693 | $693 | |
| Telemarketer- Jack | $1,365 | $1,365 | $1,365 | $1,365 | $1,365 | $1,365 | $1,365 | $1,365 | $1,365 | $1,365 | $1,365 | $1,365 | |
| Other | $0 | $0 | $0 | $0 | $0 | $0 | $0 | $0 | $0 | $0 | $0 | $0 | |
| Subtotal | $2,627 | $2,627 | $2,627 | $2,627 | $2,627 | $2,627 | $2,627 | $2,627 | $2,627 | $2,627 | $2,627 | $2,627 | |
| General and Administrative Personnel | |||||||||||||
| General Manager – Francis Pullman | $5,416 | $5,416 | $5,416 | $5,416 | $5,416 | $5,416 | $5,416 | $5,416 | $5,416 | $5,416 | $5,416 | $5,416 | |
| Art Designer – Vie | $2,500 | $2,500 | $2,500 | $2,500 | $2,500 | $2,500 | $2,500 | $2,500 | $2,500 | $2,500 | $2,500 | $2,500 | |
| Secretary – Jonathon | $2,253 | $2,253 | $2,253 | $2,253 | $2,253 | $2,253 | $2,253 | $2,253 | $2,253 | $2,253 | $2,253 | $2,253 | |
| Other | $0 | $0 | $0 | $0 | $0 | $0 | $0 | $0 | $0 | $0 | $0 | $0 | |
| Subtotal | $10,169 | $10,169 | $10,169 | $10,169 | $10,169 | $10,169 | $10,169 | $10,169 | $10,169 | $10,169 | $10,169 | $10,169 | |
| Other Personnel | |||||||||||||
| Name or title | $0 | $0 | $0 | $0 | $0 | $0 | $0 | $0 | $0 | $0 | $0 | $0 | |
| Other | $0 | $0 | $0 | $0 | $0 | $0 | $0 | $0 | $0 | $0 | $0 | $0 | |
| Subtotal | $0 | $0 | $0 | $0 | $0 | $0 | $0 | $0 | $0 | $0 | $0 | $0 | |
| Total People | 7 | 7 | 7 | 7 | 7 | 7 | 7 | 7 | 7 | 7 | 7 | 7 | |
| Total Payroll | $16,956 | $16,956 | $16,956 | $16,956 | $16,956 | $16,956 | $16,956 | $16,956 | $16,956 | $16,956 | $16,956 | $16,956 | |
| General Assumptions | |||||||||||||
| Jan | Feb | Mar | Apr | May | Jun | Jul | Aug | Sep | Oct | Nov | Dec | ||
| Plan Month | 1 | 2 | 3 | 4 | 5 | 6 | 7 | 8 | 9 | 10 | 11 | 12 | |
| Current Interest Rate | 45.00% | 45.00% | 45.00% | 45.00% | 45.00% | 45.00% | 45.00% | 45.00% | 45.00% | 45.00% | 45.00% | 45.00% | |
| Long-term Interest Rate | 9.30% | 9.30% | 9.30% | 9.30% | 9.30% | 9.30% | 9.30% | 9.30% | 9.30% | 9.30% | 9.30% | 9.30% | |
| Tax Rate | 30.00% | 25.00% | 25.00% | 25.00% | 25.00% | 25.00% | 25.00% | 25.00% | 25.00% | 25.00% | 25.00% | 25.00% | |
| Other | 0 | 0 | 0 | 0 | 0 | 0 | 0 | 0 | 0 | 0 | 0 | 0 | |
| Pro Forma Profit and Loss | |||||||||||||
| Jan | Feb | Mar | Apr | May | Jun | Jul | Aug | Sep | Oct | Nov | Dec | ||
| Sales | $53,865 | $53,865 | $53,865 | $61,290 | $70,245 | $71,240 | $71,240 | $71,240 | $72,235 | $72,235 | $72,235 | $72,235 | |
| Direct Cost of Sales | $15,458 | $15,458 | $15,458 | $17,348 | $18,225 | $18,323 | $18,323 | $18,323 | $18,420 | $18,420 | $18,420 | $18,420 | |
| Production Payroll | $4,160 | $4,160 | $4,160 | $4,160 | $4,160 | $4,160 | $4,160 | $4,160 | $4,160 | $4,160 | $4,160 | $4,160 | |
| Industrial rags | $22 | $22 | $22 | $22 | $22 | $22 | $22 | $22 | $22 | $22 | $22 | $22 | |
| Total Cost of Sales | $19,640 | $19,640 | $19,640 | $21,530 | $22,407 | $22,505 | $22,505 | $22,505 | $22,602 | $22,602 | $22,602 | $22,602 | |
| Gross Margin | $34,226 | $34,226 | $34,226 | $39,761 | $47,838 | $48,736 | $48,736 | $48,736 | $49,633 | $49,633 | $49,633 | $49,633 | |
| Gross Margin % | 63.54% | 63.54% | 63.54% | 64.87% | 68.10% | 68.41% | 68.41% | 68.41% | 68.71% | 68.71% | 68.71% | 68.71% | |
| Operating Expenses | |||||||||||||
| Sales and Marketing Expenses | |||||||||||||
| Sales and Marketing Payroll | $2,627 | $2,627 | $2,627 | $2,627 | $2,627 | $2,627 | $2,627 | $2,627 | $2,627 | $2,627 | $2,627 | $2,627 | |
| Travel | $0 | $0 | $0 | $0 | $0 | $0 | $0 | $0 | $0 | $0 | $0 | $0 | |
| Miscellaneous | $0 | $0 | $0 | $0 | $0 | $0 | $0 | $0 | $0 | $0 | $0 | $0 | |
| Advertising/Promotion | $0 | $5,000 | $5,000 | $0 | $0 | $0 | $5,000 | $5,000 | $5,000 | $0 | $0 | $0 | |
| Telemarketing commissions | $1,000 | $1,000 | $1,000 | $1,000 | $1,000 | $1,000 | $1,000 | $1,000 | $1,000 | $1,000 | $1,000 | $1,000 | |
| Internet Services: | $198 | $198 | $198 | $198 | $198 | $198 | $198 | $198 | $198 | $198 | $198 | $198 | |
| Total Sales and Marketing Expenses | $3,825 | $8,825 | $8,825 | $3,825 | $3,825 | $3,825 | $8,825 | $8,825 | $8,825 | $3,825 | $3,825 | $3,825 | |
| Sales and Marketing % | 7.10% | 16.38% | 16.38% | 6.24% | 5.44% | 5.37% | 12.39% | 12.39% | 12.22% | 5.29% | 5.29% | 5.29% | |
| General and Administrative Expenses | |||||||||||||
| General and Administrative Payroll | $10,169 | $10,169 | $10,169 | $10,169 | $10,169 | $10,169 | $10,169 | $10,169 | $10,169 | $10,169 | $10,169 | $10,169 | |
| Sales and Marketing and Other Expenses | $0 | $0 | $0 | $0 | $0 | $0 | $0 | $0 | $0 | $0 | $0 | $0 | |
| Depreciation | $3,466 | $3,466 | $3,466 | $3,466 | $3,466 | $3,466 | $3,466 | $3,466 | $3,466 | $3,466 | $3,466 | $3,466 | |
| Leased Vehicles: | $985 | $985 | $985 | $985 | $985 | $985 | $985 | $985 | $985 | $985 | $985 | $985 | |
| Utilities | $411 | $411 | $411 | $411 | $411 | $411 | $411 | $411 | $411 | $411 | $411 | $411 | |
| Insurance | $497 | $497 | $497 | $497 | $497 | $497 | $497 | $497 | $497 | $497 | $497 | $497 | |
| Medical and Dental: | $2,154 | $2,154 | $2,154 | $2,154 | $2,154 | $2,154 | $2,154 | $2,154 | $2,154 | $2,154 | $2,154 | $2,154 | |
| Telephone | $970 | $970 | $970 | $970 | $970 | $970 | $970 | $970 | $970 | $970 | $970 | $970 | |
| Retirement Acct (P. Vitale): | $300 | $300 | $300 | $300 | $300 | $300 | $300 | $300 | $300 | $300 | $300 | $300 | |
| Payroll Services: | $168 | $168 | $168 | $168 | $168 | $168 | $168 | $168 | $168 | $168 | $168 | $168 | |
| Postage | $950 | $950 | $950 | $950 | $950 | $950 | $950 | $950 | $950 | $950 | $950 | $950 | |
| Rent | $3,943 | $3,943 | $3,943 | $3,943 | $3,943 | $3,943 | $3,943 | $3,943 | $2,500 | $2,500 | $2,500 | $2,500 | |
| Payroll Taxes | 15% | $0 | $0 | $0 | $0 | $0 | $0 | $0 | $0 | $0 | $0 | $0 | $0 |
| Other General and Administrative Expenses | $0 | $0 | $0 | $0 | $0 | $0 | $0 | $0 | $0 | $0 | $0 | $0 | |
| Total General and Administrative Expenses | $24,013 | $24,013 | $24,013 | $24,013 | $24,013 | $24,013 | $24,013 | $24,013 | $22,570 | $22,570 | $22,570 | $22,570 | |
| General and Administrative % | 44.58% | 44.58% | 44.58% | 39.18% | 34.18% | 33.71% | 33.71% | 33.71% | 31.25% | 31.25% | 31.25% | 31.25% | |
| Other Expenses: | |||||||||||||
| Other Payroll | $0 | $0 | $0 | $0 | $0 | $0 | $0 | $0 | $0 | $0 | $0 | $0 | |
| Consultants | $0 | $0 | $0 | $0 | $0 | $0 | $0 | $0 | $0 | $0 | $0 | $0 | |
| Contract/Consultants | $5,000 | $0 | $0 | $0 | $0 | $0 | $0 | $0 | $0 | $0 | $0 | $0 | |
| Total Other Expenses | $5,000 | $0 | $0 | $0 | $0 | $0 | $0 | $0 | $0 | $0 | $0 | $0 | |
| Other % | 9.28% | 0.00% | 0.00% | 0.00% | 0.00% | 0.00% | 0.00% | 0.00% | 0.00% | 0.00% | 0.00% | 0.00% | |
| Total Operating Expenses | $32,838 | $32,838 | $32,838 | $27,838 | $27,838 | $27,838 | $32,838 | $32,838 | $31,395 | $26,395 | $26,395 | $26,395 | |
| Profit Before Interest and Taxes | $1,388 | $1,388 | $1,388 | $11,923 | $20,001 | $20,898 | $15,898 | $15,898 | $18,239 | $23,239 | $23,239 | $23,239 | |
| EBITDA | $4,854 | $4,854 | $4,854 | $15,389 | $23,467 | $24,364 | $19,364 | $19,364 | $21,705 | $26,705 | $26,705 | $26,705 | |
| Interest Expense | $2,075 | $3,796 | $3,763 | $3,731 | $3,699 | $3,666 | $3,259 | $3,226 | $2,818 | $2,786 | $2,134 | $1,736 | |
| Taxes Incurred | ($206) | ($602) | ($594) | $2,048 | $4,075 | $4,308 | $3,160 | $3,168 | $3,855 | $5,113 | $5,276 | $5,376 | |
| Net Profit | ($481) | ($1,806) | ($1,782) | $6,144 | $12,226 | $12,924 | $9,480 | $9,504 | $11,565 | $15,340 | $15,828 | $16,127 | |
| Net Profit/Sales | -0.89% | -3.35% | -3.31% | 10.02% | 17.41% | 18.14% | 13.31% | 13.34% | 16.01% | 21.24% | 21.91% | 22.33% | |
| Pro Forma Cash Flow | |||||||||||||
| Jan | Feb | Mar | Apr | May | Jun | Jul | Aug | Sep | Oct | Nov | Dec | ||
| Cash Received | |||||||||||||
| Cash from Operations | |||||||||||||
| Cash Sales | $0 | $0 | $0 | $0 | $0 | $0 | $0 | $0 | $0 | $0 | $0 | $0 | |
| Cash from Receivables | $29,361 | $31,156 | $53,865 | $53,865 | $54,113 | $61,589 | $70,278 | $71,240 | $71,240 | $71,273 | $72,235 | $72,235 | |
| Subtotal Cash from Operations | $29,361 | $31,156 | $53,865 | $53,865 | $54,113 | $61,589 | $70,278 | $71,240 | $71,240 | $71,273 | $72,235 | $72,235 | |
| Additional Cash Received | |||||||||||||
| Sales Tax, VAT, HST/GST Received | 0.00% | $0 | $0 | $0 | $0 | $0 | $0 | $0 | $0 | $0 | $0 | $0 | $0 |
| New Current Borrowing | $0 | $46,752 | $0 | $0 | $0 | $0 | $0 | $0 | $0 | $0 | $0 | $0 | |
| New Other Liabilities (interest-free) | $0 | $0 | $0 | $0 | $0 | $0 | $0 | $0 | $0 | $0 | $0 | $0 | |
| New Long-term Liabilities | $0 | $0 | $0 | $0 | $0 | $0 | $0 | $0 | $0 | $0 | $0 | $0 | |
| Sales of Other Current Assets | $0 | $0 | $0 | $0 | $0 | $0 | $0 | $0 | $0 | $0 | $0 | $0 | |
| Sales of Long-term Assets | $0 | $0 | $0 | $0 | $0 | $0 | $0 | $0 | $0 | $0 | $0 | $0 | |
| New Investment Received | $76,000 | $0 | $0 | $0 | $0 | $0 | $0 | $0 | $0 | $0 | $0 | $0 | |
| Subtotal Cash Received | $105,361 | $77,908 | $53,865 | $53,865 | $54,113 | $61,589 | $70,278 | $71,240 | $71,240 | $71,273 | $72,235 | $72,235 | |
| Expenditures | Jan | Feb | Mar | Apr | May | Jun | Jul | Aug | Sep | Oct | Nov | Dec | |
| Expenditures from Operations | |||||||||||||
| Cash Spending | $16,956 | $16,956 | $16,956 | $16,956 | $16,956 | $16,956 | $16,956 | $16,956 | $16,956 | $16,956 | $16,956 | $16,956 | |
| Bill Payments | $92,571 | $18,510 | $19,790 | $19,687 | $17,528 | $22,470 | $38,113 | $41,338 | $41,282 | $40,226 | $36,457 | $35,975 | |
| Subtotal Spent on Operations | $109,527 | $35,466 | $36,746 | $36,643 | $34,484 | $39,426 | $55,069 | $58,294 | $58,238 | $57,182 | $53,413 | $52,931 | |
| Additional Cash Spent | |||||||||||||
| Sales Tax, VAT, HST/GST Paid Out | $0 | $0 | $0 | $0 | $0 | $0 | $0 | $0 | $0 | $0 | $0 | $0 | |
| Principal Repayment of Current Borrowing | $0 | $0 | $0 | $0 | $0 | $0 | $10,000 | $0 | $10,000 | $0 | $16,752 | $10,000 | |
| Other Liabilities Principal Repayment | $0 | $0 | $0 | $0 | $0 | $0 | $0 | $0 | $0 | $0 | $0 | $0 | |
| Long-term Liabilities Principal Repayment | $4,158 | $4,165 | $4,172 | $4,179 | $4,186 | $4,193 | $4,200 | $4,207 | $4,214 | $4,221 | $2,978 | $2,985 | |
| Purchase Other Current Assets | $0 | $0 | $0 | $0 | $0 | $0 | $0 | $0 | $0 | $0 | $0 | $0 | |
| Purchase Long-term Assets | $0 | $0 | $0 | $0 | $0 | $0 | $0 | $0 | $0 | $0 | $0 | $0 | |
| Dividends | $0 | $0 | $0 | $0 | $0 | $0 | $0 | $0 | $0 | $0 | $0 | $0 | |
| Subtotal Cash Spent | $113,685 | $39,631 | $40,918 | $40,822 | $38,670 | $43,619 | $69,269 | $62,501 | $72,452 | $61,403 | $73,143 | $65,916 | |
| Net Cash Flow | ($8,324) | $38,277 | $12,947 | $13,043 | $15,442 | $17,970 | $1,010 | $8,739 | ($1,212) | $9,870 | ($908) | $6,319 | |
| Cash Balance | $7,863 | $46,140 | $59,086 | $72,129 | $87,571 | $105,541 | $106,550 | $115,290 | $114,078 | $123,948 | $123,040 | $129,359 | |
| Pro Forma Balance Sheet | |||||||||||||
| Jan | Feb | Mar | Apr | May | Jun | Jul | Aug | Sep | Oct | Nov | Dec | ||
| Assets | Starting Balances | ||||||||||||
| Current Assets | |||||||||||||
| Cash | $16,187 | $7,863 | $46,140 | $59,086 | $72,129 | $87,571 | $105,541 | $106,550 | $115,290 | $114,078 | $123,948 | $123,040 | $129,359 |
| Accounts Receivable | $58,721 | $83,226 | $105,935 | $105,935 | $113,360 | $129,492 | $139,144 | $140,105 | $140,105 | $141,100 | $142,062 | $142,062 | $142,062 |
| Inventory | $99,430 | $83,973 | $68,515 | $53,058 | $35,710 | $20,048 | $20,155 | $20,155 | $20,155 | $20,262 | $20,262 | $20,262 | $20,262 |
| Other Current Assets | $2,000 | $2,000 | $2,000 | $2,000 | $2,000 | $2,000 | $2,000 | $2,000 | $2,000 | $2,000 | $2,000 | $2,000 | $2,000 |
| Total Current Assets | $176,338 | $177,061 | $222,589 | $220,078 | $223,198 | $239,110 | $266,839 | $268,810 | $277,550 | $277,440 | $288,272 | $287,364 | $293,684 |
| Long-term Assets | |||||||||||||
| Long-term Assets | $226,967 | $226,967 | $226,967 | $226,967 | $226,967 | $226,967 | $226,967 | $226,967 | $226,967 | $226,967 | $226,967 | $226,967 | $226,967 |
| Accumulated Depreciation | $43,015 | $46,481 | $49,947 | $53,413 | $56,879 | $60,345 | $63,811 | $67,277 | $70,743 | $74,209 | $77,675 | $81,141 | $84,607 |
| Total Long-term Assets | $183,952 | $180,486 | $177,020 | $173,554 | $170,088 | $166,622 | $163,156 | $159,690 | $156,224 | $152,758 | $149,292 | $145,826 | $142,360 |
| Total Assets | $360,290 | $357,547 | $399,609 | $393,632 | $393,286 | $405,732 | $429,995 | $428,500 | $433,774 | $430,198 | $437,564 | $433,190 | $436,044 |
| Liabilities and Capital | Jan | Feb | Mar | Apr | May | Jun | Jul | Aug | Sep | Oct | Nov | Dec | |
| Current Liabilities | |||||||||||||
| Accounts Payable | $91,955 | $17,851 | $19,132 | $19,108 | $16,797 | $21,203 | $36,735 | $39,960 | $39,937 | $39,010 | $35,258 | $34,785 | $34,497 |
| Current Borrowing | $0 | $0 | $46,752 | $46,752 | $46,752 | $46,752 | $46,752 | $36,752 | $36,752 | $26,752 | $26,752 | $10,000 | $0 |
| Other Current Liabilities | $0 | $0 | $0 | $0 | $0 | $0 | $0 | $0 | $0 | $0 | $0 | $0 | $0 |
| Subtotal Current Liabilities | $91,955 | $17,851 | $65,884 | $65,860 | $63,549 | $67,955 | $83,487 | $76,712 | $76,689 | $65,762 | $62,010 | $44,785 | $34,497 |
| Long-term Liabilities | $271,874 | $267,716 | $263,551 | $259,379 | $255,200 | $251,014 | $246,821 | $242,621 | $238,414 | $234,200 | $229,979 | $227,001 | $224,016 |
| Total Liabilities | $363,829 | $285,567 | $329,435 | $325,239 | $318,749 | $318,969 | $330,308 | $319,333 | $315,103 | $299,962 | $291,989 | $271,786 | $258,513 |
| Paid-in Capital | $46,912 | $122,912 | $122,912 | $122,912 | $122,912 | $122,912 | $122,912 | $122,912 | $122,912 | $122,912 | $122,912 | $122,912 | $122,912 |
| Retained Earnings | $20,631 | ($50,451) | ($50,451) | ($50,451) | ($50,451) | ($50,451) | ($50,451) | ($50,451) | ($50,451) | ($50,451) | ($50,451) | ($50,451) | ($50,451) |
| Earnings | ($71,082) | ($481) | ($2,287) | ($4,068) | $2,076 | $14,302 | $27,226 | $36,706 | $46,210 | $57,775 | $73,115 | $88,943 | $105,070 |
| Total Capital | ($3,539) | $71,980 | $70,174 | $68,393 | $74,537 | $86,763 | $99,687 | $109,167 | $118,671 | $130,236 | $145,576 | $161,404 | $177,531 |
| Total Liabilities and Capital | $360,290 | $357,547 | $399,609 | $393,632 | $393,286 | $405,732 | $429,995 | $428,500 | $433,774 | $430,198 | $437,564 | $433,190 | $436,044 |
| Net Worth | ($3,539) | $71,980 | $70,174 | $68,393 | $74,537 | $86,763 | $99,687 | $109,167 | $118,671 | $130,236 | $145,576 | $161,404 | $177,531 |

