
Gigmasters.com
Executive Summary
Introduction
The Gigmasters.com (Gigmasters) online booking system was developed to help consumers find and hire live entertainment for weddings, corporate events, private parties, nightclubs, fraternity functions, Bar Mitzvahs, grand openings, and other events. The company has built up a database of over 15,000 musicians. More recently, it has expanded its offerings to include other entertainment services such as comedians, dancers, caterers, photographers, etc.
Gigmaster’s online booking system takes advantage of the Internet’s ability to organize and connect the fragmented marketplace of musicians and entertainers into a searchable database that is consumer-focused, and easy-to-use.
Gigmasters is an owner-managed company. The two people who run the site are its co-founders, Kevin H. Kinyon and Michael J. Caldwell. Recently they brought John Sortino onto their Board of Directors. All three of these gentlemen have extensive experience in Web development, business development and financial management.
Services
Gigmasters collects a 10% commission fee each time it brokers a transaction between a buyer and seller of entertainment services. The company collects its fee from the seller. In addition to booking commissions, Gigmasters earns revenue from corporate sponsorships of its bi-monthly newsletter. Past sponsors include Amazon.com, Emusic.com, RollingStone.com, and Bluelight.com.
There are a number of other websites that connect buyers and sellers of services, however only Gigmasters provides the emphasis on music and entertainment. By doing so, it offers significant advantages to all of it’s customers. For example, only Gigmasters provides online press kits allowing customers to both hear and see entertainers before they hire them. Also, only Gigmasters has developed an online bidding system which supplies customers with competitive bids from the entertainers. None of its competitors do.
In addition to its primary revenue sources of booking commissions and corporate sponsorships, the company also derives revenue through additional fee-based services it offers its entertainers. As the company grows and has additional resources, these secondary revenue streams will begin to take on an increasingly important role.
The Market
Research shows that in the United States, close to $9 billion is spent each year on music and entertainment. The largest component of this market is the wedding industry. There are 2.3 million weddings each year, with over $3.2 billion spent on music. Other components of the industry include corporate events, nightclubs, festivals, Bar Mitzvahs, fraternity and sorority functions, high school proms, country clubs, and hotels.
There are also approximately 13,239 traditional (offline) booking agents in the United States. They earn $2.4 billion annually. Many have websites, but few, if any, offer the ability to book directly online. These sites are more like corporate “brochures” and spotlight only a few of their big-name entertainers with little more than a phone number available for further information. Also, these agents traditionally focus on high-end bookings, generally ignoring the vast market of individuals looking for bands for their weddings, private parties, fraternity dances, corporate Christmas parties, and high school proms. These types of events make up the Gigmasters marketplace.
The company will seek to form strategic partnerships with sites such as WeddingChannel.com, TheKnot.com, iParty.com, and Evite.com, whose customers are planning weddings, parties, and events. Gigmasters will offer these high traffic sites the opportunity to share in a viable revenue sharing program, and, in return, Gigmasters will benefit from a steady stream of traffic and increased revenue.
Financial Considerations
Gigmasters is raising $100,000 (representing 5% equity) for the purposes of expanding its business and paying office, salary, website, and advertising expenses. The minimum amount needed to be raised is $70,000.
The company expects to be earning a solid profits by 2003. These estimates are based on conservative estimates of bookings growth. If the proper funding can be obtained, the company does not expect any significant cash flow problems.
Company Summary
Gigmasters is an owned by Kevin H. Kinyon and Michael J. Caldwell, who also oversee the day-to-day operations of the Gigmasters.com website. Gigmasters.com is an online business.
2.1 Company History
Financial figures for last year’s operations are shown below.

| Past Performance | |||
| 1998 | 1999 | 2000 | |
| Sales | $0 | $0 | $17,066 |
| Gross Margin | $0 | $0 | $17,066 |
| Gross Margin % | 0.00% | 0.00% | 100.00% |
| Operating Expenses | $0 | $0 | $19,435 |
| Collection Period (days) | 0 | 0 | 0 |
| Balance Sheet | |||
| 1998 | 1999 | 2000 | |
| Current Assets | |||
| Cash | $0 | $0 | $15,793 |
| Accounts Receivable | $0 | $0 | $1,125 |
| Other Current Assets | $0 | $0 | $0 |
| Total Current Assets | $0 | $0 | $16,918 |
| Long-term Assets | |||
| Long-term Assets | $0 | $0 | $1,510 |
| Accumulated Depreciation | $0 | $0 | $0 |
| Total Long-term Assets | $0 | $0 | $1,510 |
| Total Assets | $0 | $0 | $18,428 |
| Current Liabilities | |||
| Accounts Payable | $0 | $0 | $0 |
| Current Borrowing | $0 | $0 | $0 |
| Other Current Liabilities (interest free) | $0 | $0 | $0 |
| Total Current Liabilities | $0 | $0 | $0 |
| Long-term Liabilities | $0 | $0 | $4,200 |
| Total Liabilities | $0 | $0 | $4,200 |
| Paid-in Capital | $0 | $0 | $15,657 |
| Retained Earnings | $0 | $0 | ($1,429) |
| Earnings | $0 | $0 | $0 |
| Total Capital | $0 | $0 | $14,228 |
| Total Capital and Liabilities | $0 | $0 | $18,428 |
| Other Inputs | |||
| Payment Days | 0 | 0 | 30 |
| Sales on Credit | $0 | $0 | $0 |
| Receivables Turnover | 0.00 | 0.00 | 0.00 |
Services
Gigmasters is the medium between live entertainment and the people who hire them. We provide the booking service to help customers find quality entertainment for any event they may be having.
3.1 Service Description
How the system works:
- A customer visits the Gigmasters website and types in her ZIP code, the event she is planning, and the type of entertainment she is seeking.
- She is immediately furnished with a list of entertainers in her area. She accesses online press kits where she listens to audio samples, watches video, reads biographies, and views client testimonials. She then checks off the ones that interest her.
- The customer then fills out a brief description of her event. This description is referred to herein as a “gig request.”
- Each entertainer selected by the customer then receives a “gig alert” email describing the customer’s event. The entertainers then each have an opportunity to submit a bid for the customer’s event.
- Based on the bids received, the customer can then decide which entertainer she wishes to hire, and may contact the entertainers offline for further information to aid in her decision.
- The day after the event, a follow-up email is sent to the customer inquiring whether any groups she contacted were hired. Those that were are then invoiced for an amount equal to 10% of what they earned. This commission is agreed to in advance by all entertainers who sign up with the Gigmasters website.
3.2 Gig Requests
Whenever a customer completes a request for entertainers, they have created what the company refers to as a “gig request.” This is what the customer fills out after she has selected which entertainers she would like to contact. This information is logged to the Gigmasters database, and is immediately forwarded on to the entertainers who were selected. The average number of customers who will fill out a gig request during their visit is currently 3.5%. This means that for every 1,000 customers who visit the site, 35 people will complete a gig request. Management believes it can increase that percentage from 3.5% to 5.0% over the next year through improved design and layout of the website. By doing so, it will be able to increase its revenues substantially, independent of any corresponding increase in traffic. In addition, management will conduct focus groups to study customer behavior on its sites. Through this, it will discover new ways to lead customers more quickly and easily into filling out gig requests.
Once the gig request is submitted and verified by Gigmasters, an email is then sent to each entertainer contacted for the event. This email alerts the entertainer that they have a potential customer. Upon clicking the hyperlink contained within the email, the entertainer can then see details about the gig including date, time, location, and description. At this point, the identity of the customer has not been revealed, thus preventing the entertainer from bypassing our system and going directly to the customer. Here is an example of the email the entertainer initially receives: (Discussion Omitted)

At this point, each entertainer that receives the request will have an opportunity to submit a “bid” to the customer. This bid will indicate the rate the entertainer plans to charge based on the information provided. The consumer starts receiving various bids through email and is in the position to be able to make an informed decision. At this point she can either hire one of the entertainers on the spot, or she may follow up with either a phone call or an email.
Out of all the requests Gigmasters receives, the largest component is live bands. This is due in large part because the company has received the most publicity in this area. It has been written up in musician magazines (e.g, Gig Magazine, February 2000 “106 Best Websites For Giggers”) as well as wedding magazines (e.g. Bridal Guide, November 2000 “Webbing Planning”). Gigmasters has established a market niche for itself in this area.
The percentage of gig requests that result in actual bookings is currently 5%. This was achieved while both founders were working only part-time on the site. The company believes it can increase this number to 7-8% in a short amount of time once both founders are working full-time. This will be achieved through improvements to the booking system, as well as better follow-up on gig requests.
Currently, follow-up on gig requests is done via automated emails, and the company will supplement this with telephone inquiry. In addition, once broadband becomes more prevalent in homes around the country, video streaming will improve substantially in quality, and this should increase the number of customers who are able to make their hiring decision entirely online. This number is expected to grow to 16.9% of U.S. households by 2003, compared to the current 3.1% level.
3.3 Press Kits
Gigmasters provides each entertainer with an online press kit containing:
- biography and full description
- color photos
- audio and video samples
- client testimonials
- song lists
- rates and prices
- instrumentation
- musical genre.
The purpose of the press kit is to provide the customer with enough information about the performer to eliminate the need for an offline press kit to be sent in the mail–a process that can take several days and can become quickly outdated. Eventually, the audio and video samples provided in the online press kit will also replace the need for a demo tape to be sent. The entire demo tape will be accessed online. This will become more plausible once broadband, or high speed Internet access, becomes more widespread.
There is an additional function of the press kit. The press kit acts as a website or homepage for those entertainers who don’t already have one. Groups are given a Web address. For example:(Discussion Omitted)
Bands and entertainers can place these URL’s on business cards, flyers, brochures, and other promotional material. Besides helping the musicians, this also provides the added benefit of free branding of the Gigmasters name by being visible in the URL.
Entertainers are provided with usernames and passwords enabling them to update their press kits whenever necessary. By letting entertainers update this information themselves, it keeps the information accurate and current, while eliminating the need for Gigmasters employees to do the updates themselves. While the entertainers are updating their press kits, they also gain access to their control panel, a special screen showing statistics on their account. This information includes how often their press kits were viewed by others, as well as in which categories they were most often found (e.g. blues, top 40, etc…). This control panel also lets them update billing information, pager numbers, email addresses, category selection, audio & video samples, and username/passwords.
3.4 Technology
One major component of Gigmasters’s service is based on customers being able to view audio and video samples of each entertainer online. While audio is fairly wide-scale at present, video streaming is in its earliest stages. Broadband, which is what makes video possible, is predicted to grow to 16.9% of U.S. households by 2003, compared to the current 3.1% level. Once video becomes commonplace, it will be increasingly compelling for customers to make their hiring decisions entirely online without having to revert to the off-line world. This should dramatically increase the number of bookings and commissions that take place. Overall improvements to bandwidth, technology, and computing power will all contribute to a more favorable user experience on the Internet in general, and on Gigmasters specifically.
3.5 Future Services
In the United States, approximately $6.38 trillion is spent each year in the services sector. Gigmasters recognizes the possibility that it could apply its online bookings system to other segments of the service industry. It is currently beta testing categories including: Home & Garden, Wellness, Instructors, and Legal and Financial.
Management’s strategy has been to focus all energies on the current revenue streams, which are:
- booking commissions
- corporate sponsorships
- merchant services
We recognize the fact that there may be other revenue streams that can be developed in the future. With a loyal database of 15,000+ entertainers, there will opportunities to up-sell them additional products and services in the future, but these have not been factored into revenue projections at this point.
Gigmasters has begun to test its booking system on services outside of the area of entertainment. It has discovered that the same system that a person uses to hire a band or DJ could, with some modification, be used to hire a painter or a math tutor. In the United States, approximately $6.38 trillion is spent each year in the services sector, and Gigmasters has the potential to expand its reach into this vast market. Some of the new categories it has tested are listed below: (discussion omitted).
By expanding into these ares, Gigmasters could increase its market exponentially. It would also provide people with a reason to make repeat visits. For example, a couple could use Gigmasters to book a band for their wedding. Three months later they might return to hire a painter. Two months following, they could come in search of a financial planner. At present, the emphasis continues to be in the area of entertainment. Expanding into these new areas, however, could greatly increase revenue and profitability.
Market Analysis Summary
Research shows that in the United States, close to $9 billion per year is spent on live music and entertainment services. The largest component of this is the wedding industry.
On the supply side, there are over 124,520 professional musicians and entertainers earning a total of $13 billion per year. This does not include the vast number of amateur musicians, many of whom make up the company’s database. The company has targeted this segment aggressively, and has also begun to target the 91,191 caterers and 65,395 photographers who earn $3.4 billion and $9.3 billion respectively.
4.1 Market Segmentation
The components of the entertainment market that Gigmasters is targeting include:
- Weddings
- Corporate Events/Conventions
- Nightclubs/Bars/Restaurants
- Bar/Bat Mitzvahs
- Festivals
- Vacation & Resort Entertainment
- Fraternity/Sorority Dances & Parties
- High School Proms/Dances
- Country Club Entertainment
- Hotel Entertainment.

| Market Analysis | |||||||
| 2001 | 2002 | 2003 | 2004 | 2005 | |||
| Potential Customers | Growth | CAGR | |||||
| Weddings | 4% | 2,300,000 | 2,396,600 | 2,497,257 | 2,602,142 | 2,711,432 | 4.20% |
| Bar/Bat Mitzvahs | 3% | 73,000 | 75,190 | 77,446 | 79,769 | 82,162 | 3.00% |
| Nightclubs | 4% | 52,900 | 54,804 | 56,777 | 58,821 | 60,939 | 3.60% |
| Other | 5% | 750,000 | 787,500 | 826,875 | 868,219 | 911,630 | 5.00% |
| Total | 4.35% | 3,175,900 | 3,314,094 | 3,458,355 | 3,608,951 | 3,766,163 | 4.35% |
4.2 Target Market Segment Strategy
Weddings
The wedding industry makes up the largest percentage of Gigmasters’s target market, and most of its business is generated from this segment. There are 2.3 million weddings in the United States each year. It is a $39.1 billion industry with $3.2 billion (8%) spent annually on music, $16.0 billion (41%) spent on catering, and $2.9 billion (7.4%) spent on photography.
Corporate Events
The corporate events industry includes, among other things, promotional events, conventions, expositions, and meetings. It is an $82 billion industry with 4.5%, or $3.76 billion, spent on entertainment. It is estimated that this industry will grow at a rate of 4.2% per year, paralleling the current boom in the hospitality industry. Gigmasters will target this segment aggressively and seek to become the definitive music and entertainment source for corporate event planners and industry professionals. The company will continue to benefit from the continued growth in the number of lavish promotional events held by corporations each year.
Bars/Nightclubs/Restaurants
This segment of the market includes bars, nightclubs, taverns, pubs, and cocktail lounges. There are approximately 52,900 such establishments in the United States. If the average budget for live music is $400 per week, it is a $1.1 billion dollar industry. In addition, there are approximately 100,000 restaurants in the United States, many of which feature live music. This sector should register annual growth of 3.6%.
Bar and Bat Mitzvahs
There are approximately 73,300 Bar and Bat Mitzvahs in the United States each year. Families spend an average of $20,000 for the event, making it a $1.5 billion industry. Approximately 5%, or $73 million is spent on music, 7.5%, or $110 million is spent on photography, and 37.5%, or $549 million is spent on catering.
Strategy and Implementation Summary
Gigmasters collects a 10% commission each time it brokers a transaction between a buyer and seller of entertainment services. This is referred to as a “booking.” Since it instituted its current booking system, Gigmasters successfully booked over 100 gigs at an average commission of $100. This was accomplished with no major advertising, and with the founders working only part-time on the business. The company predicts that in the year 2001, when the company is funded and its founders are working full-time, bookings will grow by 20% per month, and by October of 2001 will be averaging approximately 145 bookings per month with commissions each month totaling $14,000. Gigmasters collects the commission from the seller (the entertainer). Gigmasters does not charge the customer (i.e the buyer) anything to use its service.
Gigmasters has a transaction-based revenue model similar to sites such as eBay.com and HotelReservationNetwork.com. These companies earn money on each transaction they broker, and are among the few profitable sites on the Internet.
In order to determine the best revenue model, the company tested several payment scenarios. Initially the entertainers were charged a flat rate to be listed on the site. Even with a substantial free-trial period, however, there was a reluctance to pay in advance for a service largely unproven. The company then introduced a mixed payment option in which entertainers could choose between a flat-rate fee structure or a commission-based plan.
The majority of entertainers responded positively to the 10% commission plan. Follow-up surveys indicated they favored a system not requiring them to pay any money up front. The company implemented the 10% commission plan exclusively, and this has generated the most revenue.
5.1 Marketing Strategy
The first and most important factor is getting people to visit the site. The website is currently averaging 200 visitors a day to the main page of its site (this does not include hits to interior pages of the site). This number is projected to grow by 20% per month over the next year, and then 10% per month in the second year, and 5% per month in year three. Traffic is essential because it leads to gig requests, which lead to bookings, which lead to commissions.
5.1.1 Search Engine Positioning
Most of Gigmasters’ traffic comes from search engines like Yahoo.com, Excite.com, Hotbot.com, and AskJeeves.com. Search engines direct users to sites based on keywords. The company has been able to achieve favorable positioning for keywords including “booking,” “agents,” “music,” “wedding,” “planning,” and “party.” It has accomplished this by optimizing its code, utilizing search-engine submission tools like Submit-It, and by contacting the larger sites directly when necessary.
5.1.2 Links
Because of its value as a resource to musicians, Gigmasters has been listed on numerous musician websites in their ‘Recommended Links’ sections. For example, Harmony Central, a popular destination for musicians, has Gigmasters listed as a recommended site for bands. Other musician sites displaying Gigmasters as a recommended link include: The Music Scene, the Professional Music Forum, and the Indie Journal. Links are a vital form of free advertising, and frequently occur without notice or request. Others need to be actively pursued. Increasing the number of sites which link back to Gigmasters will be a major focus of the company’s marketing effort. Often it is a process of browsing from site to site looking for opportunities to register the company’s link. It is estimated that approximately 29% of the site’s current traffic is originating from links from other websites. In addition to links that target musicians, the company will aggressively pursue links that list Gigmasters as a resource for brides/grooms, corporate event planners, and club owners. These links should have a substantial impact on the site’s overall traffic.
Also, many of the musicians and entertainers have put a link to Gigmasters from their main website. This is accomplished by a logo provided to each artist upon signing up. The hyperlinked logo identifies the entertainer as “Officially Registered With Gigmasters.” This lends the group increased credibility by being associated with a network of entertainers such as Gigmasters. At the same time, it provides a form of free advertising for the company.
5.1.3 Banner Ads
Gigmasters currently relies on banner ads to supply it with 5% of its traffic. So for example, out of the 200 visitors it gets per day to its homepage, 10 will come as a result of seeing a banner on another site (the rest of the traffic comes from search engines, word of mouth, being mentioned in articles, etc).
- Management has found that it can get a 1% click-through rate on its banner ads. For every 100 times a Gigmasters banner ad appears on another site, this will result in 1 visitor to the site.
- Each month, management has purchased increasing amounts of banners ads through the B-Central Network. The cost of banner ads is approximately $12 CPM (cost per thousand). Ads on more prominent sites cost $20-30 CPM.
5.1.4 Co-Branding
The company will seek to form strategic partnerships with sites such as WeddingChannel.com, TheKnot.com, iParty.com, and Evite.com, whose customers are planning weddings, parties, and events. Gigmasters will offer these high-traffic sites the opportunity to share in a viable revenue sharing program, and, in return, Gigmasters will benefit from a steady stream of traffic and increased revenue.
In this type of co-branding situation, a link or graphic is placed on the partner’s site with words to the effect of “Click Here To Find a Band or D.J.” When a user clicks this link, it takes them from the partner’s site to Gigmasters. The page will have a look and feel which mimics the partner’s design but which lives on Gigmasters’ servers. The user would search just as if he/she came to Gigmasters directly. Then end result is a revenue share between the partner site and Gigmasters. The partner site would be providing the traffic, while Gigmasters would be providing the revenue-generating booking system. Gigmasters would handle the billing and would distribute a percentage of the revenue to the partner company.
There will likely be additional costs to the company as a result of a co-brand. The increase in traffic may require the purchase of additional servers to handle the volume. In addition, Gigmasters will need to hire one or more employees to handle the increased customer service and billing responsibilities.
5.2 Competitive Edge
The closest competitors to Gigmasters are (discussion omitted). These sites all connect buyers and sellers of services, however only Gigmasters provides the emphasis on music and entertainment. By doing so, it offers significant advantages to all of it’s customers. For example, only Gigmasters provides online press kits allowing customers to both hear and see entertainers before they hire them. Also, only Gigmasters has developed an online bidding system which supplies customers with competitive bids from the entertainers. None of its competitors do.
The second tier of competition comes from wedding sites such as TheKnot.com and ModernBride.com, which focus on providing content on wedding planning, but have also a section providing names and addresses of local merchants. Again, because the information they provide is so limited, it is not any more useful than a phone book.
There are also approximately 13,239 traditional (offline) booking agents in the United States. They earn $2.4 billion annually. Many have websites, but few, if any, offer the ability to book directly online. These sites are more like corporate “brochures” and spotlight only a few of their big-name entertainers with little more than a phone number available for further information. Also, these agents traditionally focus on high-end bookings, generally ignoring the vast market of individuals looking for bands for their weddings, private parties, fraternity dances, corporate Christmas parties, and high school proms. These types of events make up the Gigmasters marketplace.
It is worth clarifying that companies not competitors to Gigmasters are MP3.com, Napster.com, and Emusic.com. These are sites where customers find downloadable music from thousands of bands. Even though Gigmasters does have a large database of groups, this is not part of the company’s business model. The user experience at these music sites is geared toward listening to music, rather than being specifically tailored to hiring entertainment. From the moment a person arrives at Gigmasters, she knows that the purpose of the site is to help her find and hire live entertainment for her next event.
5.3 Sales Strategy
Once visitors have reached our site, we must convince them to book entertainment through Gigmaster.com. There are three challenges here:
Helping the customer find the right entertainer
Our internal search engine is combined with audio and streaming video samples so customers can ‘audition’ local performers from the comfort of their living rooms.
Gaining the customer’s trust
Co-branding, as described above, will give the site legitimacy by linking it to other well-known and trusted websites. In addition, we have completed processes to be marked as a secure site for handling sensitive customer data and billing.
Making sure that our listed entertainers respond to gig requests
These gigs must be profitable for performers, or they will stop responding to gig requests. We will limit each customer to choosing 3 entertainers of each type per event (for example, three bands, three photographers, etc.) in their gig request. Each gig request thus represents a 1 in 3 chance for that entertainer to get a gig.
In addition, since each gig request and bid in response are routed through our system, we will be able to keep tabs on how the matches are going.
- Any entertainer who repeatedly fails to respond to gig requests will be contacted to determine whether there are problems in our listings of their services, or the types of requests they are receiving. Those who are simply too busy to accept gigs will be removed from the listings.
- Any entertainer who repeatedly submits bids and fails to win contracts will be contacted to determine the problem. Are they submitting bids far out of line with their local competition?
5.3.1 Sales Forecast
Overall, there are three main variables in the formula that determine the volume of bookings that Gigmasters will be able to generate:
- The number of customers who visit Gigmasters each day.
- The percentage of those customers who fill out gig requests.
- The percentage of gig requests which result in actual bookings.
The day after an event takes place, the company contacts the customer. The purpose is to: a) inquire about the level of satisfaction with the performance, and, b) to discover the rate the entertainer charged to the customer. Once the amount is revealed, an invoice is distributed to the entertainer for an amount equal to 10% of his/her earnings.
The invoice is sent both online and offline. An entertainer has 30 days to remit payment, and may pay online with a credit card or may send a check. If payment is not received within 30 days, his/her online press kit is de-activated. Press kits are re-activated once payment is received. To date, the company has collected on 93% of its bookings.
Because Gigmasters has online billing capabilities, the company will offer the entertainers the option of having commissions automatically billed directly to their credit cards. This will shorten the number of days it takes the company to get paid, and will be more convenient for entertainers.

| Sales Forecast | |||
| 2001 | 2002 | 2003 | |
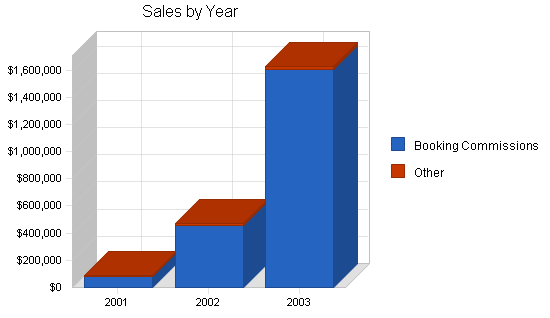
| Sales | |||
| Booking Commissions | $83,017 | $458,227 | $1,604,858 |
| Other | $6,000 | $12,000 | $18,000 |
| Total Sales | $89,017 | $470,227 | $1,622,858 |
| Direct Cost of Sales | 2001 | 2002 | 2003 |
| Booking Commissions | $0 | $0 | $0 |
| Other | $0 | $0 | $0 |
| Subtotal Direct Cost of Sales | $0 | $0 | $0 |
5.3.2 Incentives for Disclosure
In order to encourage entertainers to accurately disclose the amount they have been paid for their performances, Gigmasters offers an incentive program. Essentially, the more business an entertainer books through Gigmasters, the higher they are listed in search results. For example, a bride who searches for jazz quartets in Miami, Florida will see those groups listed first who have booked the most total dollars through Gigmasters. By instituting this policy, the company rewards entertainers who book through its service, and gives them priority positioning. Response from entertainers has been positive, and those who have seen results from its service have shown a willingness to disclose the amounts they were paid in order to not jeopardize their likelihood of getting additional bookings in the future.
Because Gigmasters has over 15,000 entertainer press kits, it behooves entertainers to maintain a high position in the categories where they are listed. This is the incentive for them to disclose the dollar amounts they receive through the site’s booking process.
5.3.3 Corporate Sponsorships
Gigmasters also derives revenue from sponsorships of its bi-monthly newsletter. This newsletter currently goes out to approximately 8,000 entertainers who have valid email addresses in the company’s database. Because of the large number of musicians receiving the newsletter, it is an effective means of advertising for music & entertainment companies. Past sponsors include: Amazon.com, Emusic.com, RollingStone.com, and Bluelight.com. These companies have paid as much as $1,000 per mailing and receive a paragraph of text placed at the top of the email. Revenue from sponsorships will continue to increase as the company’s database grows. Recently, Gigmasters added an additional mailing sent each month to the brides/grooms, event planners, and club owners who have used its service. Potential advertisers for this newsletter include party-planning companies like Evite.com and iParty.com, as well as wedding sites such as TheKnot.com and ModernBride.com.
5.3.4 Additional Revenue Streams
In addition to its primary revenue sources of booking commissions and corporate sponsorships, the company also derives revenue through additional fee-based services it offers its entertainers. This includes fees for digitizing entertainer’s music into RealAudio or MP3 format, scanning press kit photos, and the selling of musician CDs on consignment. As the company grows and has additional resources, these secondary revenue streams will begin to take on an increasingly important role.
Management Summary
Gigmasters is an owner-managed company. The two people who run the site are its co-founders, Kevin H. Kinyon and Michael J. Caldwell. Recently they brought John Sortino on to their Board of Directors. Mr. Sortino, founder of Vermont Teddy Bear, will advise the company on business and financing strategies, and will be compensated with stock options.
6.1 Management Team
Mr. Caldwell has worked extensively in the New Media industry for the last four years. He is a Microsoft Certified Professional with expertise in database design and Web development. He has consulted to numerous high-profile websites including SmartMoney.com, Refer-it.com, TheSquare.com, as well as for the sites of George and Premiere magazines. Prior to his involvement in New Media, Michael worked in the International Equity department at Scudder, Stevens, and Clark. He studied Viola performance at Indiana University, and graduated with a bachelor’s degree in Economics in 1992.
Mr. Kinyon launched Gigmasters in February 1997. Previously, Mr. Kinyon was a financial management consultant for five years, most recently with Telekurs, USA. In 1989, Mr. Kinyon earned his B.A. with Honors from Pace University with a double major in Literature and Communications. He starred in the 1996 award-winning short film “On The Nod,” has been a guest speaker at Trinity University in Dublin, Ireland, and is a frequent contributor to Internet industry publications.
Mr. Sortino founded the Vermont Teddy Bear Company in 1981 as a kiosk on Church Street in Burlington, Vermont and oversaw its growth as President and Chief Executive Officer, through its IPO in 1993, until 1995. Vermont Teddy Bear was the third fastest growing IPO of 1993, with a market capitalization that year of nearly $100 million. The Vermont Teddy Bear and Mr. Sortino were awarded “Best Company in America” by the National Foundation of Business and Dun & Bradstreet in 1994. That same year, the company was named “Best Customer Service in New England” by SOCAP and also the “Yankee Award” for best public relations in its region (New York and New England). In 1995, Mr. Sortino was recognized as one of “America’s Top 100 Marketing Stars” in Advertising Age magazine (July 1995). Inc. magazine recognized the Vermont Teddy Bear Company as one of the country’s fastest growing companies in 1991, 1992, and 1993 (ranking 88th, 85th, and 50th, respectively). Mr. Sortino has appeared in many magazine articles and on business and news programs, including interviews on CNN and ABC. He has given over 200 radio interviews. In 1999, Mr. Sortino authored Being a Successful Entrepreneur, published by MacMillan Publishing Company. Mr. Sortino was a founder and CEO of the Chicago Bicycle Company from 1994 to 1997. He was a founder of, and has been CEO of American Performance Products since 1997.
6.2 Personnel Plan
Our projected payroll expenses are laid out in the following table.
| Personnel Plan | |||
| 2001 | 2002 | 2003 | |
| Payroll | $104,796 | $224,784 | $246,780 |
| Other | $0 | $0 | $0 |
| Total People | 0 | 0 | 0 |
| Total Payroll | $104,796 | $224,784 | $246,780 |
Financial Plan
The following sections describe the financial position of Gigmasters.
7.1 Important Assumptions
Our basic financial accounting assumptions are outlined below.
| General Assumptions | |||
| 2001 | 2002 | 2003 | |
| Plan Month | 1 | 2 | 3 |
| Current Interest Rate | 10.00% | 10.00% | 10.00% |
| Long-term Interest Rate | 10.00% | 10.00% | 10.00% |
| Tax Rate | 25.42% | 25.00% | 25.42% |
| Other | 0 | 0 | 0 |
7.2 Break-even Analysis
The Break-even Analysis below demonstrates how much Gigmasters needs to sell every month to make a profit.

| Break-even Analysis | |
| Monthly Revenue Break-even | $12,512 |
| Assumptions: | |
| Average Percent Variable Cost | 0% |
| Estimated Monthly Fixed Cost | $12,512 |
7.3 Projected Profit and Loss
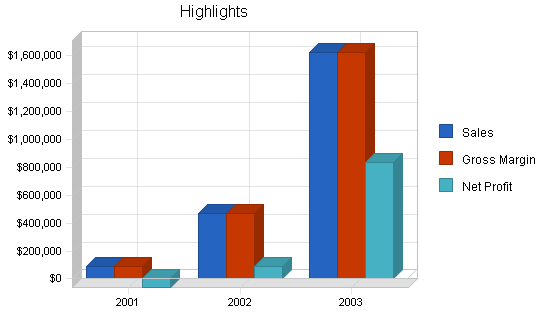
The profit and loss projections in the chart and table below present the key increase in sales, profits, and gross margin.
The company estimates it will not achieve profitability in the first year, especially since we project the need to hire two additional full-time employees late in the year to assist with marketing and administrative responsibilities. Their goals will be to increase overall traffic to the site, increase the percentage of customers who fill out gig requests and increase the percentage of gig requests that result in bookings.


| Pro Forma Profit and Loss | |||
| 2001 | 2002 | 2003 | |
| Sales | $89,017 | $470,227 | $1,622,858 |
| Direct Cost of Sales | $0 | $0 | $0 |
| Other | $0 | $0 | $0 |
| Total Cost of Sales | $0 | $0 | $0 |
| Gross Margin | $89,017 | $470,227 | $1,622,858 |
| Gross Margin % | 100.00% | 100.00% | 100.00% |
| Expenses | |||
| Payroll | $104,796 | $224,784 | $246,780 |
| Sales and Marketing and Other Expenses | $28,388 | $93,873 | $220,259 |
| Depreciation | $0 | $0 | $0 |
| Rent | $16,960 | $33,360 | $36,000 |
| Payroll Taxes | $0 | $0 | $0 |
| Other | $0 | $0 | $0 |
| Total Operating Expenses | $150,144 | $352,017 | $503,039 |
| Profit Before Interest and Taxes | ($61,127) | $118,210 | $1,119,819 |
| EBITDA | ($61,127) | $118,210 | $1,119,819 |
| Interest Expense | $70 | $0 | $0 |
| Taxes Incurred | $0 | $29,553 | $284,621 |
| Net Profit | ($61,197) | $88,658 | $835,198 |
| Net Profit/Sales | -68.75% | 18.85% | 51.46% |
7.4 Projected Cash Flow
The chart and table below show the projected cash flow for the company.

| Pro Forma Cash Flow | |||
| 2001 | 2002 | 2003 | |
| Cash Received | |||
| Cash from Operations | |||
| Cash Sales | $89,017 | $470,227 | $1,622,858 |
| Cash from Receivables | $1,125 | $0 | $0 |
| Subtotal Cash from Operations | $90,142 | $470,227 | $1,622,858 |
| Additional Cash Received | |||
| Sales Tax, VAT, HST/GST Received | $0 | $0 | $0 |
| New Current Borrowing | $0 | $0 | $0 |
| New Other Liabilities (interest-free) | $0 | $0 | $0 |
| New Long-term Liabilities | $0 | $0 | $0 |
| Sales of Other Current Assets | $0 | $0 | $0 |
| Sales of Long-term Assets | $0 | $0 | $0 |
| New Investment Received | $70,000 | $0 | $0 |
| Subtotal Cash Received | $160,142 | $470,227 | $1,622,858 |
| Expenditures | 2001 | 2002 | 2003 |
| Expenditures from Operations | |||
| Cash Spending | $104,796 | $224,784 | $246,780 |
| Bill Payments | $38,633 | $150,684 | $509,310 |
| Subtotal Spent on Operations | $143,429 | $375,468 | $756,090 |
| Additional Cash Spent | |||
| Sales Tax, VAT, HST/GST Paid Out | $0 | $0 | $0 |
| Principal Repayment of Current Borrowing | $0 | $0 | $0 |
| Other Liabilities Principal Repayment | $0 | $0 | $0 |
| Long-term Liabilities Principal Repayment | $4,200 | $0 | $0 |
| Purchase Other Current Assets | $0 | $0 | $0 |
| Purchase Long-term Assets | $0 | $5,000 | $25,000 |
| Dividends | $0 | $0 | $0 |
| Subtotal Cash Spent | $147,629 | $380,468 | $781,090 |
| Net Cash Flow | $12,513 | $89,759 | $841,768 |
| Cash Balance | $28,306 | $118,065 | $959,832 |
7.5 Projected Balance Sheet
The following Balance Sheet outlines the key assets and liabilities for Gigmasters.
| Pro Forma Balance Sheet | |||
| 2001 | 2002 | 2003 | |
| Assets | |||
| Current Assets | |||
| Cash | $28,306 | $118,065 | $959,832 |
| Accounts Receivable | $0 | $0 | $0 |
| Other Current Assets | $0 | $0 | $0 |
| Total Current Assets | $28,306 | $118,065 | $959,832 |
| Long-term Assets | |||
| Long-term Assets | $1,510 | $6,510 | $31,510 |
| Accumulated Depreciation | $0 | $0 | $0 |
| Total Long-term Assets | $1,510 | $6,510 | $31,510 |
| Total Assets | $29,816 | $124,575 | $991,342 |
| Liabilities and Capital | 2001 | 2002 | 2003 |
| Current Liabilities | |||
| Accounts Payable | $6,785 | $12,886 | $44,456 |
| Current Borrowing | $0 | $0 | $0 |
| Other Current Liabilities | $0 | $0 | $0 |
| Subtotal Current Liabilities | $6,785 | $12,886 | $44,456 |
| Long-term Liabilities | $0 | $0 | $0 |
| Total Liabilities | $6,785 | $12,886 | $44,456 |
| Paid-in Capital | $85,657 | $85,657 | $85,657 |
| Retained Earnings | ($1,429) | ($62,626) | $26,031 |
| Earnings | ($61,197) | $88,658 | $835,198 |
| Total Capital | $23,031 | $111,688 | $946,887 |
| Total Liabilities and Capital | $29,816 | $124,575 | $991,342 |
| Net Worth | $23,031 | $111,688 | $946,887 |
7.6 Business Ratios
The following table presents important business ratios for the business services industry, as determined by the Standard Industry Classification Index (SIC) code 7389, Business Services, NEC.
| Ratio Analysis | ||||
| 2001 | 2002 | 2003 | Industry Profile | |
| Sales Growth | 421.59% | 428.24% | 245.12% | 8.20% |
| Percent of Total Assets | ||||
| Accounts Receivable | 0.00% | 0.00% | 0.00% | 26.30% |
| Other Current Assets | 0.00% | 0.00% | 0.00% | 44.20% |
| Total Current Assets | 94.94% | 94.77% | 96.82% | 74.30% |
| Long-term Assets | 5.06% | 5.23% | 3.18% | 25.70% |
| Total Assets | 100.00% | 100.00% | 100.00% | 100.00% |
| Current Liabilities | 22.76% | 10.34% | 4.48% | 49.00% |
| Long-term Liabilities | 0.00% | 0.00% | 0.00% | 13.80% |
| Total Liabilities | 22.76% | 10.34% | 4.48% | 62.80% |
| Net Worth | 77.24% | 89.66% | 95.52% | 37.20% |
| Percent of Sales | ||||
| Sales | 100.00% | 100.00% | 100.00% | 100.00% |
| Gross Margin | 100.00% | 100.00% | 100.00% | 0.00% |
| Selling, General & Administrative Expenses | 192.29% | 88.32% | 50.53% | 81.40% |
| Advertising Expenses | 19.98% | 16.71% | 12.36% | 1.70% |
| Profit Before Interest and Taxes | -68.67% | 25.14% | 69.00% | 2.10% |
| Main Ratios | ||||
| Current | 4.17 | 9.16 | 21.59 | 1.49 |
| Quick | 4.17 | 9.16 | 21.59 | 1.17 |
| Total Debt to Total Assets | 22.76% | 10.34% | 4.48% | 62.80% |
| Pre-tax Return on Net Worth | -265.72% | 105.84% | 118.26% | 4.20% |
| Pre-tax Return on Assets | -205.25% | 94.89% | 112.96% | 11.30% |
| Additional Ratios | 2001 | 2002 | 2003 | |
| Net Profit Margin | -68.75% | 18.85% | 51.46% | n.a |
| Return on Equity | -265.72% | 79.38% | 88.20% | n.a |
| Activity Ratios | ||||
| Accounts Receivable Turnover | 0.00 | 0.00 | 0.00 | n.a |
| Collection Days | 0 | 0 | 0 | n.a |
| Accounts Payable Turnover | 6.69 | 12.17 | 12.17 | n.a |
| Payment Days | 27 | 23 | 19 | n.a |
| Total Asset Turnover | 2.99 | 3.77 | 1.64 | n.a |
| Debt Ratios | ||||
| Debt to Net Worth | 0.29 | 0.12 | 0.05 | n.a |
| Current Liab. to Liab. | 1.00 | 1.00 | 1.00 | n.a |
| Liquidity Ratios | ||||
| Net Working Capital | $21,521 | $105,178 | $915,376 | n.a |
| Interest Coverage | -873.24 | 0.00 | 0.00 | n.a |
| Additional Ratios | ||||
| Assets to Sales | 0.33 | 0.26 | 0.61 | n.a |
| Current Debt/Total Assets | 23% | 10% | 4% | n.a |
| Acid Test | 4.17 | 9.16 | 21.59 | n.a |
| Sales/Net Worth | 3.87 | 4.21 | 1.71 | n.a |
| Dividend Payout | 0.00 | 0.00 | 0.00 | n.a |
Appendix
| Sales Forecast | |||||||||||||
| Jan | Feb | Mar | Apr | May | Jun | Jul | Aug | Sep | Oct | Nov | Dec | ||
| Sales | |||||||||||||
| Booking Commissions | 0% | $2,097 | $2,517 | $3,020 | $3,624 | $4,349 | $5,219 | $6,263 | $7,516 | $9,019 | $10,822 | $12,987 | $15,584 |
| Other | 0% | $500 | $500 | $500 | $500 | $500 | $500 | $500 | $500 | $500 | $500 | $500 | $500 |
| Total Sales | $2,597 | $3,017 | $3,520 | $4,124 | $4,849 | $5,719 | $6,763 | $8,016 | $9,519 | $11,322 | $13,487 | $16,084 | |
| Direct Cost of Sales | Jan | Feb | Mar | Apr | May | Jun | Jul | Aug | Sep | Oct | Nov | Dec | |
| Booking Commissions | $0 | $0 | $0 | $0 | $0 | $0 | $0 | $0 | $0 | $0 | $0 | $0 | |
| Other | $0 | $0 | $0 | $0 | $0 | $0 | $0 | $0 | $0 | $0 | $0 | $0 | |
| Subtotal Direct Cost of Sales | $0 | $0 | $0 | $0 | $0 | $0 | $0 | $0 | $0 | $0 | $0 | $0 | |
| Personnel Plan | |||||||||||||
| Jan | Feb | Mar | Apr | May | Jun | Jul | Aug | Sep | Oct | Nov | Dec | ||
| Payroll | 0% | $7,933 | $7,933 | $7,933 | $7,933 | $7,933 | $7,933 | $7,933 | $7,933 | $7,933 | $7,933 | $12,733 | $12,733 |
| Other | 0% | $0 | $0 | $0 | $0 | $0 | $0 | $0 | $0 | $0 | $0 | $0 | $0 |
| Total People | 0 | 0 | 0 | 0 | 0 | 0 | 0 | 0 | 0 | 0 | 0 | 0 | |
| Total Payroll | $7,933 | $7,933 | $7,933 | $7,933 | $7,933 | $7,933 | $7,933 | $7,933 | $7,933 | $7,933 | $12,733 | $12,733 | |
| General Assumptions | |||||||||||||
| Jan | Feb | Mar | Apr | May | Jun | Jul | Aug | Sep | Oct | Nov | Dec | ||
| Plan Month | 1 | 2 | 3 | 4 | 5 | 6 | 7 | 8 | 9 | 10 | 11 | 12 | |
| Current Interest Rate | 10.00% | 10.00% | 10.00% | 10.00% | 10.00% | 10.00% | 10.00% | 10.00% | 10.00% | 10.00% | 10.00% | 10.00% | |
| Long-term Interest Rate | 10.00% | 10.00% | 10.00% | 10.00% | 10.00% | 10.00% | 10.00% | 10.00% | 10.00% | 10.00% | 10.00% | 10.00% | |
| Tax Rate | 30.00% | 25.00% | 25.00% | 25.00% | 25.00% | 25.00% | 25.00% | 25.00% | 25.00% | 25.00% | 25.00% | 25.00% | |
| Other | 0 | 0 | 0 | 0 | 0 | 0 | 0 | 0 | 0 | 0 | 0 | 0 | |
| Pro Forma Profit and Loss | |||||||||||||
| Jan | Feb | Mar | Apr | May | Jun | Jul | Aug | Sep | Oct | Nov | Dec | ||
| Sales | $2,597 | $3,017 | $3,520 | $4,124 | $4,849 | $5,719 | $6,763 | $8,016 | $9,519 | $11,322 | $13,487 | $16,084 | |
| Direct Cost of Sales | $0 | $0 | $0 | $0 | $0 | $0 | $0 | $0 | $0 | $0 | $0 | $0 | |
| Other | $0 | $0 | $0 | $0 | $0 | $0 | $0 | $0 | $0 | $0 | $0 | $0 | |
| Total Cost of Sales | $0 | $0 | $0 | $0 | $0 | $0 | $0 | $0 | $0 | $0 | $0 | $0 | |
| Gross Margin | $2,597 | $3,017 | $3,520 | $4,124 | $4,849 | $5,719 | $6,763 | $8,016 | $9,519 | $11,322 | $13,487 | $16,084 | |
| Gross Margin % | 100.00% | 100.00% | 100.00% | 100.00% | 100.00% | 100.00% | 100.00% | 100.00% | 100.00% | 100.00% | 100.00% | 100.00% | |
| Expenses | |||||||||||||
| Payroll | $7,933 | $7,933 | $7,933 | $7,933 | $7,933 | $7,933 | $7,933 | $7,933 | $7,933 | $7,933 | $12,733 | $12,733 | |
| Sales and Marketing and Other Expenses | $1,149 | $1,239 | $1,347 | $1,677 | $1,832 | $2,018 | $2,242 | $2,510 | $2,833 | $3,219 | $3,883 | $4,439 | |
| Depreciation | $0 | $0 | $0 | $0 | $0 | $0 | $0 | $0 | $0 | $0 | $0 | $0 | |
| Rent | $580 | $580 | $580 | $580 | $580 | $580 | $580 | $2,580 | $2,580 | $2,580 | $2,580 | $2,580 | |
| Payroll Taxes | 20% | $0 | $0 | $0 | $0 | $0 | $0 | $0 | $0 | $0 | $0 | $0 | $0 |
| Other | $0 | $0 | $0 | $0 | $0 | $0 | $0 | $0 | $0 | $0 | $0 | $0 | |
| Total Operating Expenses | $9,662 | $9,752 | $9,860 | $10,190 | $10,345 | $10,531 | $10,755 | $13,023 | $13,346 | $13,732 | $19,196 | $19,752 | |
| Profit Before Interest and Taxes | ($7,065) | ($6,735) | ($6,340) | ($6,066) | ($5,496) | ($4,812) | ($3,992) | ($5,007) | ($3,827) | ($2,410) | ($5,709) | ($3,668) | |
| EBITDA | ($7,065) | ($6,735) | ($6,340) | ($6,066) | ($5,496) | ($4,812) | ($3,992) | ($5,007) | ($3,827) | ($2,410) | ($5,709) | ($3,668) | |
| Interest Expense | $35 | $35 | $0 | $0 | $0 | $0 | $0 | $0 | $0 | $0 | $0 | $0 | |
| Taxes Incurred | $0 | $0 | $0 | $0 | $0 | $0 | $0 | $0 | $0 | $0 | $0 | $0 | |
| Net Profit | ($7,100) | ($6,770) | ($6,340) | ($6,066) | ($5,496) | ($4,812) | ($3,992) | ($5,007) | ($3,827) | ($2,410) | ($5,709) | ($3,668) | |
| Net Profit/Sales | -273.39% | -224.40% | -180.11% | -147.09% | -113.34% | -84.14% | -59.03% | -62.46% | -40.20% | -21.29% | -42.33% | -22.81% | |
| Pro Forma Cash Flow | |||||||||||||
| Jan | Feb | Mar | Apr | May | Jun | Jul | Aug | Sep | Oct | Nov | Dec | ||
| Cash Received | |||||||||||||
| Cash from Operations | |||||||||||||
| Cash Sales | $2,597 | $3,017 | $3,520 | $4,124 | $4,849 | $5,719 | $6,763 | $8,016 | $9,519 | $11,322 | $13,487 | $16,084 | |
| Cash from Receivables | $562 | $562 | $0 | $0 | $0 | $0 | $0 | $0 | $0 | $0 | $0 | $0 | |
| Subtotal Cash from Operations | $3,159 | $3,579 | $3,520 | $4,124 | $4,849 | $5,719 | $6,763 | $8,016 | $9,519 | $11,322 | $13,487 | $16,084 | |
| Additional Cash Received | |||||||||||||
| Sales Tax, VAT, HST/GST Received | 0.00% | $0 | $0 | $0 | $0 | $0 | $0 | $0 | $0 | $0 | $0 | $0 | $0 |
| New Current Borrowing | $0 | $0 | $0 | $0 | $0 | $0 | $0 | $0 | $0 | $0 | $0 | $0 | |
| New Other Liabilities (interest-free) | $0 | $0 | $0 | $0 | $0 | $0 | $0 | $0 | $0 | $0 | $0 | $0 | |
| New Long-term Liabilities | $0 | $0 | $0 | $0 | $0 | $0 | $0 | $0 | $0 | $0 | $0 | $0 | |
| Sales of Other Current Assets | $0 | $0 | $0 | $0 | $0 | $0 | $0 | $0 | $0 | $0 | $0 | $0 | |
| Sales of Long-term Assets | $0 | $0 | $0 | $0 | $0 | $0 | $0 | $0 | $0 | $0 | $0 | $0 | |
| New Investment Received | $0 | $0 | $70,000 | $0 | $0 | $0 | $0 | $0 | $0 | $0 | $0 | $0 | |
| Subtotal Cash Received | $3,159 | $3,579 | $73,520 | $4,124 | $4,849 | $5,719 | $6,763 | $8,016 | $9,519 | $11,322 | $13,487 | $16,084 | |
| Expenditures | Jan | Feb | Mar | Apr | May | Jun | Jul | Aug | Sep | Oct | Nov | Dec | |
| Expenditures from Operations | |||||||||||||
| Cash Spending | $7,933 | $7,933 | $7,933 | $7,933 | $7,933 | $7,933 | $7,933 | $7,933 | $7,933 | $7,933 | $12,733 | $12,733 | |
| Bill Payments | $59 | $1,767 | $1,856 | $1,938 | $2,262 | $2,418 | $2,605 | $2,898 | $5,101 | $5,426 | $5,821 | $6,482 | |
| Subtotal Spent on Operations | $7,992 | $9,700 | $9,789 | $9,871 | $10,195 | $10,351 | $10,538 | $10,831 | $13,034 | $13,359 | $18,554 | $19,215 | |
| Additional Cash Spent | |||||||||||||
| Sales Tax, VAT, HST/GST Paid Out | $0 | $0 | $0 | $0 | $0 | $0 | $0 | $0 | $0 | $0 | $0 | $0 | |
| Principal Repayment of Current Borrowing | $0 | $0 | $0 | $0 | $0 | $0 | $0 | $0 | $0 | $0 | $0 | $0 | |
| Other Liabilities Principal Repayment | $0 | $0 | $0 | $0 | $0 | $0 | $0 | $0 | $0 | $0 | $0 | $0 | |
| Long-term Liabilities Principal Repayment | $0 | $0 | $4,200 | $0 | $0 | $0 | $0 | $0 | $0 | $0 | $0 | $0 | |
| Purchase Other Current Assets | $0 | $0 | $0 | $0 | $0 | $0 | $0 | $0 | $0 | $0 | $0 | $0 | |
| Purchase Long-term Assets | $0 | $0 | $0 | $0 | $0 | $0 | $0 | $0 | $0 | $0 | $0 | $0 | |
| Dividends | $0 | $0 | $0 | $0 | $0 | $0 | $0 | $0 | $0 | $0 | $0 | $0 | |
| Subtotal Cash Spent | $7,992 | $9,700 | $13,989 | $9,871 | $10,195 | $10,351 | $10,538 | $10,831 | $13,034 | $13,359 | $18,554 | $19,215 | |
| Net Cash Flow | ($4,833) | ($6,121) | $59,531 | ($5,747) | ($5,346) | ($4,632) | ($3,775) | ($2,815) | ($3,515) | ($2,037) | ($5,067) | ($3,131) | |
| Cash Balance | $10,961 | $4,840 | $64,370 | $58,623 | $53,277 | $48,645 | $44,870 | $42,055 | $38,540 | $36,503 | $31,436 | $28,306 | |
| Pro Forma Balance Sheet | |||||||||||||
| Jan | Feb | Mar | Apr | May | Jun | Jul | Aug | Sep | Oct | Nov | Dec | ||
| Assets | Starting Balances | ||||||||||||
| Current Assets | |||||||||||||
| Cash | $15,793 | $10,961 | $4,840 | $64,370 | $58,623 | $53,277 | $48,645 | $44,870 | $42,055 | $38,540 | $36,503 | $31,436 | $28,306 |
| Accounts Receivable | $1,125 | $562 | $0 | $0 | $0 | $0 | $0 | $0 | $0 | $0 | $0 | $0 | $0 |
| Other Current Assets | $0 | $0 | $0 | $0 | $0 | $0 | $0 | $0 | $0 | $0 | $0 | $0 | $0 |
| Total Current Assets | $16,918 | $11,523 | $4,840 | $64,370 | $58,623 | $53,277 | $48,645 | $44,870 | $42,055 | $38,540 | $36,503 | $31,436 | $28,306 |
| Long-term Assets | |||||||||||||
| Long-term Assets | $1,510 | $1,510 | $1,510 | $1,510 | $1,510 | $1,510 | $1,510 | $1,510 | $1,510 | $1,510 | $1,510 | $1,510 | $1,510 |
| Accumulated Depreciation | $0 | $0 | $0 | $0 | $0 | $0 | $0 | $0 | $0 | $0 | $0 | $0 | $0 |
| Total Long-term Assets | $1,510 | $1,510 | $1,510 | $1,510 | $1,510 | $1,510 | $1,510 | $1,510 | $1,510 | $1,510 | $1,510 | $1,510 | $1,510 |
| Total Assets | $18,428 | $13,033 | $6,350 | $65,881 | $60,134 | $54,787 | $50,155 | $46,380 | $43,565 | $40,050 | $38,013 | $32,946 | $29,816 |
| Liabilities and Capital | Jan | Feb | Mar | Apr | May | Jun | Jul | Aug | Sep | Oct | Nov | Dec | |
| Current Liabilities | |||||||||||||
| Accounts Payable | $0 | $1,705 | $1,792 | $1,863 | $2,182 | $2,332 | $2,511 | $2,728 | $4,920 | $5,233 | $5,606 | $6,248 | $6,785 |
| Current Borrowing | $0 | $0 | $0 | $0 | $0 | $0 | $0 | $0 | $0 | $0 | $0 | $0 | $0 |
| Other Current Liabilities | $0 | $0 | $0 | $0 | $0 | $0 | $0 | $0 | $0 | $0 | $0 | $0 | $0 |
| Subtotal Current Liabilities | $0 | $1,705 | $1,792 | $1,863 | $2,182 | $2,332 | $2,511 | $2,728 | $4,920 | $5,233 | $5,606 | $6,248 | $6,785 |
| Long-term Liabilities | $4,200 | $4,200 | $4,200 | $0 | $0 | $0 | $0 | $0 | $0 | $0 | $0 | $0 | $0 |
| Total Liabilities | $4,200 | $5,905 | $5,992 | $1,863 | $2,182 | $2,332 | $2,511 | $2,728 | $4,920 | $5,233 | $5,606 | $6,248 | $6,785 |
| Paid-in Capital | $15,657 | $15,657 | $15,657 | $85,657 | $85,657 | $85,657 | $85,657 | $85,657 | $85,657 | $85,657 | $85,657 | $85,657 | $85,657 |
| Retained Earnings | ($1,429) | ($1,429) | ($1,429) | ($1,429) | ($1,429) | ($1,429) | ($1,429) | ($1,429) | ($1,429) | ($1,429) | ($1,429) | ($1,429) | ($1,429) |
| Earnings | $0 | ($7,100) | ($13,870) | ($20,210) | ($26,276) | ($31,772) | ($36,584) | ($40,576) | ($45,583) | ($49,410) | ($51,820) | ($57,529) | ($61,197) |
| Total Capital | $14,228 | $7,128 | $358 | $64,018 | $57,952 | $52,456 | $47,644 | $43,652 | $38,645 | $34,818 | $32,408 | $26,699 | $23,031 |
| Total Liabilities and Capital | $18,428 | $13,033 | $6,350 | $65,881 | $60,134 | $54,787 | $50,155 | $46,380 | $43,565 | $40,050 | $38,013 | $32,946 | $29,816 |
| Net Worth | $14,228 | $7,128 | $358 | $64,018 | $57,952 | $52,456 | $47,644 | $43,652 | $38,645 | $34,818 | $32,408 | $26,699 | $23,031 |

