
Green Office
Executive Summary
Green Office addresses the market need of environmentally-friendly office supplies. Green Office has been formed as an Illinois Corporation with Stan Cooksey as the main shareholder. Green Office will service a wide range of customers including corporations and government agencies.
Products
Green Office will sell eco-friendly products that use recycled materials, reuse “recharged” existing parts, or use non-toxic alternatives. Green Office will sell recycled paper ranging from notepads to envelopes to copier paper, a wide range of laser toner, inkjet cartridges and common office supplies such as correction fluid.
Customers
Green Office has identified three market segments. The first is corporations, with an 8% growth rate and 12,000 potential customers. The second is government agencies, with a 11% growth rate and 7,886 possible customers. The last category is assorted customers with a 7% growth rate and 56,888 possible customers.
Competitive Edge
Green Office will offer a complete range of office supplies, to become a one-stop shopping place for supply needs. Green Office will offer an unprecedented level of customer attention. It recognizes that shopping must be the the most trouble free, pleasant experience if it expects to form long-term relationships with customers.
Management
Green Office will be lead by Stan Cooksey. Stan received his undergraduate degree from the University of Chicago. Stan worked for Symantec Software as the Regional Sales Manager for the Government Agency Unit. While working at Symantec, Stan received his Executive MBA.
Green Office is supported by a proven business model, carefully identified market segments, and a top notch management team. Green Office has forecasted sales for year two of $818,000, rising to $1,004,000 in year three. We will become profitable in the second year.

1.1 Objectives
- To become the premier source of environmentally-friendly office supplies.
- To offer green office supplies that cost no more than a 10% price premium, often at the same price as non “green” supplies.
- Quickly grow in size and become a profitable business within the first two years.
1.2 Mission
It is Green Office’s mission to become a leading vendor of environmentally-friendly office supplies. Green Office will become a market leader offering a wide, price competitive selection with the finest customer service.
1.3 Keys to Success
- Offer environmentally-friendly office supplies at competitive prices.
- Secure large contracts with corporations and government agencies.
- Ensure fiscal efficiency through strict financial controls.
Company Summary
Green Office is an Illinois corporation founded by Stan Cooksey.
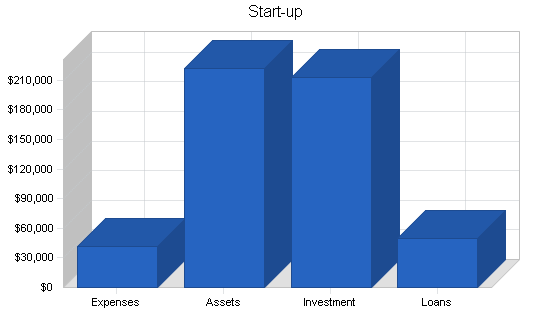
2.1 Start-up Summary
Green Office will incur the following start up expenses:
- Office desk sets with chairs and assorted supplies (6)
- Workstations and a central file server, two laser printers, and Internet connection (6)
- Copier, fax machine
- Assorted pieces of office furniture
- Assorted shipping material
- Unit phone system with answer service (7)
- Shelving units for storage
- Used fork lift
- Intercom system
- Warehouse build out
Start-up funds will be supported predominantly through equity investment, but in addition Stan will obtain a $50,000 SBA backed loan to assist in the purchase of start-up inventory.
| Start-up | |
| Requirements | |
| Start-up Expenses | |
| Legal | $3,000 |
| Stationery etc. | $500 |
| Brochures | $500 |
| Insurance | $300 |
| Web Site Development | $5,000 |
| Research and Development | $2,000 |
| Other | $30,000 |
| Total Start-up Expenses | $41,300 |
| Start-up Assets | |
| Cash Required | $128,700 |
| Start-up Inventory | $46,000 |
| Other Current Assets | $3,500 |
| Long-term Assets | $43,500 |
| Total Assets | $221,700 |
| Total Requirements | $263,000 |
| Start-up Funding | |
| Start-up Expenses to Fund | $41,300 |
| Start-up Assets to Fund | $221,700 |
| Total Funding Required | $263,000 |
| Assets | |
| Non-cash Assets from Start-up | $93,000 |
| Cash Requirements from Start-up | $128,700 |
| Additional Cash Raised | $0 |
| Cash Balance on Starting Date | $128,700 |
| Total Assets | $221,700 |
| Liabilities and Capital | |
| Liabilities | |
| Current Borrowing | $0 |
| Long-term Liabilities | $50,000 |
| Accounts Payable (Outstanding Bills) | $0 |
| Other Current Liabilities (interest-free) | $0 |
| Total Liabilities | $50,000 |
| Capital | |
| Planned Investment | |
| Investor 1 | $95,000 |
| Investor 2 | $68,000 |
| Other | $50,000 |
| Additional Investment Requirement | $0 |
| Total Planned Investment | $213,000 |
| Loss at Start-up (Start-up Expenses) | ($41,300) |
| Total Capital | $171,700 |
| Total Capital and Liabilities | $221,700 |
| Total Funding | $263,000 |
2.2 Company Ownership
Green Office is a privately held corporation owned by Stan Cooksey. Green Office has been incorporated in Illinois.
Products
Green Office offers a wide range of office supplies, all of which are environmentally friendly, they either use recycled content materials, sustainable products, or substitute toxic chemicals with non-toxic substitutes. Products include:
- Recycled clip boards
- Non-toxic correction fluid
- Recycled note pads (small and legal size)
- Recycled paper clips
- Recycled copier and printer paper
- Recycled envelopes
- Erasable boards
- Reusable coffee filters
- Recycled, refillable laser toner cartridges and inkjet cartridges
- Solar calculators
- Refillable pens and pencils made out of recyclable materials
- And many other items
Market Analysis Summary
Green Office believes that it faces a market with many opportunities and significant demand. Green Office’s three main customer segments will be corporations, government agencies, and others which is a “catch all” category.
The office supply industry operates with several different large companies and many small ones. Within the office supplies industry there exists a niche of environmentally-friendly companies that Green Office competes against. Some of these companies serve local markets, others are Web-based for broader coverage.
4.1 Market Segmentation
Green Office has identified three customer segments that it will go after:
- Corporations: This customer group is composed of companies, typically with at least 35 employees. This customer group makes purchases for the entire organization, however sometimes different groups within the same organization will make purchases individually.
These customers are interested in the purchase of environmentally-friendly supplies because of a decision by the owners for personal/corporate belief reasons or as part of a PR program that communicates to their customers that the business is committed to the environment and makes procurements based on environmental factors.
- Government Agencies: This segment is an ever expanding group. The foundation of this segment is Former President Clinton’s Executive Order (EO) 13101 entitled “Greening the Government Through Recycling, Waste Prevention, and Federal Acquisition.” This order requires the federal government to buy recycled content and environmentally preferable products.
The order directs the head of each executive agency to incorporate waste prevention and recycling and to increase and expand markets for recovered materials. The bottom line of this EO is that federal government agencies are forced to make environmentally-friendly office supply purchases. In addition, the majority of states have enacted similar legislation for their governmental agencies. These legislative requirements for environmentally-friendly products has created a huge market for Green Office.
- Other: This is a catch all segment that contains a wide range of entities such as small companies, individuals, school districts, etc.

| Market Analysis | |||||||
| Year 1 | Year 2 | Year 3 | Year 4 | Year 5 | |||
| Potential Customers | Growth | CAGR | |||||
| Corporations | 8% | 12,009 | 12,970 | 14,008 | 15,129 | 16,339 | 8.00% |
| Government Agencies | 3% | 7,886 | 8,123 | 8,367 | 8,618 | 8,877 | 3.00% |
| Other | 7% | 56,888 | 60,870 | 65,131 | 69,690 | 74,568 | 7.00% |
| Total | 6.77% | 76,783 | 81,963 | 87,506 | 93,437 | 99,784 | 6.77% |
4.2 Target Market Segment Strategy
As mentioned previously in the Market Segmentation section, three customer groups have been identified. Two of these, corporations and government agencies are quite attractive as customer segments. The third is used as a “catch all” category. The strategy will be the use of a targeted sales campaign that uses specific sales agents each of whom are responsible for a specific customer group.
The hiring process for these sales agents will be done with the specific group in mind. The agent responsible for the government agencies will be chosen based on his past experience and proficiency in selling to government agencies if possible. Green Office will therefore provide each experienced sales person with an exclusive territory, assisting them in achieving high sales marks for the respective customer group.
4.3 Industry Analysis
The broader industry that Green Office competes in the office supplies industry. Within that industry there are several market leaders:
- Staples
- OfficeMax
- Office Depot
All three of these companies offer both local retail stores as well as mail order/Internet sales. These are the leaders with a combined 59% market share. The remaining players in the market are made up of both mail order/Internet competitors as well as local retailers. Within this market is a newly developed niche of environmentally-friendly suppliers. The majority of companies competing in this niche are mail order/Internet based.

4.3.1 Competition and Buying Patterns
Competition comes from two sources, direct and indirect competitors. Direct competitors are companies that offer similar lines of environmentally-friendly products. The main companies are:
- Ecomall
- EcoProducts
- The Good Humans
The indirect competitors are companies within the office supplies industry who offer eco supplies, but do not concentrate on these products. Customers’ buying patterns are based on two main factors:
- Price: Both a relative comparison to standard office supplies as well as eco-friendly ones.
- Convenience: Ease of ordering, shipping schedule, variety of products.
Strategy and Implementation Summary
Green Office’s goal of becoming a major vendor of environmentally-friendly office supplies is an ambitious but achievable goal. Green Office will leverage its two part competitive edge to achieve this goal. The first edge is an unbeatable selection of green office supplies.
This all inclusive product catalog creates a compelling one stop shopping venue. This wonderful product selection will be supported by a customer-centric company culture. The marketing and sales strategies support these two competitive edges.
The marketing strategy seeks to develop an awareness of Green Office and its ability to offer a wide selection of eco-friendly office products. All products will be priced competitively, often at the same low price as non eco-friendly products.
The sales strategy will use specially engineered economic incentives that channel account manager behavior into the mode of ensuring, happy, long-term customers. This entire strategy is based on the company’s philosophy that it is far cheaper to maintain a current customer than it is to attract new ones.
5.1 Competitive Edge
Green Office competitive edge is two fold, a wide selection of office supplies making it a one stop shopping place and a strong customer service oriented organization where the customers are assigned a specific sales agent/account manager to assist them.
By offering a strong product catalog, customers are able to place all of their office supplies orders at one place instead of having to contact multiple vendors each week or month, whatever the interval may be. Creating the perception that all of the company’s office supply needs can be met by one company, Green Office has a competitive edge.
The second edge is Green Office’s focus on customer service. The company recognizes that if long-term sustainable growth is desired, the customers must feel like that they are being offered the finest service. This will ensure the building of a loyal customer base that will assist Green Office in becoming a sustainable operation.
5.2 Marketing Strategy
The marketing strategy will be based on a communication effort that announces Green Office’s two competitive edges, their selection and customer service. To be able to order all of an office’s supply needs from one easy-to-work-with vendor is a significant value. Backing up the extensive product catalog with top rate customer service will retain customers.
Green Office will undertake a marketing campaign that communicates its competitive edge. The campaign will rely primarily on print advertising. The media outlets to be used will be determined based on the readership levels and targeted companies. The campaign will develop an awareness of Green Office to the targeted customers. The development of an awareness or image of Green Office is the first step in the implementation strategy, the second step is the sales strategy detailed in the following section.
5.3 Sales Strategy
Green Office’s sales strategy will be based on the conversion of qualified sales leads into paying customers. The key emphasis here is customer service. Green Office recognizes that customers desire that their needs are taken care of.
Additionally, customers want a seemless experience where their expectations are managed. Green Office will accomplish these lofty goals by assigning a specific account manager/sales agent to each customer (assigned by the customer type). The sales agent receives a commission not just for the individual sale but also using a complex formula that takes into account long-term customer satisfaction of the client.
Green Office therefore has developed an economic incentive for its account managers to develop long-term customers. This incentive based system is key to the sales strategy because it creates an incentive for the sales agent to take into account Green Office’s strategic survival, not just the agents short-term compensation. In addition, long-term customers are more profitable than new customers.
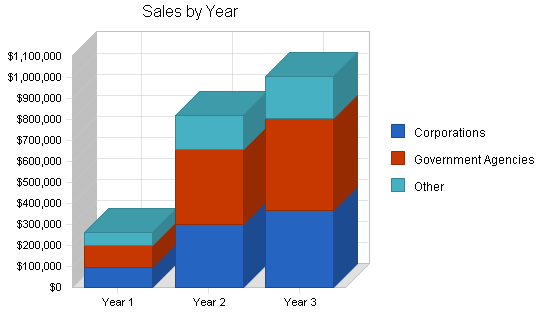
5.3.1 Sales Forecast
Green Office adopted a conservative forecast for the business plan. These conservative estimates will help ensure that the company does not face any cash flow shortages within the first couple of years The sales forecast also takes into account that Green Office is a start-up organization and it will take time to generate a level of sustainable sales. Sales will increase at a slow but steady rate. Please see the three following table and charts for graphical representation of the sales forecasts.

| Sales Forecast | |||
| Year 1 | Year 2 | Year 3 | |
| Sales | |||
| Corporations | $92,892 | $298,887 | $366,544 |
| Government Agencies | $107,470 | $358,664 | $439,853 |
| Other | $59,362 | $161,399 | $197,934 |
| Total Sales | $259,724 | $818,950 | $1,004,331 |
| Direct Cost of Sales | Year 1 | Year 2 | Year 3 |
| Corporations | $47,380 | $194,277 | $238,254 |
| Government Agencies | $56,856 | $233,132 | $285,904 |
| Other | $25,585 | $104,909 | $128,657 |
| Subtotal Direct Cost of Sales | $129,821 | $532,318 | $652,815 |
5.4 Milestones
Green Office has identified four specific milestones that will serve as goals for the organization to achieve. While the milestones are lofty in terms of qualitative standards and the timeline deadline, they are achievable.
- Business plan completion.
- First major government agency account.
- $200K in sales.
- Profitability.
| Milestones | |||||
| Milestone | Start Date | End Date | Budget | Manager | Department |
| Business plan completion | 1/1/2004 | 2/15/2004 | $0 | Stan | Business Development |
| First major government agency account | 1/1/2004 | 4/1/2004 | $0 | Sales Manager | Sales |
| $200K in sales | 1/1/2004 | 2/15/2005 | $0 | Sales Manager | Sales |
| Profitability | 1/1/2004 | 6/1/2005 | $0 | Stan | Entire company |
| Totals | $0 | ||||
Web Plan Summary
The website will be developed to offer customers a product catalog for online orders. The overriding design philosophy of the site is ease of use. Green Office wants to make the process of placing an order as easy and fast as possible thereby encouraging increased sales. Green Office will incorporate special features such as a section that is specific to each customer so the customer can easily make purchases of repeat items. Instead of going through the website every month and locating their monthly needs, the site captures regularly ordered items for that specific customer, significantly speeding up the ordering process. This ease-of-use feature will help increase sales as customers become more and more familiar with the site and appreciate how easy it is to place an order.
6.1 Website Marketing Strategy
The marketing strategy for the website will begin initially with a simple strategy of search engine submissions and the use of pay-per-clicks which is a service of Google and Overture where the company pays the search engine every time a surfer clicks through to the Green Office site.
6.2 Development Requirements
Green Office has secured a start-up website design company to design and develop the site. As a result, the company is able to negotiate a favorable rate for the development and maintenance of the site.
Management Summary
Green Office is lead by Stan Cooksey. Stan received his undergraduate degree of business from the University of Chicago. After graduation Stan accepted a position from The Symantec Software Corporation as the regional sales manager for the government agency group. After five years in this group Stan enrolled in an Executive MBA Program at Loyola University. At the conclusion of this program Stan received an advancement to become a vice president of sales for the United States. Stan left his position at Symantec to start Green Office.
7.1 Personnel Plan
- Stan: Operations, business development, some finance, some accounting.
- Willma (Stan’s wife): Procurement, marketing.
- Sales: Account manager functions.
- Accounting: Part-time accounting clerk.
- Shipping: Responsible for order filling.
- Administrative/customer support.
| Personnel Plan | |||
| Year 1 | Year 2 | Year 3 | |
| Stan | $20,000 | $22,000 | $24,200 |
| Willma | $20,000 | $22,000 | $24,200 |
| Sales | $15,000 | $16,500 | $18,150 |
| Sales | $12,000 | $13,200 | $14,520 |
| Sales | $9,000 | $9,900 | $10,890 |
| Accounting | $6,400 | $7,040 | $7,744 |
| Shipping | $15,000 | $16,500 | $18,150 |
| Shipping | $12,000 | $13,200 | $14,520 |
| Shipping | $7,000 | $7,700 | $8,470 |
| Admin/customer support | $10,000 | $11,000 | $12,100 |
| Admin/customer support | $4,800 | $5,280 | $5,808 |
| Total People | 11 | 11 | 11 |
| Total Payroll | $131,200 | $144,320 | $158,752 |
Financial Plan
The following sections will outline important financial information.
8.1 Important Assumptions
The following table details important Financial Assumptions.
| General Assumptions | |||
| Year 1 | Year 2 | Year 3 | |
| Plan Month | 1 | 2 | 3 |
| Current Interest Rate | 9.00% | 9.00% | 9.00% |
| Long-term Interest Rate | 8.00% | 8.00% | 8.00% |
| Tax Rate | 30.00% | 30.00% | 30.00% |
| Other | 0 | 0 | 0 |
8.2 Break-even Analysis
The following table and chart show our break-even analysis.

| Break-even Analysis | |
| Monthly Revenue Break-even | $31,303 |
| Assumptions: | |
| Average Percent Variable Cost | 50% |
| Estimated Monthly Fixed Cost | $15,657 |
8.3 Projected Profit and Loss
The following table will indicate Projected Profit and Loss.


| Pro Forma Profit and Loss | |||
| Year 1 | Year 2 | Year 3 | |
| Sales | $259,724 | $818,950 | $1,004,331 |
| Direct Cost of Sales | $129,821 | $532,318 | $652,815 |
| Other Costs of Goods | $0 | $0 | $0 |
| Total Cost of Sales | $129,821 | $532,318 | $652,815 |
| Gross Margin | $129,903 | $286,633 | $351,516 |
| Gross Margin % | 50.02% | 35.00% | 35.00% |
| Expenses | |||
| Payroll | $131,200 | $144,320 | $158,752 |
| Sales and Marketing and Other Expenses | $2,400 | $2,400 | $2,400 |
| Depreciation | $8,700 | $8,700 | $8,700 |
| Rent | $12,000 | $12,000 | $12,000 |
| Utilities | $6,000 | $6,000 | $6,000 |
| Insurance | $2,400 | $2,400 | $2,400 |
| Payroll Taxes | $19,680 | $27,180 | $28,080 |
| Website Maintenance | $5,500 | $6,500 | $7,500 |
| Total Operating Expenses | $187,880 | $209,500 | $225,832 |
| Profit Before Interest and Taxes | ($57,977) | $77,133 | $125,684 |
| EBITDA | ($49,277) | $85,833 | $134,384 |
| Interest Expense | $3,854 | $3,731 | $3,500 |
| Taxes Incurred | $0 | $22,021 | $36,655 |
| Net Profit | ($61,831) | $51,381 | $85,528 |
| Net Profit/Sales | -23.81% | 6.27% | 8.52% |
8.4 Projected Cash Flow
The following chart and table will indicate Projected Cash Flow.

| Pro Forma Cash Flow | |||
| Year 1 | Year 2 | Year 3 | |
| Cash Received | |||
| Cash from Operations | |||
| Cash Sales | $64,931 | $204,738 | $251,083 |
| Cash from Receivables | $151,445 | $520,877 | $722,308 |
| Subtotal Cash from Operations | $216,376 | $725,615 | $973,390 |
| Additional Cash Received | |||
| Sales Tax, VAT, HST/GST Received | $0 | $0 | $0 |
| New Current Borrowing | $0 | $3,000 | $0 |
| New Other Liabilities (interest-free) | $0 | $0 | $0 |
| New Long-term Liabilities | $0 | $0 | $0 |
| Sales of Other Current Assets | $0 | $0 | $0 |
| Sales of Long-term Assets | $0 | $0 | $0 |
| New Investment Received | $0 | $36,000 | $0 |
| Subtotal Cash Received | $216,376 | $764,615 | $973,390 |
| Expenditures | Year 1 | Year 2 | Year 3 |
| Expenditures from Operations | |||
| Cash Spending | $131,200 | $144,320 | $158,752 |
| Bill Payments | $130,946 | $601,459 | $748,773 |
| Subtotal Spent on Operations | $262,146 | $745,779 | $907,525 |
| Additional Cash Spent | |||
| Sales Tax, VAT, HST/GST Paid Out | $0 | $0 | $0 |
| Principal Repayment of Current Borrowing | $0 | $0 | $2,234 |
| Other Liabilities Principal Repayment | $0 | $0 | $0 |
| Long-term Liabilities Principal Repayment | $3,403 | $3,302 | $3,324 |
| Purchase Other Current Assets | $0 | $0 | $0 |
| Purchase Long-term Assets | $0 | $0 | $0 |
| Dividends | $0 | $0 | $0 |
| Subtotal Cash Spent | $265,548 | $749,080 | $913,083 |
| Net Cash Flow | ($49,173) | $15,534 | $60,308 |
| Cash Balance | $79,527 | $95,062 | $155,369 |
8.5 Projected Balance Sheet
The following table will indicate the Projected Balance Sheet.
| Pro Forma Balance Sheet | |||
| Year 1 | Year 2 | Year 3 | |
| Assets | |||
| Current Assets | |||
| Cash | $79,527 | $95,062 | $155,369 |
| Other Current Assets | $3,500 | $3,500 | $3,500 |
| Total Current Assets | $141,788 | $269,506 | $368,509 |
| Long-term Assets | |||
| Long-term Assets | $43,500 | $43,500 | $43,500 |
| Accumulated Depreciation | $8,700 | $17,400 | $26,100 |
| Total Long-term Assets | $34,800 | $26,100 | $17,400 |
| Total Assets | $176,588 | $295,606 | $385,909 |
| Liabilities and Capital | Year 1 | Year 2 | Year 3 |
| Current Liabilities | |||
| Accounts Payable | $20,122 | $52,060 | $62,392 |
| Current Borrowing | $0 | $3,000 | $766 |
| Other Current Liabilities | $0 | $0 | $0 |
| Subtotal Current Liabilities | $20,122 | $55,060 | $63,158 |
| Long-term Liabilities | $46,597 | $43,296 | $39,972 |
| Total Liabilities | $66,719 | $98,356 | $103,131 |
| Paid-in Capital | $213,000 | $249,000 | $249,000 |
| Retained Earnings | ($41,300) | ($103,131) | ($51,750) |
| Earnings | ($61,831) | $51,381 | $85,528 |
| Total Capital | $109,869 | $197,250 | $282,779 |
| Total Liabilities and Capital | $176,588 | $295,606 | $385,909 |
| Net Worth | $109,869 | $197,250 | $282,779 |
8.6 Business Ratios
The following table shows common Business Ratios, specific to Green Office as well as to the industry as a whole.
| Ratio Analysis | ||||
| Year 1 | Year 2 | Year 3 | Industry Profile | |
| Sales Growth | 0.00% | 215.32% | 22.64% | 1.50% |
| Percent of Total Assets | ||||
| Accounts Receivable | 24.55% | 46.24% | 43.44% | 38.65% |
| Inventory | 8.73% | 11.59% | 10.89% | 28.15% |
| Other Current Assets | 1.98% | 1.18% | 0.91% | 18.82% |
| Total Current Assets | 80.29% | 91.17% | 95.49% | 85.62% |
| Long-term Assets | 19.71% | 8.83% | 4.51% | 14.38% |
| Total Assets | 100.00% | 100.00% | 100.00% | 100.00% |
| Current Liabilities | 11.39% | 18.63% | 16.37% | 43.40% |
| Long-term Liabilities | 26.39% | 14.65% | 10.36% | 11.10% |
| Total Liabilities | 37.78% | 33.27% | 26.72% | 54.50% |
| Net Worth | 62.22% | 66.73% | 73.28% | 45.50% |
| Percent of Sales | ||||
| Sales | 100.00% | 100.00% | 100.00% | 100.00% |
| Gross Margin | 50.02% | 35.00% | 35.00% | 22.64% |
| Selling, General & Administrative Expenses | 96.00% | 31.88% | 28.47% | 13.42% |
| Advertising Expenses | 0.00% | 0.00% | 0.00% | 0.26% |
| Profit Before Interest and Taxes | -22.32% | 9.42% | 12.51% | 1.70% |
| Main Ratios | ||||
| Current | 7.05 | 4.89 | 5.83 | 1.77 |
| Quick | 6.28 | 4.27 | 5.17 | 1.07 |
| Total Debt to Total Assets | 37.78% | 33.27% | 26.72% | 5.52% |
| Pre-tax Return on Net Worth | -56.28% | 37.21% | 43.21% | 59.64% |
| Pre-tax Return on Assets | -35.01% | 24.83% | 31.66% | 13.69% |
| Additional Ratios | Year 1 | Year 2 | Year 3 | |
| Net Profit Margin | -23.81% | 6.27% | 8.52% | n.a |
| Return on Equity | -56.28% | 26.05% | 30.25% | n.a |
| Activity Ratios | ||||
| Accounts Receivable Turnover | 4.49 | 4.49 | 4.49 | n.a |
| Collection Days | 56 | 53 | 74 | n.a |
| Inventory Turnover | 5.91 | 21.43 | 17.12 | n.a |
| Accounts Payable Turnover | 7.51 | 12.17 | 12.17 | n.a |
| Payment Days | 27 | 21 | 28 | n.a |
| Total Asset Turnover | 1.47 | 2.77 | 2.60 | n.a |
| Debt Ratios | ||||
| Debt to Net Worth | 0.61 | 0.50 | 0.36 | n.a |
| Current Liab. to Liab. | 0.30 | 0.56 | 0.61 | n.a |
| Liquidity Ratios | ||||
| Net Working Capital | $121,666 | $214,446 | $305,351 | n.a |
| Interest Coverage | -15.04 | 20.67 | 35.91 | n.a |
| Additional Ratios | ||||
| Assets to Sales | 0.68 | 0.36 | 0.38 | n.a |
| Current Debt/Total Assets | 11% | 19% | 16% | n.a |
| Acid Test | 4.13 | 1.79 | 2.52 | n.a |
| Sales/Net Worth | 2.36 | 4.15 | 3.55 | n.a |
| Dividend Payout | 0.00 | 0.00 | 0.00 | n.a |
Appendix
| Sales Forecast | |||||||||||||
| Month 1 | Month 2 | Month 3 | Month 4 | Month 5 | Month 6 | Month 7 | Month 8 | Month 9 | Month 10 | Month 11 | Month 12 | ||
| Sales | |||||||||||||
| Corporations | 0% | $0 | $0 | $7,645 | $8,212 | $8,455 | $8,747 | $9,212 | $9,454 | $9,987 | $10,112 | $10,414 | $10,654 |
| Government Agencies | 0% | $0 | $0 | $8,774 | $9,454 | $9,746 | $10,096 | $10,654 | $10,945 | $11,584 | $11,734 | $12,097 | $12,385 |
| Other | 0% | $0 | $0 | $5,048 | $5,354 | $5,486 | $5,643 | $5,894 | $6,025 | $6,313 | $6,380 | $6,544 | $6,673 |
| Total Sales | $0 | $0 | $21,467 | $23,021 | $23,687 | $24,487 | $25,761 | $26,424 | $27,884 | $28,227 | $29,054 | $29,712 | |
| Direct Cost of Sales | Month 1 | Month 2 | Month 3 | Month 4 | Month 5 | Month 6 | Month 7 | Month 8 | Month 9 | Month 10 | Month 11 | Month 12 | |
| Corporations | $0 | $0 | $3,669 | $4,038 | $4,196 | $4,386 | $4,688 | $4,845 | $5,192 | $5,273 | $5,469 | $5,625 | |
| Government Agencies | $0 | $0 | $4,403 | $4,845 | $5,035 | $5,263 | $5,625 | $5,814 | $6,230 | $6,327 | $6,563 | $6,750 | |
| Other | $0 | $0 | $1,981 | $2,180 | $2,266 | $2,368 | $2,531 | $2,616 | $2,803 | $2,847 | $2,953 | $3,038 | |
| Subtotal Direct Cost of Sales | $0 | $0 | $10,054 | $11,064 | $11,496 | $12,016 | $12,845 | $13,276 | $14,225 | $14,447 | $14,985 | $15,413 | |
| Personnel Plan | |||||||||||||
| Month 1 | Month 2 | Month 3 | Month 4 | Month 5 | Month 6 | Month 7 | Month 8 | Month 9 | Month 10 | Month 11 | Month 12 | ||
| Stan | 0% | $0 | $0 | $2,000 | $2,000 | $2,000 | $2,000 | $2,000 | $2,000 | $2,000 | $2,000 | $2,000 | $2,000 |
| Willma | 0% | $0 | $0 | $2,000 | $2,000 | $2,000 | $2,000 | $2,000 | $2,000 | $2,000 | $2,000 | $2,000 | $2,000 |
| Sales | 0% | $0 | $0 | $1,500 | $1,500 | $1,500 | $1,500 | $1,500 | $1,500 | $1,500 | $1,500 | $1,500 | $1,500 |
| Sales | 0% | $0 | $0 | $0 | $0 | $1,500 | $1,500 | $1,500 | $1,500 | $1,500 | $1,500 | $1,500 | $1,500 |
| Sales | 0% | $0 | $0 | $0 | $0 | $0 | $0 | $1,500 | $1,500 | $1,500 | $1,500 | $1,500 | $1,500 |
| Accounting | 0% | $0 | $0 | $0 | $0 | $800 | $800 | $800 | $800 | $800 | $800 | $800 | $800 |
| Shipping | 0% | $0 | $0 | $1,500 | $1,500 | $1,500 | $1,500 | $1,500 | $1,500 | $1,500 | $1,500 | $1,500 | $1,500 |
| Shipping | 0% | $0 | $0 | $0 | $0 | $1,500 | $1,500 | $1,500 | $1,500 | $1,500 | $1,500 | $1,500 | $1,500 |
| Shipping | 0% | $0 | $0 | $0 | $0 | $0 | $1,000 | $1,000 | $1,000 | $1,000 | $1,000 | $1,000 | $1,000 |
| Admin/customer support | 0% | $0 | $0 | $1,000 | $1,000 | $1,000 | $1,000 | $1,000 | $1,000 | $1,000 | $1,000 | $1,000 | $1,000 |
| Admin/customer support | 0% | $0 | $0 | $0 | $0 | $0 | $0 | $800 | $800 | $800 | $800 | $800 | $800 |
| Total People | 0 | 0 | 5 | 5 | 8 | 9 | 11 | 11 | 11 | 11 | 11 | 11 | |
| Total Payroll | $0 | $0 | $8,000 | $8,000 | $11,800 | $12,800 | $15,100 | $15,100 | $15,100 | $15,100 | $15,100 | $15,100 | |
| General Assumptions | |||||||||||||
| Month 1 | Month 2 | Month 3 | Month 4 | Month 5 | Month 6 | Month 7 | Month 8 | Month 9 | Month 10 | Month 11 | Month 12 | ||
| Plan Month | 1 | 2 | 3 | 4 | 5 | 6 | 7 | 8 | 9 | 10 | 11 | 12 | |
| Current Interest Rate | 9.00% | 9.00% | 9.00% | 9.00% | 9.00% | 9.00% | 9.00% | 9.00% | 9.00% | 9.00% | 9.00% | 9.00% | |
| Long-term Interest Rate | 8.00% | 8.00% | 8.00% | 8.00% | 8.00% | 8.00% | 8.00% | 8.00% | 8.00% | 8.00% | 8.00% | 8.00% | |
| Tax Rate | 30.00% | 30.00% | 30.00% | 30.00% | 30.00% | 30.00% | 30.00% | 30.00% | 30.00% | 30.00% | 30.00% | 30.00% | |
| Other | 0 | 0 | 0 | 0 | 0 | 0 | 0 | 0 | 0 | 0 | 0 | 0 | |
| Pro Forma Profit and Loss | |||||||||||||
| Month 1 | Month 2 | Month 3 | Month 4 | Month 5 | Month 6 | Month 7 | Month 8 | Month 9 | Month 10 | Month 11 | Month 12 | ||
| Sales | $0 | $0 | $21,467 | $23,021 | $23,687 | $24,487 | $25,761 | $26,424 | $27,884 | $28,227 | $29,054 | $29,712 | |
| Direct Cost of Sales | $0 | $0 | $10,054 | $11,064 | $11,496 | $12,016 | $12,845 | $13,276 | $14,225 | $14,447 | $14,985 | $15,413 | |
| Other Costs of Goods | $0 | $0 | $0 | $0 | $0 | $0 | $0 | $0 | $0 | $0 | $0 | $0 | |
| Total Cost of Sales | $0 | $0 | $10,054 | $11,064 | $11,496 | $12,016 | $12,845 | $13,276 | $14,225 | $14,447 | $14,985 | $15,413 | |
| Gross Margin | $0 | $0 | $11,414 | $11,957 | $12,190 | $12,470 | $12,916 | $13,148 | $13,660 | $13,779 | $14,069 | $14,299 | |
| Gross Margin % | 0.00% | 0.00% | 53.17% | 51.94% | 51.46% | 50.93% | 50.14% | 49.76% | 48.99% | 48.82% | 48.42% | 48.13% | |
| Expenses | |||||||||||||
| Payroll | $0 | $0 | $8,000 | $8,000 | $11,800 | $12,800 | $15,100 | $15,100 | $15,100 | $15,100 | $15,100 | $15,100 | |
| Sales and Marketing and Other Expenses | $200 | $200 | $200 | $200 | $200 | $200 | $200 | $200 | $200 | $200 | $200 | $200 | |
| Depreciation | $725 | $725 | $725 | $725 | $725 | $725 | $725 | $725 | $725 | $725 | $725 | $725 | |
| Rent | $1,000 | $1,000 | $1,000 | $1,000 | $1,000 | $1,000 | $1,000 | $1,000 | $1,000 | $1,000 | $1,000 | $1,000 | |
| Utilities | $500 | $500 | $500 | $500 | $500 | $500 | $500 | $500 | $500 | $500 | $500 | $500 | |
| Insurance | $200 | $200 | $200 | $200 | $200 | $200 | $200 | $200 | $200 | $200 | $200 | $200 | |
| Payroll Taxes | 15% | $0 | $0 | $1,200 | $1,200 | $1,770 | $1,920 | $2,265 | $2,265 | $2,265 | $2,265 | $2,265 | $2,265 |
| Website Maintenance | $0 | $500 | $500 | $500 | $500 | $500 | $500 | $500 | $500 | $500 | $500 | $500 | |
| Total Operating Expenses | $2,625 | $3,125 | $12,325 | $12,325 | $16,695 | $17,845 | $20,490 | $20,490 | $20,490 | $20,490 | $20,490 | $20,490 | |
| Profit Before Interest and Taxes | ($2,625) | ($3,125) | ($911) | ($368) | ($4,505) | ($5,375) | ($7,574) | ($7,342) | ($6,830) | ($6,711) | ($6,421) | ($6,191) | |
| EBITDA | ($1,900) | ($2,400) | ($186) | $357 | ($3,780) | ($4,650) | ($6,849) | ($6,617) | ($6,105) | ($5,986) | ($5,696) | ($5,466) | |
| Interest Expense | $332 | $330 | $328 | $326 | $324 | $322 | $320 | $318 | $316 | $315 | $313 | $311 | |
| Taxes Incurred | $0 | $0 | $0 | $0 | $0 | $0 | $0 | $0 | $0 | $0 | $0 | $0 | |
| Net Profit | ($2,957) | ($3,455) | ($1,239) | ($694) | ($4,829) | ($5,697) | ($7,894) | ($7,660) | ($7,147) | ($7,025) | ($6,734) | ($6,501) | |
| Net Profit/Sales | 0.00% | 0.00% | -5.77% | -3.01% | -20.39% | -23.26% | -30.64% | -28.99% | -25.63% | -24.89% | -23.18% | -21.88% | |
| Pro Forma Cash Flow | |||||||||||||
| Month 1 | Month 2 | Month 3 | Month 4 | Month 5 | Month 6 | Month 7 | Month 8 | Month 9 | Month 10 | Month 11 | Month 12 | ||
| Cash Received | |||||||||||||
| Cash from Operations | |||||||||||||
| Cash Sales | $0 | $0 | $5,367 | $5,755 | $5,922 | $6,122 | $6,440 | $6,606 | $6,971 | $7,057 | $7,264 | $7,428 | |
| Cash from Receivables | $0 | $0 | $0 | $537 | $16,139 | $17,282 | $17,785 | $18,397 | $19,337 | $19,854 | $20,922 | $21,191 | |
| Subtotal Cash from Operations | $0 | $0 | $5,367 | $6,292 | $22,061 | $23,404 | $24,225 | $25,003 | $26,308 | $26,911 | $28,185 | $28,619 | |
| Additional Cash Received | |||||||||||||
| Sales Tax, VAT, HST/GST Received | 0.00% | $0 | $0 | $0 | $0 | $0 | $0 | $0 | $0 | $0 | $0 | $0 | $0 |
| New Current Borrowing | $0 | $0 | $0 | $0 | $0 | $0 | $0 | $0 | $0 | $0 | $0 | $0 | |
| New Other Liabilities (interest-free) | $0 | $0 | $0 | $0 | $0 | $0 | $0 | $0 | $0 | $0 | $0 | $0 | |
| New Long-term Liabilities | $0 | $0 | $0 | $0 | $0 | $0 | $0 | $0 | $0 | $0 | $0 | $0 | |
| Sales of Other Current Assets | $0 | $0 | $0 | $0 | $0 | $0 | $0 | $0 | $0 | $0 | $0 | $0 | |
| Sales of Long-term Assets | $0 | $0 | $0 | $0 | $0 | $0 | $0 | $0 | $0 | $0 | $0 | $0 | |
| New Investment Received | $0 | $0 | $0 | $0 | $0 | $0 | $0 | $0 | $0 | $0 | $0 | $0 | |
| Subtotal Cash Received | $0 | $0 | $5,367 | $6,292 | $22,061 | $23,404 | $24,225 | $25,003 | $26,308 | $26,911 | $28,185 | $28,619 | |
| Expenditures | Month 1 | Month 2 | Month 3 | Month 4 | Month 5 | Month 6 | Month 7 | Month 8 | Month 9 | Month 10 | Month 11 | Month 12 | |
| Expenditures from Operations | |||||||||||||
| Cash Spending | $0 | $0 | $8,000 | $8,000 | $11,800 | $12,800 | $15,100 | $15,100 | $15,100 | $15,100 | $15,100 | $15,100 | |
| Bill Payments | $74 | $2,248 | $2,770 | $3,928 | $3,945 | $4,854 | $15,401 | $18,659 | $18,739 | $20,139 | $19,678 | $20,511 | |
| Subtotal Spent on Operations | $74 | $2,248 | $10,770 | $11,928 | $15,745 | $17,654 | $30,501 | $33,759 | $33,839 | $35,239 | $34,778 | $35,611 | |
| Additional Cash Spent | |||||||||||||
| Sales Tax, VAT, HST/GST Paid Out | $0 | $0 | $0 | $0 | $0 | $0 | $0 | $0 | $0 | $0 | $0 | $0 | |
| Principal Repayment of Current Borrowing | $0 | $0 | $0 | $0 | $0 | $0 | $0 | $0 | $0 | $0 | $0 | $0 | |
| Other Liabilities Principal Repayment | $0 | $0 | $0 | $0 | $0 | $0 | $0 | $0 | $0 | $0 | $0 | $0 | |
| Long-term Liabilities Principal Repayment | $273 | $275 | $277 | $279 | $281 | $283 | $284 | $286 | $288 | $290 | $292 | $294 | |
| Purchase Other Current Assets | $0 | $0 | $0 | $0 | $0 | $0 | $0 | $0 | $0 | $0 | $0 | $0 | |
| Purchase Long-term Assets | $0 | $0 | $0 | $0 | $0 | $0 | $0 | $0 | $0 | $0 | $0 | $0 | |
| Dividends | $0 | $0 | $0 | $0 | $0 | $0 | $0 | $0 | $0 | $0 | $0 | $0 | |
| Subtotal Cash Spent | $348 | $2,523 | $11,047 | $12,207 | $16,026 | $17,936 | $30,785 | $34,045 | $34,127 | $35,529 | $35,070 | $35,905 | |
| Net Cash Flow | ($348) | ($2,523) | ($5,680) | ($5,915) | $6,035 | $5,468 | ($6,560) | ($9,043) | ($7,819) | ($8,618) | ($6,885) | ($7,286) | |
| Cash Balance | $128,352 | $125,829 | $120,149 | $114,235 | $120,270 | $125,738 | $119,177 | $110,135 | $102,316 | $93,698 | $86,814 | $79,527 | |
| Pro Forma Balance Sheet | |||||||||||||
| Month 1 | Month 2 | Month 3 | Month 4 | Month 5 | Month 6 | Month 7 | Month 8 | Month 9 | Month 10 | Month 11 | Month 12 | ||
| Assets | Starting Balances | ||||||||||||
| Current Assets | |||||||||||||
| Cash | $128,700 | $128,352 | $125,829 | $120,149 | $114,235 | $120,270 | $125,738 | $119,177 | $110,135 | $102,316 | $93,698 | $86,814 | $79,527 |
| Other Current Assets | $3,500 | $3,500 | $3,500 | $3,500 | $3,500 | $3,500 | $3,500 | $3,500 | $3,500 | $3,500 | $3,500 | $3,500 | $3,500 |
| Total Current Assets | $178,200 | $177,852 | $175,329 | $175,696 | $175,447 | $171,612 | $176,792 | $172,596 | $165,405 | $160,112 | $153,032 | $147,554 | $141,788 |
| Long-term Assets | |||||||||||||
| Long-term Assets | $43,500 | $43,500 | $43,500 | $43,500 | $43,500 | $43,500 | $43,500 | $43,500 | $43,500 | $43,500 | $43,500 | $43,500 | $43,500 |
| Accumulated Depreciation | $0 | $725 | $1,450 | $2,175 | $2,900 | $3,625 | $4,350 | $5,075 | $5,800 | $6,525 | $7,250 | $7,975 | $8,700 |
| Total Long-term Assets | $43,500 | $42,775 | $42,050 | $41,325 | $40,600 | $39,875 | $39,150 | $38,425 | $37,700 | $36,975 | $36,250 | $35,525 | $34,800 |
| Total Assets | $221,700 | $220,627 | $217,379 | $217,021 | $216,047 | $211,487 | $215,942 | $211,021 | $203,105 | $197,087 | $189,282 | $183,079 | $176,588 |
| Liabilities and Capital | Month 1 | Month 2 | Month 3 | Month 4 | Month 5 | Month 6 | Month 7 | Month 8 | Month 9 | Month 10 | Month 11 | Month 12 | |
| Current Liabilities | |||||||||||||
| Accounts Payable | $0 | $2,157 | $2,639 | $3,797 | $3,795 | $4,344 | $14,779 | $18,036 | $18,067 | $19,484 | $18,995 | $19,817 | $20,122 |
| Current Borrowing | $0 | $0 | $0 | $0 | $0 | $0 | $0 | $0 | $0 | $0 | $0 | $0 | $0 |
| Other Current Liabilities | $0 | $0 | $0 | $0 | $0 | $0 | $0 | $0 | $0 | $0 | $0 | $0 | $0 |
| Subtotal Current Liabilities | $0 | $2,157 | $2,639 | $3,797 | $3,795 | $4,344 | $14,779 | $18,036 | $18,067 | $19,484 | $18,995 | $19,817 | $20,122 |
| Long-term Liabilities | $50,000 | $49,727 | $49,452 | $49,175 | $48,896 | $48,615 | $48,333 | $48,048 | $47,762 | $47,474 | $47,183 | $46,891 | $46,597 |
| Total Liabilities | $50,000 | $51,884 | $52,090 | $52,972 | $52,691 | $52,959 | $63,112 | $66,084 | $65,829 | $66,957 | $66,178 | $66,709 | $66,719 |
| Paid-in Capital | $213,000 | $213,000 | $213,000 | $213,000 | $213,000 | $213,000 | $213,000 | $213,000 | $213,000 | $213,000 | $213,000 | $213,000 | $213,000 |
| Retained Earnings | ($41,300) | ($41,300) | ($41,300) | ($41,300) | ($41,300) | ($41,300) | ($41,300) | ($41,300) | ($41,300) | ($41,300) | ($41,300) | ($41,300) | ($41,300) |
| Earnings | $0 | ($2,957) | ($6,411) | ($7,650) | ($8,344) | ($13,173) | ($18,870) | ($26,764) | ($34,424) | ($41,571) | ($48,596) | ($55,329) | ($61,831) |
| Total Capital | $171,700 | $168,743 | $165,289 | $164,050 | $163,356 | $158,527 | $152,830 | $144,936 | $137,276 | $130,129 | $123,104 | $116,371 | $109,869 |
| Total Liabilities and Capital | $221,700 | $220,627 | $217,379 | $217,021 | $216,047 | $211,487 | $215,942 | $211,021 | $203,105 | $197,087 | $189,282 | $183,079 | $176,588 |
| Net Worth | $171,700 | $168,743 | $165,289 | $164,050 | $163,356 | $158,527 | $152,830 | $144,936 | $137,276 | $130,129 | $123,104 | $116,371 | $109,869 |

