
WorkChairs
Executive Summary
WorkChairs is an ergonomic product business located in Studio City, California that focuses on selling hard-to-find ergonomic products to both the local community and through their website online. WorkChairs is owned by Jake and Lisa Wilson, and is a corporation with one other employee, Peter Wilson.
WorkChairs will use two sales channels and focus on selling niche products that solve ergonomic health problems that have become more common as people use computers more and more in their daily work days. By using traditional local marketing and sales techniques, WorkChairs will establish a solid local customer base in the home office, small business, and large business communities. To supplement the business and take advantage of manufacturer relationships that include drop-shipping, WorkChairs will have a website that has both an online store and an educational section to teach people about ergonomic problems.
WorkChairs has a conservative financial plan with low expenses, low payroll, and a conservative sales forecast. WorkChairs will always maintain a positive cash balance while slowly growing the total cash and company net worth.

1.1 Mission
WorkChairs is a specialty ergonomic product retailer in both the local market and in the online space. We aim to provide quality products to satisfy our customers desire to work in a healthy work environment that keeps them injury and pain-free. Keeping our customers happy and solving their problems by providing great products at an affordable price is our goal.
We also take pride in educating our customers on ergonomic issues that they might not be aware of, to prevent them from experiencing pain and discomfort in the future as well. We find doing this is rewarding in a personal and business sense.
1.2 Keys to Success
- Provide specialty products that can’t be found at “large box” retailers such as Office Max, Office Depot, Staples, Costco, Ikea, and others. We want niche products that can’t be found at these stores, because we can’t compete with them on price.
- Provide excellent customer service. It’s difficult to find customers who are aware enough of the health issues of standard office work to actually realize they need ergonomic products. So once we find these customers, we need to keep them happy and keep them coming back to us for future products they need.
- Keep our growth slow and organic so we can make sure we keep expenses low and operate efficiently.
- Build an easy-to-use website that educates our customers and potential customers while also selling our products effectively.
1.3 Objectives
- Becoming profitable after six months of operation.
- Be the market share leader of specialty ergonomic products in the local market. There is no official measurement, but it should be relatively easy to guess how our few competitors are doing.
- Have our website be one of the top five websites for specialty ergonomic products measured by both traffic and sales. Unfortunately, we can’t get sales statistics for other competing sites, but we can judge by their traffic levels based on their search engine placement, pay per click advertising, links in to their site, and Google Pagerank. From there we can guess at how well their site converts visitors into sales.
- Have fun helping our customers work in a safer and more comfortable work environment.
Company Summary
2.1 Company Ownership
Workchairs is a private C corporation owned by Jake and Lisa Wilson. They each own 50% of the company.
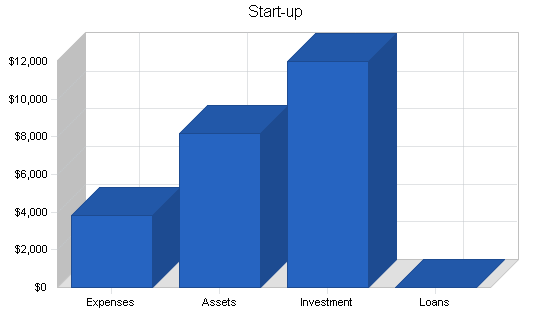
2.2 Start-up Summary
WorkChairs will require total start-up expenses which include legal fees in setting up the business, stationery, sales brochures and collateral, insurance, expensed computer equipment, and a domain name.
Jake and Lisa Wilson will be providing the investment which will cover the start-up expenses while also leaving a cash reserve. We have no start-up liabilities to be considered in our start-up phase. We will purchase examples of our products, as Current Assets, for customers to test-sit, but we will have very little inventory on hand.
| Start-up | |
| Requirements | |
| Start-up Expenses | |
| Legal | $1,000 |
| Stationery etc. | $250 |
| Brochures | $1,000 |
| Insurance | $500 |
| Expensed Equipment | $1,000 |
| Domain Name | $75 |
| Total Start-up Expenses | $3,825 |
| Start-up Assets | |
| Cash Required | $6,175 |
| Other Current Assets | $2,000 |
| Long-term Assets | $0 |
| Total Assets | $8,175 |
| Total Requirements | $12,000 |
| Start-up Funding | |
| Start-up Expenses to Fund | $3,825 |
| Start-up Assets to Fund | $8,175 |
| Total Funding Required | $12,000 |
| Assets | |
| Non-cash Assets from Start-up | $2,000 |
| Cash Requirements from Start-up | $6,175 |
| Additional Cash Raised | $0 |
| Cash Balance on Starting Date | $6,175 |
| Total Assets | $8,175 |
| Liabilities and Capital | |
| Liabilities | |
| Current Borrowing | $0 |
| Long-term Liabilities | $0 |
| Accounts Payable (Outstanding Bills) | $0 |
| Other Current Liabilities (interest-free) | $0 |
| Total Liabilities | $0 |
| Capital | |
| Planned Investment | |
| Jake and Lisa Wilson | $12,000 |
| Other | $0 |
| Additional Investment Requirement | $0 |
| Total Planned Investment | $12,000 |
| Loss at Start-up (Start-up Expenses) | ($3,825) |
| Total Capital | $8,175 |
| Total Capital and Liabilities | $8,175 |
| Total Funding | $12,000 |
Products
WorkChairs sells niche ergonomic products that are hard to find at standard office furniture or office supply stores. Our primary products include:
- Chairs – There is a large number of specialty chairs that are built to solve various physical problems caused by sitting in an office chair all day. These chairs aim to solve back, hip, leg, neck, shoulder, arm, and wrist problems.
- Workstations – Computer and regular workstations that are specially designed to be ergonomically correct.
- Computer Accessories – Special mice, keyboards, glare screens, keyboard trays, wrist rests, monitor supports, and other computer accessories.
- Document Holders – Copy holders to allow the head to stay looking up at eye level.
- Foot Rests – A proper foot rest complements an ergonomic chair for better posture alignment.
- Lighting – Various types of lighting to make things easier on the eyes while working.
- Back/Arm/Wrist Supports – Various supports for various reasons.
- Headsets/Microphones – For phone-related problems.
Market Analysis Summary
As computer and office jobs get more and more common, the general working population will experience more health problems caused by improper office working environments. It may be it’s their wrists aching from typing, their back hurting from their chair being bad, or their eyes damaged from staring at a computer screen. Ergonomic products focus on solving these problems. Unfortunately, these products are often hard to find at general furniture stores or office supply stores. WorkChairs aims to supply these products to both our local market and in the online space.
Specifically, we’ll target a few different types of worker:
- The home office user.
- The small business office manager.
- The large organization purchasing manager.
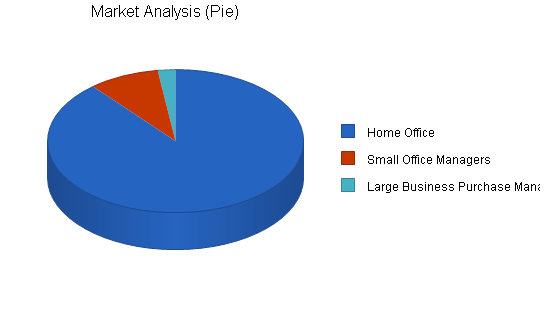
4.1 Market Segmentation
We have broken down our target market into the following categories:
- Home Office – This segment is the huge market of people running businesses from their home. We estimate there to be about 20,000,000 home office businesses in the United States, with about a 5% growth rate. Since we can reach the whole United States with our website, we can, potentially, reach the entire market.
- Small Office Managers – The small office market is also quite large, with a 5% growth rate. Most of these businesses have office workers who would be in need of ergonomic products.
- Large Office Purchase Managers – This market segment is much smaller in size, but has huge potential for sales as purchase managers usually make bulk buying decisions for multiple workers. It has a slower 2% growth rate due to fewer large businesses being created.

| Market Analysis | |||||||
| Year 1 | Year 2 | Year 3 | Year 4 | Year 5 | |||
| Potential Customers | Growth | CAGR | |||||
| Home Office | 5% | 20,000,000 | 21,000,000 | 22,050,000 | 23,152,500 | 24,310,125 | 5.00% |
| Small Office Managers | 5% | 2,000,000 | 2,100,000 | 2,205,000 | 2,315,250 | 2,431,013 | 5.00% |
| Large Business Purchase Managers | 2% | 500,000 | 510,000 | 520,200 | 530,604 | 541,216 | 2.00% |
| Total | 4.94% | 22,500,000 | 23,610,000 | 24,775,200 | 25,998,354 | 27,282,354 | 4.94% |
4.2 Target Market Segment Strategy
The following are our market segments along with our reasoning for targeting each segment:
- Home Office – This segment is very large, and because most home offices now involve people spending long hours on a computer, these people are prime targets for needing ergonomic equipment. Since these offices are also in their home, they’re more likely to spend some money on nicer furniture and equipment they can use for both home and work purposes.
- Small Business Managers – Most small businesses have a manager in charge of equipment purchasing decisions. At some point, most of these managers usually have an employee who suffers from a problem that can be solved with ergonomic equipment. Even if they haven’t, these people can usually be educated on the benefits of an ergonomically-sound workplace. They are usually pretty careful with their money though, as most small businesses try to keep their costs low. It’s a good market, especially locally, because these business often support other local small businesses.
- Large Business Purchase Managers – Large businesses usually have a purchase manager who’s sole job is making equipment and supply purchasers. It’s usually harder to reach these managers, and there are fewer large businesses, but they make for very lucrative accounts. Once you can build a good relationship with a purchase manager, they can be responsible for a lot of sales. Most purchasers buy equipment in bulk, and they usually have budgets that allow them to buy good equipment.
4.3 Industry Analysis
The ergonomic industry is growing by leaps and bounds. As the use of computers increases in offices, people are experiencing lots of health problems from repetitious use of computers all day long. The ailments can really vary, but knowledge of ergonomic products is growing as people realize these problems exist.
The ergonomic product manufacturing industry is also growing as more companies are putting out new products for cheaper prices.
WorkChairs aims to sell locally to small and large businesses, while also serving those two markets and the home office market on the Web. We believe this combination of local and nationwide sales will provide a solid base for a business.
4.3.1 Competition and Buying Patterns
People shopping for ergonomic products choose their retailer based on the following criteria:
Product selection: They want to work with a company that provides a number of ergonomic products to choose from, including competing brands.
Price: Nobody wants to pay more than they have to, and generally ergonomic products are more expensive than people anticipate, so price is usually a big issue.
Customer Service: People usually have questions before purchasing an ergonomic product because, for the most part, they have never seen or worked with the product before. This means that our website must explain things well and make it easy to contact us. We also must provide great customer service locally to keep our clients educated and happy.
Strategy and Implementation Summary
The primary strategies of WorkChairs are:
- Sell niche ergonomic products that are hard to find in normal sales channels and usually take some education to understand and use.
- Educate our customers and nurture relationships with them by providing superior customer service.
- Sell locally and online to maximize two different sales channels.
5.1 Competitive Edge
The primary competitive edge of WorkChairs is our product selection and how we educate our customers. We carry hard-to-find products that solve specific ergonomic needs. These are products you can’t find at local office furniture stores or superstores such as Office Depot, Staples, etc. These products are only carried by a few ergonomic specialty retailers both locally and online. In our local market, there are only a few small office supply stores that carry these products, and they aren’t very active in selling them or educating their customers about them.
We will have samples of a range of our products on hand for our local customers to test-sit. Part of the education process is give people the kinesthetic experience of using properly designed and sized chairs, workstations, etc. Purchases will be drop-shipped directly from the manufacturers to the customers, or to us, as our customers prefer.
Online, we hope to educate our customers better than anyone else and show why they need our products and how these will help solve their problems. There are lots of websites that carry ergonomic products, but most of them just list the products and don’t give much information about them.
5.2 Marketing Strategy
Our marketing strategy has two categories that both hit our three target markets:
Local Marketing Strategy – We intend to hit our three target markets locally “the old fashioned way.”
- Cold Calls – Jake Wilson will call on local businesses both small and large to educate them on our company and our ergonomic products.
- Yellow Pages – We will be listed in the local yellow pages under office products, office furniture, etc.
- Business Groups – Jake and Lisa Wilson will each be joining a number of local business groups in order to network and make contacts at local companies. We will use these contacts to get a foot in the door to build relationships with new customers.
Online Marketing Strategy – Our online marketing strategy will be run by Peter Wilson who is in charge of our website.
- Search Engines – We will pay to be listed in all the paid inclusion search engines and directories, as well as submitting to all the free search engines. Peter Wilson is an expert in this area, and will have our site optimized to do well in the engines.
- Pay-per-click Advertising – We will be spending a limited monthly budget on pay-per-click advertising on Overture and Google for targeted ergonomic keywords.
- Link-building Campaign – Our website will be more than just an online store. We will provide tons of information about ergonomics that will be educational for people trying to solve health problems. This will make our site an ergonomic resource worth linking to from other websites. We will have an ergonomic resources directory that will allow us to do link exchanges with other websites.
- Affiliate Program – We will have an affiliate program for other websites to sign up and earn a 10% commission on sales they refer to us.
- Word of Mouth – We will have features on our site to allow users to send pages from our site to their friends or co-workers.
5.3 Sales Strategy
Our sales strategy is broken down into two different areas:
- Local Sales – We will sell to local customers and employ a traditional local business sales strategy. Jake Wilson will be our primary salesman, and he’ll work in a normal fashion of calling on local businesses and informing them about our company and our products. Mr. Wilson will also join local business groups to network, and try to be the kind of salesman people refer to others. He does not earn a commission, as he will be working on salary as part owner. It’s possible that an additional local salesperson will be brought onto the team in the future.
- Online Sales – Obviously, selling online is different from selling locally. We’ll rely on our website to provide product information and answer the questions customers have about their products. Jake and Lisa Wilson will be available by phone and email to answer questions the site alone can’t answer. Otherwise, it’s a traditional e-commerce setup where the customer orders the product and WorkChairs either ships out the product themselves if it’s in inventory, or alerts the manufacturer who will drop ship the product.
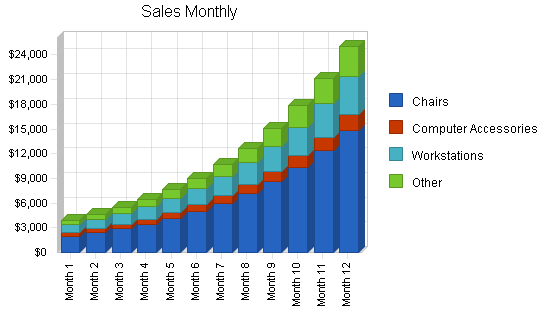
5.3.1 Sales Forecast
The Sales Forecast table outlines sales and cost projections for our four product groups. We expect to be able to sell products in the first month due to relationships we already have with customers who have agreed to purchase our products. As our name grows in the local community and as our website gets more links and better search placement online we feel our sales will continue to grow.
Each product category has a different growth rate for the first year based on our projections for how much growth there is in each area. We feel Chairs and Other will each see a 20% growth rate. We feel that the growth rate of Workstations and Computer Accessories will be slower at 15%.
After year one, we anticipate an overall growth rate of about 20%.

| Sales Forecast | |||
| Year 1 | Year 2 | Year 3 | |
| Sales | |||
| Chairs | $79,161 | $94,993 | $113,992 |
| Computer Accessories | $11,601 | $13,921 | $16,705 |
| Workstations | $29,002 | $34,802 | $41,762 |
| Other | $19,790 | $23,748 | $28,498 |
| Total Sales | $139,554 | $167,464 | $200,957 |
| Direct Cost of Sales | Year 1 | Year 2 | Year 3 |
| Chairs | $39,581 | $41,560 | $43,638 |
| Computer Accessories | $5,800 | $6,091 | $6,395 |
| Workstations | $14,501 | $15,226 | $15,987 |
| Other | $9,895 | $10,390 | $10,910 |
| Subtotal Direct Cost of Sales | $69,777 | $73,266 | $76,929 |
5.4 Milestones
The accompanying table is a list of our initial milestones for the launch of WorkChairs. It lists the actual milestone, date that we start working on the milestone, the date the milestone should be accomplished, the employee in charge, and the department. We are not rushed to get this business going, but we still feel it’s crucial to hit our milestones on time to get the business going before the slow summer season hits. We’d like to use the summer season to fine tune our website and make sure our relationships with our manufacturers are all solid and working well. We will use the Plan vs. Actual feature of Business Plan Pro® PREMIER to track our progress in getting everything done on time.

| Milestones | |||||
| Milestone | Start Date | End Date | Budget | Manager | Department |
| Corporation Formed | 1/4/2002 | 1/15/2002 | $1,000 | Jake | Executive |
| Product Selection Finalized | 1/1/2002 | 2/1/2002 | $0 | Jake and Lisa | Executive |
| Website | 1/1/2002 | 2/15/2002 | $75 | Peter | Web |
| Seach Engine Submissions | 2/15/2002 | 3/1/2002 | $500 | Peter | Web |
| Link Campaign | 3/1/2002 | 3/15/2002 | $0 | Peter | Web |
| Affiliate Program Launch | 4/1/2002 | 4/15/2002 | $0 | Peter | Web |
| Business Groups Joined | 4/1/2002 | 4/1/2002 | $0 | Jake and Lisa | Executive |
| Cold Calls Launch | 4/1/2002 | 4/1/2002 | $0 | Jake | Sales |
| Totals | $1,575 | ||||
Web Plan Summary
The WorkChairs’ website will be more than just a brochure for our local business, it will be a huge sales channel to the online world.
The focus of our site will be a combination of a store for our products and an ergonomic educational resource.
The store section of our site will be a very clean design that is similar to most e-commerce sites so users are familiar with the way things work. We’ll provide lots of information about our products and how they help solve people’s problems. We’ll also make it very clear to users how they can contact us for individual sales support and customer service. We think users might need some hand holding to choose the right product.
The ergonomic information section of our site will provide information about all the most common health problems caused by office working conditions. It will outline the health problems, the causes, and provide solutions in the form of positioning and posture, as well as links to products that can be purchased. We feel this section of our site will validate WorkChairs as experts in the field, and provide incentive for other websites to link to our website.
6.1 Website Marketing Strategy
Our overall online marketing strategy falls into the following strategies:
- Search Engines – We will be paying for listings in the paid inclusion engines as well as submitting to free engines like Google. Peter Wilson is an expert in this field and he will be designing our site from the start to have keywords built into the copy and give the site an overall search-engine friendly design.
- Pay-per-click Advertising – We’ll have a limited monthly budget for pay-per-click advertising on Google and Overture for selected targeted ergonomic keywords that fit our products. We will monitor our return on investment closely here to make sure we’re profitable with this advertising.
- Link-building Campaign – The educational aspect of our site along with our resources section will allow us to get links from other sites either through the quality of our content or in a link exchange manner. We will try to get links from good sites in ergonomics, furniture, office supplies, and other related areas.
- Affiliate Program – We will have an affiliate program that pays other websites 10% for sales that they refer to our website. This will get us more links, and provide incentive for other sites to market our products to their visitors.
- Word of Mouth – Our site will be set up so that’s it’s easy for visitors to send pages of our site to their friends and co-workers. We also hope their satisfaction with our products will lead them to tell others about us.
6.2 Development Requirements
The development of the WorkChairs website will start on January 1st of 2002. The estimated finish date of the website will be February 15, 2002. Peter Wilson will be developing all aspects of the website.
- Front End – The front end of the website is the graphic user design and interface that will be designed by Peter Wilson. The design will be simple with bland colors and feature a similar interface of popular e-commerce websites.
- Back End – The back end of our system is also being developed by Peter Wilson. It will feature a mySQL database and will use PHP as the programming language for the site logic. The e-commerce package is in PHP and is a combination of a base package and custom programming by Peter Wilson. The advantage of this setup is that we can customize it, it’s free, and it’s extremely fast. The product information will be stored in the database.
- Administration – It will be easy to add and edit content and product information on the website due to the administrative interface programmed by Peter Wilson. Both Jake and Lisa Wilson will be able to add/edit/delete products and content at any time.
- Future Development – As an employee of WorkChairs, Peter will be working part-time developing new features for the website and marketing it online.
Management Summary
WorkChairs is owned and managed by Jake and Lisa Wilson. The only other employee is our manager of the website, Peter Wilson. We don’t initially plan on hiring any additional employees, but there is a possibility of adding a local salesperson in the future.
- Jake Wilson – Jake has over 30 years experience in the office supply/furniture and ergonomics industry. He owned his own local store for 25 years and worked as President and the head of the sales division. Jake built up a huge knowledge of products, developed relationships with manufacturers, and made many valuable local contacts at businesses in the area which WorkChairs can use. Jake will work as the President of WorkChairs as well as being the primary local salesperson and expert on products.
- Lisa Wilson – Lisa also has over 30 years experience as she ran the local office store with her husband Jake. Lisa has more experience in the accounting and organizational aspects of the business, so she’ll be taking that role with WorkChairs.
- Peter Wilson – Peter grew up working in the office store, but has since left that industry and became a seasoned expert in Web development, online sales, and online marketing. Peter will be in charge of the website and it’s marketing for WorkChairs.
7.1 Personnel Plan
The accompanying Personnel Table explains the salaries of the three employees of WorkChairs. Jake and Lisa Wilson will not be taking salaries until the business has sales up and running in the middle of the year. Peter will be paid a modest salary for his part-time work from the start and will remain consistent at that level until 2003 when he will see a slight raise. Jake and Lisa Wilson will also see a raise in 2003 when the business has reached a high enough level of sales to make that possible.
| Personnel Plan | |||
| Year 1 | Year 2 | Year 3 | |
| Jake Wilson | $21,000 | $36,000 | $36,000 |
| Lisa Wilson | $21,000 | $36,000 | $36,000 |
| Peter Wilson | $12,000 | $12,000 | $20,000 |
| Total People | 3 | 3 | 3 |
| Total Payroll | $54,000 | $84,000 | $92,000 |
Financial Plan
The financial plan of WorkChairs is very simple and conservative. We aim to keep our expenses low while growing sales very slowly and under control. Because we don’t have any major expenditures to make, we don’t need to have huge amounts of cash on hand. We just need enough to pay our bills and our salary, and provide additional cushion to our account.
We expect to have a positive cash balance at all times.
We expect to be profitable in 2002 and 2004 while losing a little bit of money in 2003 as our payroll growth jumps up.
We expect our cash on hand to be stable and growing steadily by 2004.
8.1 Important Assumptions
We assume that interest rates and tax rates will stay the same as can be seen in our general assumptions table. We assume the economy will not become much worse than it is right now. At the current level of the economy we believe our goals and projections are attainable.
| General Assumptions | |||
| Year 1 | Year 2 | Year 3 | |
| Plan Month | 1 | 2 | 3 |
| Current Interest Rate | 10.00% | 10.00% | 10.00% |
| Long-term Interest Rate | 10.00% | 10.00% | 10.00% |
| Tax Rate | 30.00% | 30.00% | 30.00% |
| Other | 0 | 0 | 0 |
8.2 Break-even Analysis
Our Break-even Analysis is based on an average revenue per sale. This is an average because although we sell high-priced chairs that range from $200-$2,000, we also sell a larger number of cheaper products like copy holders, mice, wrist rests, keyboards, keyboard trays, monitor glare screens, and other products.
We aim to take a keystone mark-up on our products, i.e. 100%.
Our monthly fixed costs consist of three salaries and operating expenses.
The table and chart below calculate our break-even point in revenue per month.

| Break-even Analysis | |
| Monthly Revenue Break-even | $10,950 |
| Assumptions: | |
| Average Percent Variable Cost | 50% |
| Estimated Monthly Fixed Cost | $5,475 |
8.3 Projected Profit and Loss
The accompanying Profit and Loss table is a good example of how we will be keeping our expenses and payroll low while we grow sales. This will cause us to lose a little money in 2003, but we’ll be profitable from 2004 on. Our sales projections are very conservative, so we’re actually hoping that we’ll be profitable in 2003 as well, but we’re going with the conservative estimates shown in the table.
We aim to keep our gross margin up, and we think we can improve this over time as we gain more customers because we won’t have to battle on price with other retailers.


| Pro Forma Profit and Loss | |||
| Year 1 | Year 2 | Year 3 | |
| Sales | $139,554 | $167,464 | $200,957 |
| Direct Cost of Sales | $69,777 | $73,266 | $76,929 |
| Other Costs of Goods | $0 | $0 | $0 |
| Total Cost of Sales | $69,777 | $73,266 | $76,929 |
| Gross Margin | $69,777 | $94,198 | $124,028 |
| Gross Margin % | 50.00% | 56.25% | 61.72% |
| Expenses | |||
| Payroll | $54,000 | $84,000 | $92,000 |
| Sales and Marketing and Other Expenses | $1,200 | $1,200 | $1,200 |
| Depreciation | $0 | $0 | $0 |
| Rent | $0 | $0 | $0 |
| Utilities | $0 | $0 | $0 |
| Insurance | $1,200 | $1,200 | $1,200 |
| Payroll Taxes | $8,100 | $12,600 | $13,800 |
| Web Hosting | $1,200 | $1,200 | $1,200 |
| Total Operating Expenses | $65,700 | $100,200 | $109,400 |
| Profit Before Interest and Taxes | $4,077 | ($6,002) | $14,628 |
| EBITDA | $4,077 | ($6,002) | $14,628 |
| Interest Expense | $0 | $0 | $0 |
| Taxes Incurred | $1,223 | $0 | $4,388 |
| Net Profit | $2,854 | ($6,002) | $10,240 |
| Net Profit/Sales | 2.04% | -3.58% | 5.10% |
8.4 Projected Cash Flow
Our Projected Cash Flow table and chart show that we have little risk in this business as we’ll always keep a sizeable cash balance. We have a projected period of three months in the slow summer period were we’ll see a negative net cash flow, but our balance will stay positive so we’ll be able to pay our bills and stay in the positive.

| Pro Forma Cash Flow | |||
| Year 1 | Year 2 | Year 3 | |
| Cash Received | |||
| Cash from Operations | |||
| Cash Sales | $139,554 | $167,464 | $200,957 |
| Subtotal Cash from Operations | $139,554 | $167,464 | $200,957 |
| Additional Cash Received | |||
| Sales Tax, VAT, HST/GST Received | $0 | $0 | $0 |
| New Current Borrowing | $0 | $0 | $0 |
| New Other Liabilities (interest-free) | $0 | $0 | $0 |
| New Long-term Liabilities | $0 | $0 | $0 |
| Sales of Other Current Assets | $0 | $0 | $0 |
| Sales of Long-term Assets | $0 | $0 | $0 |
| New Investment Received | $0 | $0 | $0 |
| Subtotal Cash Received | $139,554 | $167,464 | $200,957 |
| Expenditures | Year 1 | Year 2 | Year 3 |
| Expenditures from Operations | |||
| Cash Spending | $54,000 | $84,000 | $92,000 |
| Bill Payments | $68,052 | $96,760 | $97,957 |
| Subtotal Spent on Operations | $122,052 | $180,760 | $189,957 |
| Additional Cash Spent | |||
| Sales Tax, VAT, HST/GST Paid Out | $0 | $0 | $0 |
| Principal Repayment of Current Borrowing | $0 | $0 | $0 |
| Other Liabilities Principal Repayment | $0 | $0 | $0 |
| Long-term Liabilities Principal Repayment | $0 | $0 | $0 |
| Purchase Other Current Assets | $0 | $0 | $0 |
| Purchase Long-term Assets | $0 | $0 | $0 |
| Dividends | $0 | $0 | $0 |
| Subtotal Cash Spent | $122,052 | $180,760 | $189,957 |
| Net Cash Flow | $17,501 | ($13,296) | $11,000 |
| Cash Balance | $23,676 | $10,380 | $21,381 |
8.5 Projected Balance Sheet
WorkChairs is not looking to grow at a super-fast pace, but we do project to grow our net-worth and cash slowly as time goes on. By 2004 we project to have a cushion of cash on hand while still paying our three employees decent salaries for their work.
| Pro Forma Balance Sheet | |||
| Year 1 | Year 2 | Year 3 | |
| Assets | |||
| Current Assets | |||
| Cash | $23,676 | $10,380 | $21,381 |
| Other Current Assets | $2,000 | $2,000 | $2,000 |
| Total Current Assets | $25,676 | $12,380 | $23,381 |
| Long-term Assets | |||
| Long-term Assets | $0 | $0 | $0 |
| Accumulated Depreciation | $0 | $0 | $0 |
| Total Long-term Assets | $0 | $0 | $0 |
| Total Assets | $25,676 | $12,380 | $23,381 |
| Liabilities and Capital | Year 1 | Year 2 | Year 3 |
| Current Liabilities | |||
| Accounts Payable | $14,647 | $7,353 | $8,114 |
| Current Borrowing | $0 | $0 | $0 |
| Other Current Liabilities | $0 | $0 | $0 |
| Subtotal Current Liabilities | $14,647 | $7,353 | $8,114 |
| Long-term Liabilities | $0 | $0 | $0 |
| Total Liabilities | $14,647 | $7,353 | $8,114 |
| Paid-in Capital | $12,000 | $12,000 | $12,000 |
| Retained Earnings | ($3,825) | ($971) | ($6,973) |
| Earnings | $2,854 | ($6,002) | $10,240 |
| Total Capital | $11,029 | $5,027 | $15,267 |
| Total Liabilities and Capital | $25,676 | $12,380 | $23,381 |
| Net Worth | $11,029 | $5,027 | $15,267 |
8.6 Business Ratios
The following table outlines some of the more important ratios from the Office Furniture industry. The final column, Industry Profile, details specific ratios based on the industry as it is classified by the Standard Industry Classification (SIC) code, 5712.9904. Our Gross Margin will increase from 2002-2004 as well are our profit ratio. Both will dip in 2003 as our expense ratio grows from a payroll increase.
| Ratio Analysis | ||||
| Year 1 | Year 2 | Year 3 | Industry Profile | |
| Sales Growth | 0.00% | 20.00% | 20.00% | 2.90% |
| Percent of Total Assets | ||||
| Other Current Assets | 7.79% | 16.15% | 8.55% | 22.82% |
| Total Current Assets | 100.00% | 100.00% | 100.00% | 85.19% |
| Long-term Assets | 0.00% | 0.00% | 0.00% | 14.81% |
| Total Assets | 100.00% | 100.00% | 100.00% | 100.00% |
| Current Liabilities | 57.05% | 59.40% | 34.70% | 39.96% |
| Long-term Liabilities | 0.00% | 0.00% | 0.00% | 11.39% |
| Total Liabilities | 57.05% | 59.40% | 34.70% | 51.35% |
| Net Worth | 42.95% | 40.60% | 65.30% | 48.65% |
| Percent of Sales | ||||
| Sales | 100.00% | 100.00% | 100.00% | 100.00% |
| Gross Margin | 50.00% | 56.25% | 61.72% | 33.55% |
| Selling, General & Administrative Expenses | 47.96% | 59.83% | 56.62% | 20.02% |
| Advertising Expenses | 0.00% | 0.00% | 0.00% | 2.63% |
| Profit Before Interest and Taxes | 2.92% | -3.58% | 7.28% | 0.94% |
| Main Ratios | ||||
| Current | 1.75 | 1.68 | 2.88 | 1.95 |
| Quick | 1.75 | 1.68 | 2.88 | 0.98 |
| Total Debt to Total Assets | 57.05% | 59.40% | 34.70% | 55.92% |
| Pre-tax Return on Net Worth | 36.97% | -119.39% | 95.82% | 2.53% |
| Pre-tax Return on Assets | 15.88% | -48.48% | 62.57% | 5.73% |
| Additional Ratios | Year 1 | Year 2 | Year 3 | |
| Net Profit Margin | 2.04% | -3.58% | 5.10% | n.a |
| Return on Equity | 25.88% | -119.39% | 67.07% | n.a |
| Activity Ratios | ||||
| Accounts Payable Turnover | 5.65 | 12.17 | 12.17 | n.a |
| Payment Days | 27 | 45 | 29 | n.a |
| Total Asset Turnover | 5.44 | 13.53 | 8.60 | n.a |
| Debt Ratios | ||||
| Debt to Net Worth | 1.33 | 1.46 | 0.53 | n.a |
| Current Liab. to Liab. | 1.00 | 1.00 | 1.00 | n.a |
| Liquidity Ratios | ||||
| Net Working Capital | $11,029 | $5,027 | $15,267 | n.a |
| Interest Coverage | 0.00 | 0.00 | 0.00 | n.a |
| Additional Ratios | ||||
| Assets to Sales | 0.18 | 0.07 | 0.12 | n.a |
| Current Debt/Total Assets | 57% | 59% | 35% | n.a |
| Acid Test | 1.75 | 1.68 | 2.88 | n.a |
| Sales/Net Worth | 12.65 | 33.31 | 13.16 | n.a |
| Dividend Payout | 0.00 | 0.00 | 0.00 | n.a |
Appendix
| Sales Forecast | |||||||||||||
| Month 1 | Month 2 | Month 3 | Month 4 | Month 5 | Month 6 | Month 7 | Month 8 | Month 9 | Month 10 | Month 11 | Month 12 | ||
| Sales | |||||||||||||
| Chairs | 0% | $2,000 | $2,400 | $2,880 | $3,456 | $4,147 | $4,977 | $5,972 | $7,166 | $8,600 | $10,320 | $12,383 | $14,860 |
| Computer Accessories | 0% | $400 | $460 | $529 | $608 | $700 | $805 | $925 | $1,064 | $1,224 | $1,407 | $1,618 | $1,861 |
| Workstations | 0% | $1,000 | $1,150 | $1,323 | $1,521 | $1,749 | $2,011 | $2,313 | $2,660 | $3,059 | $3,518 | $4,046 | $4,652 |
| Other | 0% | $500 | $600 | $720 | $864 | $1,037 | $1,244 | $1,493 | $1,792 | $2,150 | $2,580 | $3,096 | $3,715 |
| Total Sales | $3,900 | $4,610 | $5,452 | $6,449 | $7,633 | $9,037 | $10,703 | $12,682 | $15,032 | $17,824 | $21,143 | $25,089 | |
| Direct Cost of Sales | Month 1 | Month 2 | Month 3 | Month 4 | Month 5 | Month 6 | Month 7 | Month 8 | Month 9 | Month 10 | Month 11 | Month 12 | |
| Chairs | $1,000 | $1,200 | $1,440 | $1,728 | $2,074 | $2,488 | $2,986 | $3,583 | $4,300 | $5,160 | $6,192 | $7,430 | |
| Computer Accessories | $200 | $230 | $265 | $304 | $350 | $402 | $463 | $532 | $612 | $704 | $809 | $930 | |
| Workstations | $500 | $575 | $661 | $760 | $875 | $1,006 | $1,157 | $1,330 | $1,530 | $1,759 | $2,023 | $2,326 | |
| Other | $250 | $300 | $360 | $432 | $518 | $622 | $746 | $896 | $1,075 | $1,290 | $1,548 | $1,858 | |
| Subtotal Direct Cost of Sales | $1,950 | $2,305 | $2,726 | $3,225 | $3,816 | $4,518 | $5,352 | $6,341 | $7,516 | $8,912 | $10,572 | $12,544 | |
| Personnel Plan | |||||||||||||
| Month 1 | Month 2 | Month 3 | Month 4 | Month 5 | Month 6 | Month 7 | Month 8 | Month 9 | Month 10 | Month 11 | Month 12 | ||
| Jake Wilson | 0% | $0 | $0 | $0 | $0 | $0 | $3,000 | $3,000 | $3,000 | $3,000 | $3,000 | $3,000 | $3,000 |
| Lisa Wilson | 0% | $0 | $0 | $0 | $0 | $0 | $3,000 | $3,000 | $3,000 | $3,000 | $3,000 | $3,000 | $3,000 |
| Peter Wilson | 0% | $1,000 | $1,000 | $1,000 | $1,000 | $1,000 | $1,000 | $1,000 | $1,000 | $1,000 | $1,000 | $1,000 | $1,000 |
| Total People | 3 | 3 | 3 | 3 | 3 | 3 | 3 | 3 | 3 | 3 | 3 | 3 | |
| Total Payroll | $1,000 | $1,000 | $1,000 | $1,000 | $1,000 | $7,000 | $7,000 | $7,000 | $7,000 | $7,000 | $7,000 | $7,000 | |
| General Assumptions | |||||||||||||
| Month 1 | Month 2 | Month 3 | Month 4 | Month 5 | Month 6 | Month 7 | Month 8 | Month 9 | Month 10 | Month 11 | Month 12 | ||
| Plan Month | 1 | 2 | 3 | 4 | 5 | 6 | 7 | 8 | 9 | 10 | 11 | 12 | |
| Current Interest Rate | 10.00% | 10.00% | 10.00% | 10.00% | 10.00% | 10.00% | 10.00% | 10.00% | 10.00% | 10.00% | 10.00% | 10.00% | |
| Long-term Interest Rate | 10.00% | 10.00% | 10.00% | 10.00% | 10.00% | 10.00% | 10.00% | 10.00% | 10.00% | 10.00% | 10.00% | 10.00% | |
| Tax Rate | 30.00% | 30.00% | 30.00% | 30.00% | 30.00% | 30.00% | 30.00% | 30.00% | 30.00% | 30.00% | 30.00% | 30.00% | |
| Other | 0 | 0 | 0 | 0 | 0 | 0 | 0 | 0 | 0 | 0 | 0 | 0 | |
| Pro Forma Profit and Loss | |||||||||||||
| Month 1 | Month 2 | Month 3 | Month 4 | Month 5 | Month 6 | Month 7 | Month 8 | Month 9 | Month 10 | Month 11 | Month 12 | ||
| Sales | $3,900 | $4,610 | $5,452 | $6,449 | $7,633 | $9,037 | $10,703 | $12,682 | $15,032 | $17,824 | $21,143 | $25,089 | |
| Direct Cost of Sales | $1,950 | $2,305 | $2,726 | $3,225 | $3,816 | $4,518 | $5,352 | $6,341 | $7,516 | $8,912 | $10,572 | $12,544 | |
| Other Costs of Goods | $0 | $0 | $0 | $0 | $0 | $0 | $0 | $0 | $0 | $0 | $0 | $0 | |
| Total Cost of Sales | $1,950 | $2,305 | $2,726 | $3,225 | $3,816 | $4,518 | $5,352 | $6,341 | $7,516 | $8,912 | $10,572 | $12,544 | |
| Gross Margin | $1,950 | $2,305 | $2,726 | $3,225 | $3,816 | $4,518 | $5,352 | $6,341 | $7,516 | $8,912 | $10,572 | $12,544 | |
| Gross Margin % | 50.00% | 50.00% | 50.00% | 50.00% | 50.00% | 50.00% | 50.00% | 50.00% | 50.00% | 50.00% | 50.00% | 50.00% | |
| Expenses | |||||||||||||
| Payroll | $1,000 | $1,000 | $1,000 | $1,000 | $1,000 | $7,000 | $7,000 | $7,000 | $7,000 | $7,000 | $7,000 | $7,000 | |
| Sales and Marketing and Other Expenses | $100 | $100 | $100 | $100 | $100 | $100 | $100 | $100 | $100 | $100 | $100 | $100 | |
| Depreciation | $0 | $0 | $0 | $0 | $0 | $0 | $0 | $0 | $0 | $0 | $0 | $0 | |
| Rent | $0 | $0 | $0 | $0 | $0 | $0 | $0 | $0 | $0 | $0 | $0 | $0 | |
| Utilities | $0 | $0 | $0 | $0 | $0 | $0 | $0 | $0 | $0 | $0 | $0 | $0 | |
| Insurance | $100 | $100 | $100 | $100 | $100 | $100 | $100 | $100 | $100 | $100 | $100 | $100 | |
| Payroll Taxes | 15% | $150 | $150 | $150 | $150 | $150 | $1,050 | $1,050 | $1,050 | $1,050 | $1,050 | $1,050 | $1,050 |
| Web Hosting | $100 | $100 | $100 | $100 | $100 | $100 | $100 | $100 | $100 | $100 | $100 | $100 | |
| Total Operating Expenses | $1,450 | $1,450 | $1,450 | $1,450 | $1,450 | $8,350 | $8,350 | $8,350 | $8,350 | $8,350 | $8,350 | $8,350 | |
| Profit Before Interest and Taxes | $500 | $855 | $1,276 | $1,775 | $2,366 | ($3,832) | ($2,998) | ($2,009) | ($834) | $562 | $2,222 | $4,194 | |
| EBITDA | $500 | $855 | $1,276 | $1,775 | $2,366 | ($3,832) | ($2,998) | ($2,009) | ($834) | $562 | $2,222 | $4,194 | |
| Interest Expense | $0 | $0 | $0 | $0 | $0 | $0 | $0 | $0 | $0 | $0 | $0 | $0 | |
| Taxes Incurred | $150 | $257 | $383 | $532 | $710 | ($1,149) | ($900) | ($603) | ($250) | $169 | $666 | $1,258 | |
| Net Profit | $350 | $599 | $893 | $1,242 | $1,656 | ($2,682) | ($2,099) | ($1,406) | ($584) | $394 | $1,555 | $2,936 | |
| Net Profit/Sales | 8.97% | 12.98% | 16.38% | 19.26% | 21.70% | -29.68% | -19.61% | -11.09% | -3.88% | 2.21% | 7.36% | 11.70% | |
| Pro Forma Cash Flow | |||||||||||||
| Month 1 | Month 2 | Month 3 | Month 4 | Month 5 | Month 6 | Month 7 | Month 8 | Month 9 | Month 10 | Month 11 | Month 12 | ||
| Cash Received | |||||||||||||
| Cash from Operations | |||||||||||||
| Cash Sales | $3,900 | $4,610 | $5,452 | $6,449 | $7,633 | $9,037 | $10,703 | $12,682 | $15,032 | $17,824 | $21,143 | $25,089 | |
| Subtotal Cash from Operations | $3,900 | $4,610 | $5,452 | $6,449 | $7,633 | $9,037 | $10,703 | $12,682 | $15,032 | $17,824 | $21,143 | $25,089 | |
| Additional Cash Received | |||||||||||||
| Sales Tax, VAT, HST/GST Received | 0.00% | $0 | $0 | $0 | $0 | $0 | $0 | $0 | $0 | $0 | $0 | $0 | $0 |
| New Current Borrowing | $0 | $0 | $0 | $0 | $0 | $0 | $0 | $0 | $0 | $0 | $0 | $0 | |
| New Other Liabilities (interest-free) | $0 | $0 | $0 | $0 | $0 | $0 | $0 | $0 | $0 | $0 | $0 | $0 | |
| New Long-term Liabilities | $0 | $0 | $0 | $0 | $0 | $0 | $0 | $0 | $0 | $0 | $0 | $0 | |
| Sales of Other Current Assets | $0 | $0 | $0 | $0 | $0 | $0 | $0 | $0 | $0 | $0 | $0 | $0 | |
| Sales of Long-term Assets | $0 | $0 | $0 | $0 | $0 | $0 | $0 | $0 | $0 | $0 | $0 | $0 | |
| New Investment Received | $0 | $0 | $0 | $0 | $0 | $0 | $0 | $0 | $0 | $0 | $0 | $0 | |
| Subtotal Cash Received | $3,900 | $4,610 | $5,452 | $6,449 | $7,633 | $9,037 | $10,703 | $12,682 | $15,032 | $17,824 | $21,143 | $25,089 | |
| Expenditures | Month 1 | Month 2 | Month 3 | Month 4 | Month 5 | Month 6 | Month 7 | Month 8 | Month 9 | Month 10 | Month 11 | Month 12 | |
| Expenditures from Operations | |||||||||||||
| Cash Spending | $1,000 | $1,000 | $1,000 | $1,000 | $1,000 | $7,000 | $7,000 | $7,000 | $7,000 | $7,000 | $7,000 | $7,000 | |
| Bill Payments | $85 | $2,565 | $3,030 | $3,580 | $4,233 | $4,968 | $4,755 | $5,845 | $7,139 | $8,676 | $10,503 | $12,674 | |
| Subtotal Spent on Operations | $1,085 | $3,565 | $4,030 | $4,580 | $5,233 | $11,968 | $11,755 | $12,845 | $14,139 | $15,676 | $17,503 | $19,674 | |
| Additional Cash Spent | |||||||||||||
| Sales Tax, VAT, HST/GST Paid Out | $0 | $0 | $0 | $0 | $0 | $0 | $0 | $0 | $0 | $0 | $0 | $0 | |
| Principal Repayment of Current Borrowing | $0 | $0 | $0 | $0 | $0 | $0 | $0 | $0 | $0 | $0 | $0 | $0 | |
| Other Liabilities Principal Repayment | $0 | $0 | $0 | $0 | $0 | $0 | $0 | $0 | $0 | $0 | $0 | $0 | |
| Long-term Liabilities Principal Repayment | $0 | $0 | $0 | $0 | $0 | $0 | $0 | $0 | $0 | $0 | $0 | $0 | |
| Purchase Other Current Assets | $0 | $0 | $0 | $0 | $0 | $0 | $0 | $0 | $0 | $0 | $0 | $0 | |
| Purchase Long-term Assets | $0 | $0 | $0 | $0 | $0 | $0 | $0 | $0 | $0 | $0 | $0 | $0 | |
| Dividends | $0 | $0 | $0 | $0 | $0 | $0 | $0 | $0 | $0 | $0 | $0 | $0 | |
| Subtotal Cash Spent | $1,085 | $3,565 | $4,030 | $4,580 | $5,233 | $11,968 | $11,755 | $12,845 | $14,139 | $15,676 | $17,503 | $19,674 | |
| Net Cash Flow | $2,815 | $1,045 | $1,422 | $1,869 | $2,400 | ($2,931) | ($1,052) | ($163) | $893 | $2,148 | $3,640 | $5,415 | |
| Cash Balance | $8,990 | $10,035 | $11,456 | $13,326 | $15,725 | $12,795 | $11,743 | $11,580 | $12,473 | $14,621 | $18,261 | $23,676 | |
| Pro Forma Balance Sheet | |||||||||||||
| Month 1 | Month 2 | Month 3 | Month 4 | Month 5 | Month 6 | Month 7 | Month 8 | Month 9 | Month 10 | Month 11 | Month 12 | ||
| Assets | Starting Balances | ||||||||||||
| Current Assets | |||||||||||||
| Cash | $6,175 | $8,990 | $10,035 | $11,456 | $13,326 | $15,725 | $12,795 | $11,743 | $11,580 | $12,473 | $14,621 | $18,261 | $23,676 |
| Other Current Assets | $2,000 | $2,000 | $2,000 | $2,000 | $2,000 | $2,000 | $2,000 | $2,000 | $2,000 | $2,000 | $2,000 | $2,000 | $2,000 |
| Total Current Assets | $8,175 | $10,990 | $12,035 | $13,456 | $15,326 | $17,725 | $14,795 | $13,743 | $13,580 | $14,473 | $16,621 | $20,261 | $25,676 |
| Long-term Assets | |||||||||||||
| Long-term Assets | $0 | $0 | $0 | $0 | $0 | $0 | $0 | $0 | $0 | $0 | $0 | $0 | $0 |
| Accumulated Depreciation | $0 | $0 | $0 | $0 | $0 | $0 | $0 | $0 | $0 | $0 | $0 | $0 | $0 |
| Total Long-term Assets | $0 | $0 | $0 | $0 | $0 | $0 | $0 | $0 | $0 | $0 | $0 | $0 | $0 |
| Total Assets | $8,175 | $10,990 | $12,035 | $13,456 | $15,326 | $17,725 | $14,795 | $13,743 | $13,580 | $14,473 | $16,621 | $20,261 | $25,676 |
| Liabilities and Capital | Month 1 | Month 2 | Month 3 | Month 4 | Month 5 | Month 6 | Month 7 | Month 8 | Month 9 | Month 10 | Month 11 | Month 12 | |
| Current Liabilities | |||||||||||||
| Accounts Payable | $0 | $2,465 | $2,911 | $3,440 | $4,067 | $4,810 | $4,562 | $5,609 | $6,852 | $8,329 | $10,083 | $12,168 | $14,647 |
| Current Borrowing | $0 | $0 | $0 | $0 | $0 | $0 | $0 | $0 | $0 | $0 | $0 | $0 | $0 |
| Other Current Liabilities | $0 | $0 | $0 | $0 | $0 | $0 | $0 | $0 | $0 | $0 | $0 | $0 | $0 |
| Subtotal Current Liabilities | $0 | $2,465 | $2,911 | $3,440 | $4,067 | $4,810 | $4,562 | $5,609 | $6,852 | $8,329 | $10,083 | $12,168 | $14,647 |
| Long-term Liabilities | $0 | $0 | $0 | $0 | $0 | $0 | $0 | $0 | $0 | $0 | $0 | $0 | $0 |
| Total Liabilities | $0 | $2,465 | $2,911 | $3,440 | $4,067 | $4,810 | $4,562 | $5,609 | $6,852 | $8,329 | $10,083 | $12,168 | $14,647 |
| Paid-in Capital | $12,000 | $12,000 | $12,000 | $12,000 | $12,000 | $12,000 | $12,000 | $12,000 | $12,000 | $12,000 | $12,000 | $12,000 | $12,000 |
| Retained Earnings | ($3,825) | ($3,825) | ($3,825) | ($3,825) | ($3,825) | ($3,825) | ($3,825) | ($3,825) | ($3,825) | ($3,825) | ($3,825) | ($3,825) | ($3,825) |
| Earnings | $0 | $350 | $949 | $1,842 | $3,084 | $4,740 | $2,058 | ($41) | ($1,447) | ($2,031) | ($1,637) | ($82) | $2,854 |
| Total Capital | $8,175 | $8,525 | $9,124 | $10,017 | $11,259 | $12,915 | $10,233 | $8,134 | $6,728 | $6,144 | $6,538 | $8,093 | $11,029 |
| Total Liabilities and Capital | $8,175 | $10,990 | $12,035 | $13,456 | $15,326 | $17,725 | $14,795 | $13,743 | $13,580 | $14,473 | $16,621 | $20,261 | $25,676 |
| Net Worth | $8,175 | $8,525 | $9,124 | $10,017 | $11,259 | $12,915 | $10,233 | $8,134 | $6,728 | $6,144 | $6,538 | $8,093 | $11,029 |

