
Willamette Furniture
Executive Summary
Willamette Furniture Mfr. has been riding a growth spurt, having discovered the high-end direct mail channel that gave us a push to new potential volumes through channels. Bolstered by appearances in specialty catalogs, we were able to develop another additional channel through distributors of office equipment that sell directly to corporations.
This annual business plan calls for another three years of accelerated growth. Because our sales growth has brought some working capital implications, we are carefully planning to manage growth and provide for steady cash flow.
We also expect to be profitable as never before. In all, this plan is a healthy company with good growth prospects, looking to manage its orderly growth in the near future.
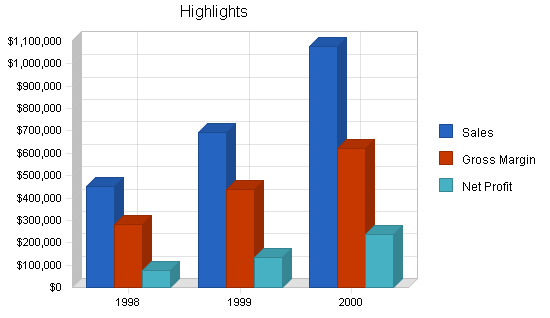
1.1 Objectives
- Focus on the new channels to increase sales beyond the $1 million mark by Year 3.
- Maintain a gross margin close to 60%, despite the sales increase.
- Increase the net profit significantly by Year 3.
1.2 Mission
Willamette Furniture Mfr. helps create pleasant, productive office environments with well-designed furniture that incorporates new technology into the classic office mode, in which real people can work happily. We are sensitive to the look and feel of good wood and fine furniture as well as to high-powered personal computing. We always provide the best possible value to our customers who care about quality office environments, and we want every dollar spent with us to be well spent. We also create and nurture a healthy, creative, respectful, and fun office and workshop environment, in which our employees are fairly compensated and encouraged to respect the customer and the quality of the product we produce. We seek fair and responsible profit, enough to keep the company financially healthy for the long term and to fairly compensate owners and investors for their money and risk.
1.3 Keys to Success
- Uncompromising commitment to the quality of the end product: quality wood, quality workmanship, quality design, quality of end result.
- Successful niche marketing: we need to find the quality-conscious customer in the right channels, and we need to make sure that customer can find us.
- Almost-automatic assembly: we can’t afford to ship fully-assembled desks, but assembly must be so easy and automatic that it makes the customer feel better about the quality, not worse.
Company Summary
Willamette Furniture Mfr. is a privately-owned specialty manufacturer of high-end office furniture for computer users who care about elegant office space. Our customers are in all levels of business that can afford very high quality office furniture, plus a growing portion of high-end home offices.
2.1 Company Ownership
Willamette Furniture Mfr. is an Oregon corporation, subchapter S, owned entirely by Jim and Susan Graham. It was created in 1992. At that time the product line and industrial property rights (including trademarks) were purchased from the heirs to the Willamette Association, which was a 1970s commune in rural Oregon.
2.2 Company History
Willamette Furniture Mfr. had actually existed since the 1970s as a “hippy commune,” but its present existence began in 1992 when the furniture line was purchased by Jim and Susan Graham. The Grahams moved to Oregon from California and purchased the business as part of the move.
Sales took a big jump in 1997, when we reached more effective channels of distribution. The key was winning a place in the Premier Executive office furniture catalog, which led to winning the interest of the Needham furniture distributors, and display space in several hundred stores.
Profitability and working capital were problems during our recent growth, but we believe we now have costs and cash flow under control.

| Past Performance | |||
| 1995 | 1996 | 1997 | |
| Sales | $127,809 | $130,568 | $225,790 |
| Gross Margin | $58,381 | $72,374 | $105,245 |
| Gross Margin % | 45.68% | 55.43% | 46.61% |
| Operating Expenses | $54,602 | $69,801 | $90,125 |
| Collection Period (days) | 0 | 0 | 36 |
| Inventory Turnover | 4.00 | 4.70 | 6.00 |
| Balance Sheet | |||
| 1995 | 1996 | 1997 | |
| Current Assets | |||
| Cash | $0 | $0 | $1,438 |
| Accounts Receivable | $0 | $0 | $27,605 |
| Inventory | $0 | $0 | $10,141 |
| Other Current Assets | $0 | $0 | $2,375 |
| Total Current Assets | $0 | $0 | $41,559 |
| Long-term Assets | |||
| Long-term Assets | $0 | $0 | $3,210 |
| Accumulated Depreciation | $0 | $0 | $1,720 |
| Total Long-term Assets | $0 | $0 | $1,490 |
| Total Assets | $0 | $0 | $43,049 |
| Current Liabilities | |||
| Accounts Payable | $0 | $0 | $11,191 |
| Current Borrowing | $0 | $0 | $0 |
| Other Current Liabilities (interest free) | $0 | $0 | $1,803 |
| Total Current Liabilities | $0 | $0 | $12,994 |
| Long-term Liabilities | $0 | $0 | $0 |
| Total Liabilities | $0 | $0 | $12,994 |
| Paid-in Capital | $0 | $0 | $4,500 |
| Retained Earnings | $0 | $0 | $13,100 |
| Earnings | $0 | $0 | $12,455 |
| Total Capital | $0 | $0 | $30,055 |
| Total Capital and Liabilities | $0 | $0 | $43,049 |
| Other Inputs | |||
| Payment Days | 0 | 0 | 35 |
| Sales on Credit | $0 | $0 | $140,434 |
| Receivables Turnover | 0.00 | 0.00 | 5.09 |
2.3 Company Locations and Facilities
Willamette Furniture Mfr. is located in a single facility in the West Eleventh industrial district in Eugene, OR. The facility includes office and workshop space, access to the local bus route, and good parking.
Products
Willamette Furniture Mfr. offers very high quality office furniture designed to effectively incorporate computer machinery into the executive office or home office. The key to the line is an ergonomically effective desk that still looks like an executive desk, looks very good in a high-end home office, but is intended to accommodate the personal computer.
3.1 Product Description
- Our main line is the Willamette computer desk in several versions. This is an elegant piece of office furniture designed to look good in executive office or home office, and at the same time be ideal for real use of the computer. The two critical elements of ergonomics — keyboard height and angle and monitor height and angle — are completely adjustable. Cable runs and shelving add to the utility of the executive computer, without sacrificing elegance.
- We also make complementary pieces to fill out the office suite, including file cabinets, printer stands, and bookcases.
- We also make custom designs to fit exact measurements.
3.2 Competitive Comparison
Within our niche we have two significant competitors, Acme Computer Furniture and ABC Manufacturing. Acme is a bigger company but like us, operating mainly in our same niche, whose marketing is better than its product quality. ABC is a subsidiary of Haines Furniture, a major furniture manufacturer, which has recently targeted our niche.
In general, however, our competition is not in our niche. We compete against generalized furniture manufacturers, cheaper computer-related furniture, and the mainstream merchandise in the major furniture channels and office supply stores. It isn’t that people choose our competitors instead of our product, it is that they choose lesser quality, mainstream materials instead of the higher quality furniture we offer.
3.3 Sales Literature
Sales literature is attached as an appendix to the plan.
For 1998 we plan to develop a company catalog, which would include some other products for the same target customers. The focus will be the executive office catalog, with furniture, lamps, other accessories.
3.4 Sourcing
Our Oregon location is a distinct advantage for local wood. We can buy higher quality oak and cherry than either of our competitors (one in California, one in New York). Since our sales increased over the last two years, we have been able to buy at better prices, because of higher volumes.
We work with three wood suppliers, all local. Bambridge supplies most of our oak, and a bit of cherry and some other specialty woods. Bambridge has been in business for as long as we have, and has given us good service and good prices. This is a good, stable supplier. Duffin Wood Products is a good second source, particularly for cherry and specialty woods. We’ve used Merlin supplies as well, frequently, for filling in when either of our main two suppliers were short.
We also work with a number of specialty manufacturers for furniture fittings, drawer accessories, glass, shelving accessories, and related purchases.
Although we aren’t a major player compared to the major furniture manufacturers, we are one of the biggest buyers of the custom materials we need. Most of our suppliers are selling through channels to hobbyists and carpenters, so they treat us as a major account.

3.5 Technology
We depend on our dominance of the latest in technology of ergonomics, combined with classic design elements of fine furniture. We must remain on top of new technologies in display, input and output, and communications. For example, our latest models are already assuming the desktop digital scanner as a frequent accessory, and audio for use in creating presentations, email attachments, etc.
Our assembly patents are an important competitive edge. No competitor can match the way we turn a drawback — having to assemble the product — into a feature. Our customer surveys confirm that customers take the interlocking assembly system as an enhancement to the sense of quality.
3.6 Future Products
In 1998 we will introduce the new line based on the executive laptop computer, with docking station to connect to a network. The new furniture has a different configuration to assume easy access to the docking station, and better use of the space that doesn’t have to be dedicated the the CPU case.
We are also going to accommodate larger monitors, the 17″ and 21″ sizes that are becoming much more common, particularly in our high-end market. As we do, we will also be watching for the new technology providing wall-mounted flat screens, the liquid plasma and similar technologies.
Market Analysis Summary
Our target market is a person who wants to have very fine furniture with the latest in technology, combined with an old fashioned sense of fine woods and fine woodworking. This person can be in the corporate towers, small or medium business, or in a home office. The common bond is the appreciation of quality, and the lack of price constraints.
4.1 Target Market Segment Strategy
Our segment definition is of itself strategic. We are not intending to satisfy all users of office furniture intended for use with personal computers, but, rather, only those who are most demanding. We are definitely out to address the needs of the high-end buyer, who is willing to pay more for quality.
In our particular market, we also seek the buyer who appreciates two attributes: the quality of furniture workmanship and the excellence of design, with an understanding of technology and ergonomics built in.
4.1.1 Market Needs
We understand that our target market needs more than just office furniture. The need grew out of the special needs of personal computing, when combined with office furniture — keyboards at correct height, monitors at correct height, proper channels for cables, and other amenities. Our target customer wants to have all of that plus fine furniture. There is a need for quality, reassurance of wood and good workmanship. We don’t just sell office furniture, we sell office environment and design, plus workmanship.
4.1.2 Market Trends
Our market has finally grown to recognize the disparity between most of the standard office furniture sold through channels, and our own products.
The development of the high-end office worker, office owners, and baby-boomer executive is an important trend for us. We now have people who are using computers who also appreciate the old-fashioned workmanship of good furniture.
4.1.3 Market Growth
According to [source omitted], the market for office furniture is growing at XX percent per year, and is projected to increase. The market for PC-related office furniture is growing even faster, at YY percent per year, and is projected to top $XX billion by the year 2000.
Most important is the growth in home offices with personal computer equipment. As the cost of the computer goes down, steadily, the number of home offices goes up. According to [omitted], this is about 36 million right now, growing at 15 percent per year. Households spent $XX billion last year to equip home offices, and 15 percent of that was spent on furniture.
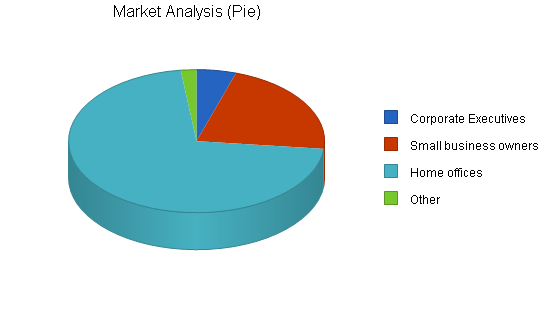
4.2 Market Segmentation
- Corporate executives: our market research indicates about 2.5 million potential customers who are managers in corporations of more than 100 employees. The target customer is going to be at a high executive level, in most cases, because the purchase price is relatively steep compared to standard office furniture.
- Small business owners: our customer surveys indicate a strong market among the owners of businesses with fewer than 100 employees. There are 11 million such businesses in this country, most of them with concentrated ownership that makes the owners potential customers.
- Home offices: the home office business has proliferated during the 1990s, and we also have home offices for people employed outside the home. This is a big market, some 36 million home offices, growing faster than other markets.
| Market Analysis | |||||||
| 1998 | 1999 | 2000 | 2001 | 2002 | |||
| Potential Customers | Growth | CAGR | |||||
| Corporate Executives | 1% | 2,500,000 | 2,525,000 | 2,550,250 | 2,575,753 | 2,601,511 | 1.00% |
| Small business owners | 4% | 11,000,000 | 11,440,000 | 11,897,600 | 12,373,504 | 12,868,444 | 4.00% |
| Home offices | 10% | 36,000,000 | 39,600,000 | 43,560,000 | 47,916,000 | 52,707,600 | 10.00% |
| Other | 3% | 1,000,000 | 1,030,000 | 1,060,900 | 1,092,727 | 1,125,509 | 3.00% |
| Total | 8.23% | 50,500,000 | 54,595,000 | 59,068,750 | 63,957,984 | 69,303,064 | 8.23% |
4.3 Industry Analysis
The office furniture industry has undergone a great deal of change in this decade. The growth of the office superstores made a few large brands dominant. They produce relatively inexpensive furniture that makes compromises in order to stay at the low price level.
Makers of higher quality furniture are in general shuffling for niches to hide in. Although Willamette Furniture Mfr. was essentially developed around a niche, many of the more traditional furniture makers are looking for niches, trying to deal with declining sales as the main volume goes elsewhere.
4.3.1 Industry Participants
The main volume in the industry is now concentrated in four main brands, all of which compete for retail sales through major retail chain stores: Office Depot, Office Max, Staples, and others. These same four are also concentrating efforts as well in the major club discount stores, the Price Club, Costco, Sams, etc.
The growth of the office superstores made a few large brands dominant. Designs are similar and quite competitive, costs and cost control is critical, and channel management and channel marketing are the keys to these business’ continued success.
In mainstream office furniture, the rise of the office store channel has siphoned a lot of volume from the older and more traditional manufacturers. The channels that sold the more traditional lines are also suffering. What’s left are smaller brands, smaller companies, and divisions of more traditional furniture companies.
There are also some traditional manufacturers still making desks as part of furniture lines focused mainly on home furnishings. Some of these have looked at times at our niche, and are competing for the same dollars.
4.3.2 Distribution Patterns
The four main manufacturers are selling direct to the office superstores and buying discount clubs. This accounts for the main volume of distribution. The office furniture customer seems to be growing steadily more comfortable with the retail buy in the chain store.
The major corporate purchases are still made directly with manufacturers. Although this is still a major channel for some of the more traditional manufacturers, it is essentially closed to new competition. The direct channel is dominated by two manufacturers and two distributors. The distributors will occasionally take on a new line — happily, this has helped Willamette Furniture Mfr. — but the main growth is in retail.
Published research indicates that 51% of the total sales volume in the market goes through the retail channel, most of that major national chains. Another 23% goes through the direct sales channel, although in this case direct sales includes sales by distributors who are buying from multiple manufacturers. Most of the remainder, 18%, is sold directly to buyers by catalogs.
4.3.3 Competition and Buying Patterns
In the mainstream business, channels are critical to volume. The manufacturers with impact in the national sales are going to win display space in the store, and most buyers seem content to pick their product off the store floor. Price is critical, because the channels take significant margins. Buyers are willing to settle for laminated quality and serviceable design.
In direct sales to corporations, price and volume is critical. The corporate buyer wants trouble-free buying in volume, at a great price. Reliable delivery is as important as reliable quality.
In the high-end specialty market, particularly in our niche, features are very important. Our target customer is not making selections based on price. The ergonomics, design, accommodation of the computer features within the high-quality feel of good wood, is much more important than mere price. We are also seeing that assembly is critical to shipping and packing, but our customer doesn’t accept any assembly problems. We need to make sure that the piece comes together almost like magic, and as it does, it presents a greater feel of quality than if it hadn’t required assembly at all.
4.3.4 Main Competitors
Acme Computer Furniture
Acme has been operating since the middle 1980s, and grew up with computer-related furniture. It was one of the first, certainly the first we are aware of, to develop personal computer desks and market through advertising in computer magazines. Today they are about twice our size. They have a very nicely done catalog and good relationships with two distributors.
Strengths: good marketing, strong advertising budget, relationships with distributors, strong direct sales.
Weaknesses: the product is more standardized, and of lesser quality, with less sense of design and materials and workmanship.
ABC Manufacturing
ABC Manufacturing is a division of Haines Furniture, the second largest manufacturers of mainstream home furnishings. Haines bought ABC three years ago and is focusing on our niche. We see very good quality product, and an excellent sense of design, but little movement in channels or catalogs.
Strengths: financial backing, product quality.
Weaknesses: ABC has not seemed to understand our niche, where to find the buyers, how to market as a specialty niche instead of the more traditional furniture channels.
Strategy and Implementation Summary
We focus on a special kind of customer, the person who wants very high quality office furniture customized to work beautifully with modern technology including personal computers, scanners, internet connections, and other high-tech items. Our customer might be in larger corporations, small or medium business, or in a home office with or without a home-office business. What is important to the customer is elegance, fine workmanship, ease of use, ergonomics, and practicality.
Our marketing strategy assumes that we need to go into specialty channels to address our target customer’s needs. The tie-in with the high-end quality catalogs like Sharper Image is perfect, because these catalogs cater to our kind of customers. We position as the highest quality, offering status and prestige levels of purchase.
The product strategy is also based on quality, in this case the intersection of technical understanding with very high quality woodworking and professional materials, and workmanship.
Our most important competitive edge is our assembly strategy, which is based on interlocking wood pieces of such high quality that assembly is not only a pleasure for our customers, it is actually a feature that enhances the sense of quality.
5.1 Strategy Pyramid
Our main strategy at Willamette Furniture Mfr. is to position ourselves at the top of the quality scale, featuring our combination of superb technology and fine old-fashioned woodworking, for the buyer who wants the best quality regardless of price. Tactics underneath that strategy include research and development related to new designs and new technology, choosing the right channels of distribution, and communicating our quality position to the market. Programs are mainly those listed in the milestones table, including new design programs, new equipment to keep up with design, channel development, channel marketing programs, our direct sales, and our continued presence in high-end catalog channels and new presence in the web.
5.2 Value Proposition
Willamette Furniture Mfr. gives the discriminating personal computer user, who cares about design and quality furniture and quality of working environment, a combination of highest quality furniture and latest technology, at a relatively high price.
5.3 Competitive Edge
Our competitive edge is our dominance of high-technology ergonomics and traditional high-quality furniture workmanship. Although there are many computer furniture manufacturers, and many computer lovers, few have brought the two crafts together as we have.
5.4 Marketing Strategy
Our product is positioned very carefully: this is high-quality office furniture combining workmanship and ergonomics for the customer who understands quality, is a user of high technology equipment, and is willing to spend money on the best. Unlike the mainstream products, we do not use laminates or cheap manufacturing technology.
Our marketing strategy is based mainly on making the right information available to the right target customer. We can’t afford to sell people on our expensive products, because most don’t have the budget. What we really do is make sure that those who have the budget and appreciate the product know that it exists, and know where to find it.
The marketing has to convey the sense of quality in every picture, every promotion, and every publication. We can’t afford to appear in second-rate catalogs with poor illustrations that make the product look less than it is. We also need to leverage our presence using high-quality catalogs and specialty distributors.
5.4.1 Pricing Strategy
We will maintain our pricing position as a premier provider. We are the best product available, for the most discriminating consumer. We intend to maintain our separation from the price competition at the lower end of the business. Our plan calls for no significant changes in pricing.
5.4.2 Promotion Strategy
Our most important vehicle for sales promotion is the direct mail catalog published by the specialty retailer such as Sharper Image and its competitors. Our advertising budget of $264 million goes mainly for space in the specialty catalog.
We also participate in major industry events, including both the Spring and Fall national computer furniture shows and the fall computer show. Our total budget for events is $40,000, plus about half of the $31,000 travel budget.
This year we will also promote our products with an in-house catalog including our own products plus related merchandise of interest to the same target market.
5.4.3 Distribution Strategy
Our most important marketing program is [specifics omitted]. Ivy Bells will be responsible, with budget of $XX,XXX and milestone date of the 15th of July. This program is intended to [objectives omitted]. Achievement should be measured by [specific concrete measurement].
Another key marketing program is [specifics omitted]. [Name] will be responsible, with budget of $XX,XXX and milestone date of [date]. This program is intended to [objectives omitted]. Achievement should be measured by [specific concrete measurement].
5.4.4 Positioning Statement
For discriminating personal computer users who want to integrate their PCs with fine furniture, the Willamette line offers exquisite workmanship and design combined with state-of-the-arts ergonomics and technology. Unlike the Acme line, Willamette Furniture makes no design compromises for standardization.
5.5 Sales Strategy
Our strategy focuses first on maintaining the identity with the high-end buyer who appreciates the best available quality, but is also very demanding regarding computer systems and technology. We’ve been able to find these customers using a combination of direct mail catalogs and direct sales to distributors.
For the next year we continue to focus on growing presence in the high-end direct mail catalog that finds our specialty customer. We will work with Sharper Image and Broadview more than ever, and we expect to gain position in the major airline catalogs as well. Specialty retail is a new channel that could become important for us.
Our work with distributors has been promising. We hope to continue the relationship with distributors selling directly to larger corporations, even though this takes working capital to support receivables.
5.5.1 Sales Programs
Specific sales programs:
- Catalog sales: develop placement with one additional catalog catering to the high-end office executive, paying of course for space and positioning. The budget is $10,000 for this program, due March 15, with Jan responsible.
- Distributor sales: we need to develop at least new distributor, spending for co-promotion as required, and making direct sales calls. The specific responsibility is Jan’s, and due date is May 15, with a budget of $15,000.
- Direct sales: we will do a mailing of a new in-house catalog, developed by the marketing department, to add to our direct telephone sales. Jan will be responsible, without a budget or a deadline because the catalog is a marketing program.
5.5.2 Sales Forecast
Our sales forecast assumes no change in costs or prices, which is a reasonable assumption for the last few years.
We are expecting to increase sales, growing from $225 thousand last year to $450 thousand in the next year, which is about doubling in size. The growth forecast is in line with our last year, and is relatively high for our industry because we are developing new channels. In 1999 and 2000 we expect growth closer to 50% per year, to a projected total of more than $1 million in 2000.
We are projecting significant change in the product line, or in the proportion between different lines. The key to our growth is the growth of the new channels, with the main desk.
Our seasonality, as shown in the chart, is still a factor in the business. We tend to sell much better in Spring and Fall, and sales drop in the summer.


| Sales Forecast | |||
| 1998 | 1999 | 2000 | |
| Unit Sales | |||
| Executive desk oak | 209 | 350 | 600 |
| Executive desk cherry | 31 | 30 | 30 |
| Other furniture oak | 45 | 50 | 50 |
| Other furniture cherry | 7 | 10 | 10 |
| Other | 6 | 10 | 10 |
| Total Unit Sales | 298 | 450 | 700 |
| Unit Prices | 1998 | 1999 | 2000 |
| Executive desk oak | $1,600.00 | $1,600.00 | $1,600.00 |
| Executive desk cherry | $1,750.00 | $1,750.00 | $1,600.00 |
| Other furniture oak | $900.00 | $900.00 | $900.00 |
| Other furniture cherry | $1,000.00 | $1,000.00 | $1,000.00 |
| Other | $2,500.00 | $2,500.00 | $1,600.00 |
| Sales | |||
| Executive desk oak | $334,400 | $560,000 | $960,000 |
| Executive desk cherry | $54,250 | $52,500 | $48,000 |
| Other furniture oak | $40,500 | $45,000 | $45,000 |
| Other furniture cherry | $7,000 | $10,000 | $10,000 |
| Other | $15,000 | $25,000 | $16,000 |
| Total Sales | $451,150 | $692,500 | $1,079,000 |
| Direct Unit Costs | 1998 | 1999 | 2000 |
| Executive desk oak | $400.00 | $400.00 | $400.00 |
| Executive desk cherry | $525.00 | $525.00 | $480.00 |
| Other furniture oak | $180.00 | $180.00 | $180.00 |
| Other furniture cherry | $300.00 | $300.00 | $300.00 |
| Other | $625.00 | $625.00 | $400.00 |
| Direct Cost of Sales | |||
| Executive desk oak | $83,600 | $140,000 | $240,000 |
| Executive desk cherry | $16,275 | $15,750 | $14,400 |
| Other furniture oak | $8,100 | $9,000 | $9,000 |
| Other furniture cherry | $2,100 | $3,000 | $3,000 |
| Other | $3,750 | $6,250 | $4,000 |
| Subtotal Direct Cost of Sales | $113,825 | $174,000 | $270,400 |
5.6 Milestones
The accompanying table shows specific milestones, with responsibilities assigned, dates, and (in most cases) budgets. We are focusing in this plan on a few key milestones that should be accomplished.
| Milestones | |||||
| Milestone | Start Date | End Date | Budget | Manager | Department |
| Spring trade show | 1/1/1998 | 5/15/1998 | $10,000 | Terry | PR |
| Spring trade show | 1/15/1998 | 5/15/1998 | $20,000 | Terry | Events |
| Spring trade show | 1/15/1998 | 5/15/1998 | $6,000 | Terry | Travel |
| Our in-house catalog plan | 1/31/1998 | 2/28/1998 | $0 | Terry | Other |
| First catalog | 3/1/1998 | 4/15/1998 | $125,000 | Jan | Ads |
| New distributor | 3/15/1998 | 3/30/1998 | $5,000 | Jan | Travel |
| New distributor | 3/15/1998 | 4/30/1998 | $3,000 | Jan | Sales |
| Second catalog | 4/1/1998 | 5/15/1998 | $85,000 | Jan | Ads |
| In-house catalog design | 4/1/1998 | 5/1/1998 | $2,000 | Terry | Other |
| In-house catalog mailing | 5/1/1998 | 6/1/1998 | $5,000 | Terry | Other |
| Third catalog placement | 5/15/1998 | 6/15/1998 | $54,000 | Jan | Ads |
| Fall trade show | 5/15/1998 | 10/15/1998 | $8,000 | Terry | PR |
| Fall trade show | 5/15/1998 | 10/15/1998 | $20,000 | Terry | Events |
| Fall trade show | 5/15/1998 | 10/15/1998 | $6,000 | Terry | Travel |
| Laptop product test | 6/15/1998 | 6/20/1998 | $1,000 | Jim | Other |
| Laptop product release | 1/1/1998 | 10/15/1998 | $15,000 | Terry | PR |
| Totals | $365,000 | ||||
Management Summary
We are a small company owned and operated by Jim and Susan Graham, husband and wife, as a Subchapter S corporation. Jim is the developer and designer of the products, and Susan manages the company as president.
Management style reflects the participation of the owners. The company respects its community of co-workers and treats all workers well. We attempt to develop and nurture the company as community. We are not very hierarchical.
6.1 Organizational Structure
Susan Graham, President, is responsible for overall business management. Our managers of finance, marketing, and sales report directly to Susan.
Jim Graham, designer, is responsible for product design and development, assembly, and manufacturing. Our workshop manager reports directly to Jim.
As co-owners, Jim and Susan jointly develop business strategy and long-term plans. Jim is strong on product know-how and technology, and Susan is strong on management and business know-how.
6.2 Management Team
Susan Graham, 43, president, had a successful career in retail before becoming half owner of Willamette Furniture Mfr. She was an area manager of Ross Stores, a buyer for Macy’s, and merchandising assistant for Sears and Roebuck. She has a degree in Literature from the University of Notre Dame.
Jim Graham, 44, workshop manager, designed furniture for Haines Manufacturing before becoming half owner of Willamette Furniture Mfr. He was responsible for one of the first executive desks designed to include customized fittings for personal computers, and was one of the first to design the monitor inside the desk under glass. He has an B.S. and M.S. in industrial design, from Stanford University and the University of Oregon, respectively.
Terry Hatcher, 34, is marketing manager. Terry joined Willamette Furniture Mfr. from the marketing department of the Thomasville Furniture chain, having been in charge of national catalog production and catalog advertising. Terry also managed direct sales at one of the furniture distributors that has since died to industry consolidation. Terry has a B.A. degree in literature from the University of Washington.
6.3 Management Team Gaps
We depend on our professionals, our CPA and our attorney, for some key management help. We don’t have a strong background in finance or business management.
As we grow we will need to develop more manufacturing technique, more mass production. Leslie grew up with the hand-made and custom furniture business, knows fine woodworking well, but admits a weakness in establishing standardized assembly.
6.4 Personnel Plan
The personnel table assumes slow growth in employees, and 10% per annum pay raises. We already have a strong benefits policy (with fully-paid medical, dental, and life insurance, plus a profit sharing and 401K plan) and very low turnover.
Salaries are generally in line with market pay for the Eugene area, although our benefits are above standard market level, so we ultimately pay a bit more for our people than what might be considered standard in our market. Eugene, however, is on average a lower wage location than most of the more developed industry areas.
As we grow, we expect to see steady increases in our personnel to match the increases in sales.
| Personnel Plan | |||
| 1998 | 1999 | 2000 | |
| Production Personnel | |||
| Workshop manager | $30,000 | $50,000 | $75,000 |
| Assembly | $21,600 | $30,000 | $60,000 |
| Name or Title or Group | $0 | $0 | $50,000 |
| Subtotal | $51,600 | $80,000 | $185,000 |
| Sales and Marketing Personnel | |||
| Marketing manager | $37,000 | $65,000 | $72,000 |
| Other | $0 | $0 | $0 |
| Subtotal | $37,000 | $65,000 | $72,000 |
| General and Administrative Personnel | |||
| President | $48,000 | $75,000 | $100,000 |
| Other | $0 | $0 | $0 |
| Subtotal | $48,000 | $75,000 | $100,000 |
| Other Personnel | |||
| Design | $3,000 | $15,000 | $25,000 |
| Other | $0 | $0 | $0 |
| Subtotal | $3,000 | $15,000 | $25,000 |
| Total People | 0 | 0 | 0 |
| Total Payroll | $139,600 | $235,000 | $382,000 |
Financial Plan
The financial picture is quite encouraging. We have been slow to take on debt, but with our increase in sales we do expect to apply for a credit line with the bank, to a limit of $150,000. The credit line is easily supported by assets.
We do expect to be able to take some money out as dividends. The owners don’t take overly generous salaries, so some draw is appropriate.
7.1 Important Assumptions
The accompanying table lists our main assumptions for developing our financial projections. The most sensitive assumption is the collection days. We would like to improve collection days to take pressure off of our working capital, but our increasing sales through channels makes the collection time a cost of doing business.
We also expect to see a decline in our inventory turnover ratio, another unfortunate side effect of increasing sales through channel. We find ourselves having to buy earlier and hold more finished goods in order to deal with sales through the channel.
| General Assumptions | |||
| 1998 | 1999 | 2000 | |
| Plan Month | 1 | 2 | 3 |
| Current Interest Rate | 10.00% | 10.00% | 10.00% |
| Long-term Interest Rate | 90.00% | 90.00% | 90.00% |
| Tax Rate | 25.42% | 25.00% | 25.00% |
| Other | 0 | 0 | 0 |
7.2 Key Financial Indicators
The following chart shows changes in key financial indicators: sales, gross margin, operating expenses, collection days, and inventory turnover. The growth in sales will be very hard to manage. We expect our gross margin to be a bit lower than before, because our projections show a slight decline as we go into new product areas and face new competition.
The projections for collection days and inventory turnover show that we are already expecting a decline in these indicators, because of increasing sales through channels.

7.3 Break-even Analysis
Our break-even analysis is based on running costs, the “burn-rate” costs we incur to keep the business running, not on theoretical fixed costs that would be relevant only if we were closing.
Our assumptions on average unit sales and average per-unit costs depend on averaging. We don’t really need to calculate an exact average, this is close enough to help us understand what a real break-even point might be.
The essential insight here is that our sales level seems to be running comfortably above break-even.

| Break-even Analysis | |
| Monthly Units Break-even | 13 |
| Monthly Revenue Break-even | $19,627 |
| Assumptions: | |
| Average Per-Unit Revenue | $1,513.93 |
| Average Per-Unit Variable Cost | $381.96 |
| Estimated Monthly Fixed Cost | $14,675 |
7.4 Projected Profit and Loss
We do expect a significant increase in profitability this year, and in the future, because we have learned how to deal with the increasing sales levels of selling through channels. Despite the lower profitability levels of recent years, we expect to see very strong net profits in 1998, and remain at that level through 2000. Our higher sales volume has lowered our cost of goods and increased our gross margin. This increase in gross margin is important to profitability.


| Pro Forma Profit and Loss | |||
| 1998 | 1999 | 2000 | |
| Sales | $451,150 | $692,500 | $1,079,000 |
| Direct Cost of Sales | $113,825 | $174,000 | $270,400 |
| Production Payroll | $51,600 | $80,000 | $185,000 |
| Other Costs of Sales | $3,110 | $0 | $0 |
| Total Cost of Sales | $168,535 | $254,000 | $455,400 |
| Gross Margin | $282,615 | $438,500 | $623,600 |
| Gross Margin % | 62.64% | 63.32% | 57.79% |
| Operating Expenses | |||
| Sales and Marketing Expenses | |||
| Sales and Marketing Payroll | $37,000 | $65,000 | $72,000 |
| Advertising/Promotion | $64,000 | $70,400 | $77,400 |
| Miscellaneous | $2,400 | $2,600 | $2,900 |
| Events | $6,250 | $6,900 | $7,600 |
| Public Relations | $750 | $800 | $900 |
| Travel | $4,500 | $5,000 | $5,500 |
| Total Sales and Marketing Expenses | $114,900 | $150,700 | $166,300 |
| Sales and Marketing % | 25.47% | 21.76% | 15.41% |
| General and Administrative Expenses | |||
| General and Administrative Payroll | $48,000 | $75,000 | $100,000 |
| Marketing/Promotion | $0 | $0 | $0 |
| Depreciation | $1,000 | $1,100 | $1,200 |
| Leased Equipment | $1,500 | $1,700 | $1,900 |
| Rent | $3,600 | $4,000 | $4,400 |
| Utilities | $2,400 | $2,600 | $2,900 |
| Insurance | $500 | $600 | $700 |
| Payroll Taxes | $0 | $0 | $0 |
| Other General and Administrative Expenses | $1,200 | $1,300 | $1,400 |
| Total General and Administrative Expenses | $58,200 | $86,300 | $112,500 |
| General and Administrative % | 12.90% | 12.46% | 10.43% |
| Other Expenses: | |||
| Other Payroll | $3,000 | $15,000 | $25,000 |
| Consultants | $0 | $0 | $0 |
| Other Expenses | $0 | $0 | $0 |
| Total Other Expenses | $3,000 | $15,000 | $25,000 |
| Other % | 0.66% | 2.17% | 2.32% |
| Total Operating Expenses | $176,100 | $252,000 | $303,800 |
| Profit Before Interest and Taxes | $106,515 | $186,500 | $319,800 |
| EBITDA | $107,515 | $187,600 | $321,000 |
| Interest Expense | $6,094 | $5,875 | $4,875 |
| Taxes Incurred | $25,009 | $45,156 | $78,731 |
| Net Profit | $75,412 | $135,469 | $236,194 |
| Net Profit/Sales | 16.72% | 19.56% | 21.89% |
7.5 Projected Cash Flow
Although we expect to be more profitable in 1998, we still have drains on the cash flow. We need to invest $25,000 in new assembly and manufacturing equipment, plus $15,000 in new computer equipment, and another $10,000 in miscellaneous short-term assets, including office equipment. Because of our increased sales through channels, and necessary increase in inventory levels, we need to increase working capital. We plan to extend our credit line to cover as much as $150,000 in short-term credit, backed by receivables and inventory.

| Pro Forma Cash Flow | |||
| 1998 | 1999 | 2000 | |
| Cash Received | |||
| Cash from Operations | |||
| Cash Sales | $112,788 | $173,125 | $269,750 |
| Cash from Receivables | $288,966 | $478,182 | $743,283 |
| Subtotal Cash from Operations | $401,754 | $651,307 | $1,013,033 |
| Additional Cash Received | |||
| Sales Tax, VAT, HST/GST Received | $0 | $0 | $0 |
| New Current Borrowing | $125,000 | $50,000 | $100,000 |
| New Other Liabilities (interest-free) | $0 | $0 | $0 |
| New Long-term Liabilities | $0 | $0 | $0 |
| Sales of Other Current Assets | $0 | $0 | $0 |
| Sales of Long-term Assets | $0 | $0 | $0 |
| New Investment Received | $50,000 | $0 | $0 |
| Subtotal Cash Received | $576,754 | $701,307 | $1,113,033 |
| Expenditures | 1998 | 1999 | 2000 |
| Expenditures from Operations | |||
| Cash Spending | $139,600 | $235,000 | $382,000 |
| Bill Payments | $231,587 | $317,081 | $458,115 |
| Subtotal Spent on Operations | $371,187 | $552,081 | $840,115 |
| Additional Cash Spent | |||
| Sales Tax, VAT, HST/GST Paid Out | $0 | $0 | $0 |
| Principal Repayment of Current Borrowing | $66,250 | $50,000 | $120,000 |
| Other Liabilities Principal Repayment | $0 | $0 | $0 |
| Long-term Liabilities Principal Repayment | $0 | $0 | $0 |
| Purchase Other Current Assets | $0 | $0 | $0 |
| Purchase Long-term Assets | $50,000 | $20,000 | $30,000 |
| Dividends | $0 | $0 | $0 |
| Subtotal Cash Spent | $487,437 | $622,081 | $990,115 |
| Net Cash Flow | $89,317 | $79,226 | $122,918 |
| Cash Balance | $90,755 | $169,981 | $292,899 |
7.6 Projected Balance Sheet
Our projected balance sheet shows an increase in net worth to more than $400 thousand in 2000, at which point we expect to be making compelling profits on sales of $1.1 million. With the present financial projections we will be careful in supporting our working capital credit line, and we are growing assets both because we want to — new equipment — and because we have to grow receivables and inventory to support growth in sales through channels.
| Pro Forma Balance Sheet | |||
| 1998 | 1999 | 2000 | |
| Assets | |||
| Current Assets | |||
| Cash | $90,755 | $169,981 | $292,899 |
| Accounts Receivable | $77,001 | $118,194 | $184,161 |
| Inventory | $12,070 | $18,451 | $28,673 |
| Other Current Assets | $2,375 | $2,375 | $2,375 |
| Total Current Assets | $182,201 | $309,001 | $508,109 |
| Long-term Assets | |||
| Long-term Assets | $53,210 | $73,210 | $103,210 |
| Accumulated Depreciation | $2,720 | $3,820 | $5,020 |
| Total Long-term Assets | $50,490 | $69,390 | $98,190 |
| Total Assets | $232,691 | $378,391 | $606,299 |
| Liabilities and Capital | 1998 | 1999 | 2000 |
| Current Liabilities | |||
| Accounts Payable | $16,671 | $26,902 | $38,616 |
| Current Borrowing | $58,750 | $58,750 | $38,750 |
| Other Current Liabilities | $1,803 | $1,803 | $1,803 |
| Subtotal Current Liabilities | $77,224 | $87,455 | $79,169 |
| Long-term Liabilities | $0 | $0 | $0 |
| Total Liabilities | $77,224 | $87,455 | $79,169 |
| Paid-in Capital | $54,500 | $54,500 | $54,500 |
| Retained Earnings | $25,555 | $100,967 | $236,436 |
| Earnings | $75,412 | $135,469 | $236,194 |
| Total Capital | $155,467 | $290,936 | $527,130 |
| Total Liabilities and Capital | $232,691 | $378,391 | $606,299 |
| Net Worth | $155,467 | $290,936 | $527,130 |
7.7 Business Ratios
Our ratios look healthy and solid. Gross margin is projected to decline slightly, return on assets will run well above industry standards, and return on equity is excellent. Debt and liquidity ratios also look good, with our Quick ratio increasing over the next three years. The standard comparisons are based on SIC code 2521, manufacturers of wood office furniture.
| Ratio Analysis | ||||
| 1998 | 1999 | 2000 | Industry Profile | |
| Sales Growth | 99.81% | 53.50% | 55.81% | 4.60% |
| Percent of Total Assets | ||||
| Accounts Receivable | 33.09% | 31.24% | 30.37% | 23.80% |
| Inventory | 5.19% | 4.88% | 4.73% | 32.10% |
| Other Current Assets | 1.02% | 0.63% | 0.39% | 19.00% |
| Total Current Assets | 78.30% | 81.66% | 83.81% | 74.90% |
| Long-term Assets | 21.70% | 18.34% | 16.19% | 25.10% |
| Total Assets | 100.00% | 100.00% | 100.00% | 100.00% |
| Current Liabilities | 33.19% | 23.11% | 13.06% | 38.40% |
| Long-term Liabilities | 0.00% | 0.00% | 0.00% | 15.90% |
| Total Liabilities | 33.19% | 23.11% | 13.06% | 54.30% |
| Net Worth | 66.81% | 76.89% | 86.94% | 45.70% |
| Percent of Sales | ||||
| Sales | 100.00% | 100.00% | 100.00% | 100.00% |
| Gross Margin | 62.64% | 63.32% | 57.79% | 32.40% |
| Selling, General & Administrative Expenses | 45.93% | 43.76% | 35.90% | 18.90% |
| Advertising Expenses | 14.19% | 10.17% | 7.17% | 1.40% |
| Profit Before Interest and Taxes | 23.61% | 26.93% | 29.64% | 1.80% |
| Main Ratios | ||||
| Current | 2.36 | 3.53 | 6.42 | 2.14 |
| Quick | 2.20 | 3.32 | 6.06 | 1.02 |
| Total Debt to Total Assets | 33.19% | 23.11% | 13.06% | 54.30% |
| Pre-tax Return on Net Worth | 64.59% | 62.08% | 59.74% | 5.10% |
| Pre-tax Return on Assets | 43.16% | 47.73% | 51.94% | 11.10% |
| Additional Ratios | 1998 | 1999 | 2000 | |
| Net Profit Margin | 16.72% | 19.56% | 21.89% | n.a |
| Return on Equity | 48.51% | 46.56% | 44.81% | n.a |
| Activity Ratios | ||||
| Accounts Receivable Turnover | 4.39 | 4.39 | 4.39 | n.a |
| Collection Days | 58 | 69 | 68 | n.a |
| Inventory Turnover | 12.00 | 11.40 | 11.48 | n.a |
| Accounts Payable Turnover | 14.22 | 12.17 | 12.17 | n.a |
| Payment Days | 28 | 24 | 25 | n.a |
| Total Asset Turnover | 1.94 | 1.83 | 1.78 | n.a |
| Debt Ratios | ||||
| Debt to Net Worth | 0.50 | 0.30 | 0.15 | n.a |
| Current Liab. to Liab. | 1.00 | 1.00 | 1.00 | n.a |
| Liquidity Ratios | ||||
| Net Working Capital | $104,977 | $221,546 | $428,940 | n.a |
| Interest Coverage | 17.48 | 31.74 | 65.60 | n.a |
| Additional Ratios | ||||
| Assets to Sales | 0.52 | 0.55 | 0.56 | n.a |
| Current Debt/Total Assets | 33% | 23% | 13% | n.a |
| Acid Test | 1.21 | 1.97 | 3.73 | n.a |
| Sales/Net Worth | 2.90 | 2.38 | 2.05 | n.a |
| Dividend Payout | 0.00 | 0.00 | 0.00 | n.a |
Appendix
| Sales Forecast | |||||||||||||
| Jan | Feb | Mar | Apr | May | Jun | Jul | Aug | Sep | Oct | Nov | Dec | ||
| Unit Sales | |||||||||||||
| Executive desk oak | 15% | 14 | 16 | 16 | 16 | 15 | 12 | 12 | 15 | 15 | 26 | 27 | 25 |
| Executive desk cherry | 5% | 2 | 3 | 3 | 3 | 2 | 2 | 2 | 2 | 3 | 4 | 3 | 2 |
| Other furniture oak | 5% | 3 | 4 | 4 | 4 | 3 | 3 | 3 | 4 | 4 | 4 | 5 | 4 |
| Other furniture cherry | 5% | 0 | 1 | 0 | 0 | 0 | 1 | 0 | 1 | 1 | 1 | 1 | 1 |
| Other | 20% | 1 | 0 | 0 | 1 | 1 | 0 | 1 | 0 | 0 | 1 | 1 | 0 |
| Total Unit Sales | 20 | 24 | 23 | 24 | 21 | 18 | 18 | 22 | 23 | 36 | 37 | 32 | |
| Unit Prices | Jan | Feb | Mar | Apr | May | Jun | Jul | Aug | Sep | Oct | Nov | Dec | |
| Executive desk oak | $1,600.00 | $1,600.00 | $1,600.00 | $1,600.00 | $1,600.00 | $1,600.00 | $1,600.00 | $1,600.00 | $1,600.00 | $1,600.00 | $1,600.00 | $1,600.00 | |
| Executive desk cherry | $1,750.00 | $1,750.00 | $1,750.00 | $1,750.00 | $1,750.00 | $1,750.00 | $1,750.00 | $1,750.00 | $1,750.00 | $1,750.00 | $1,750.00 | $1,750.00 | |
| Other furniture oak | $900.00 | $900.00 | $900.00 | $900.00 | $900.00 | $900.00 | $900.00 | $900.00 | $900.00 | $900.00 | $900.00 | $900.00 | |
| Other furniture cherry | $1,000.00 | $1,000.00 | $1,000.00 | $1,000.00 | $1,000.00 | $1,000.00 | $1,000.00 | $1,000.00 | $1,000.00 | $1,000.00 | $1,000.00 | $1,000.00 | |
| Other | $2,500.00 | $2,500.00 | $2,500.00 | $2,500.00 | $2,500.00 | $2,500.00 | $2,500.00 | $2,500.00 | $2,500.00 | $2,500.00 | $2,500.00 | $2,500.00 | |
| Sales | |||||||||||||
| Executive desk oak | $22,400 | $25,600 | $25,600 | $25,600 | $24,000 | $19,200 | $19,200 | $24,000 | $24,000 | $41,600 | $43,200 | $40,000 | |
| Executive desk cherry | $3,500 | $5,250 | $5,250 | $5,250 | $3,500 | $3,500 | $3,500 | $3,500 | $5,250 | $7,000 | $5,250 | $3,500 | |
| Other furniture oak | $2,700 | $3,600 | $3,600 | $3,600 | $2,700 | $2,700 | $2,700 | $3,600 | $3,600 | $3,600 | $4,500 | $3,600 | |
| Other furniture cherry | $0 | $1,000 | $0 | $0 | $0 | $1,000 | $0 | $1,000 | $1,000 | $1,000 | $1,000 | $1,000 | |
| Other | $2,500 | $0 | $0 | $2,500 | $2,500 | $0 | $2,500 | $0 | $0 | $2,500 | $2,500 | $0 | |
| Total Sales | $31,100 | $35,450 | $34,450 | $36,950 | $32,700 | $26,400 | $27,900 | $32,100 | $33,850 | $55,700 | $56,450 | $48,100 | |
| Direct Unit Costs | Jan | Feb | Mar | Apr | May | Jun | Jul | Aug | Sep | Oct | Nov | Dec | |
| Executive desk oak | 25.00% | $400.00 | $400.00 | $400.00 | $400.00 | $400.00 | $400.00 | $400.00 | $400.00 | $400.00 | $400.00 | $400.00 | $400.00 |
| Executive desk cherry | 30.00% | $525.00 | $525.00 | $525.00 | $525.00 | $525.00 | $525.00 | $525.00 | $525.00 | $525.00 | $525.00 | $525.00 | $525.00 |
| Other furniture oak | 20.00% | $180.00 | $180.00 | $180.00 | $180.00 | $180.00 | $180.00 | $180.00 | $180.00 | $180.00 | $180.00 | $180.00 | $180.00 |
| Other furniture cherry | 30.00% | $300.00 | $300.00 | $300.00 | $300.00 | $300.00 | $300.00 | $300.00 | $300.00 | $300.00 | $300.00 | $300.00 | $300.00 |
| Other | 25.00% | $625.00 | $625.00 | $625.00 | $625.00 | $625.00 | $625.00 | $625.00 | $625.00 | $625.00 | $625.00 | $625.00 | $625.00 |
| Direct Cost of Sales | |||||||||||||
| Executive desk oak | $5,600 | $6,400 | $6,400 | $6,400 | $6,000 | $4,800 | $4,800 | $6,000 | $6,000 | $10,400 | $10,800 | $10,000 | |
| Executive desk cherry | $1,050 | $1,575 | $1,575 | $1,575 | $1,050 | $1,050 | $1,050 | $1,050 | $1,575 | $2,100 | $1,575 | $1,050 | |
| Other furniture oak | $540 | $720 | $720 | $720 | $540 | $540 | $540 | $720 | $720 | $720 | $900 | $720 | |
| Other furniture cherry | $0 | $300 | $0 | $0 | $0 | $300 | $0 | $300 | $300 | $300 | $300 | $300 | |
| Other | $625 | $0 | $0 | $625 | $625 | $0 | $625 | $0 | $0 | $625 | $625 | $0 | |
| Subtotal Direct Cost of Sales | $7,815 | $8,995 | $8,695 | $9,320 | $8,215 | $6,690 | $7,015 | $8,070 | $8,595 | $14,145 | $14,200 | $12,070 | |
| Personnel Plan | |||||||||||||
| Jan | Feb | Mar | Apr | May | Jun | Jul | Aug | Sep | Oct | Nov | Dec | ||
| Production Personnel | |||||||||||||
| Workshop manager | $2,500 | $2,500 | $2,500 | $2,500 | $2,500 | $2,500 | $2,500 | $2,500 | $2,500 | $2,500 | $2,500 | $2,500 | |
| Assembly | $1,800 | $1,800 | $1,800 | $1,800 | $1,800 | $1,800 | $1,800 | $1,800 | $1,800 | $1,800 | $1,800 | $1,800 | |
| Name or Title or Group | $0 | $0 | $0 | $0 | $0 | $0 | $0 | $0 | $0 | $0 | $0 | $0 | |
| Subtotal | $4,300 | $4,300 | $4,300 | $4,300 | $4,300 | $4,300 | $4,300 | $4,300 | $4,300 | $4,300 | $4,300 | $4,300 | |
| Sales and Marketing Personnel | |||||||||||||
| Marketing manager | $4,000 | $3,000 | $3,000 | $3,000 | $3,000 | $3,000 | $3,000 | $3,000 | $3,000 | $3,000 | $3,000 | $3,000 | |
| Other | $0 | $0 | $0 | $0 | $0 | $0 | $0 | $0 | $0 | $0 | $0 | $0 | |
| Subtotal | $4,000 | $3,000 | $3,000 | $3,000 | $3,000 | $3,000 | $3,000 | $3,000 | $3,000 | $3,000 | $3,000 | $3,000 | |
| General and Administrative Personnel | |||||||||||||
| President | $4,000 | $4,000 | $4,000 | $4,000 | $4,000 | $4,000 | $4,000 | $4,000 | $4,000 | $4,000 | $4,000 | $4,000 | |
| Other | $0 | $0 | $0 | $0 | $0 | $0 | $0 | $0 | $0 | $0 | $0 | $0 | |
| Subtotal | $4,000 | $4,000 | $4,000 | $4,000 | $4,000 | $4,000 | $4,000 | $4,000 | $4,000 | $4,000 | $4,000 | $4,000 | |
| Other Personnel | |||||||||||||
| Design | $250 | $250 | $250 | $250 | $250 | $250 | $250 | $250 | $250 | $250 | $250 | $250 | |
| Other | $0 | $0 | $0 | $0 | $0 | $0 | $0 | $0 | $0 | $0 | $0 | $0 | |
| Subtotal | $250 | $250 | $250 | $250 | $250 | $250 | $250 | $250 | $250 | $250 | $250 | $250 | |
| Total People | 0 | 0 | 0 | 0 | 0 | 0 | 0 | 0 | 0 | 0 | 0 | 0 | |
| Total Payroll | $12,550 | $11,550 | $11,550 | $11,550 | $11,550 | $11,550 | $11,550 | $11,550 | $11,550 | $11,550 | $11,550 | $11,550 | |
| Pro Forma Profit and Loss | |||||||||||||
| Jan | Feb | Mar | Apr | May | Jun | Jul | Aug | Sep | Oct | Nov | Dec | ||
| Sales | $31,100 | $35,450 | $34,450 | $36,950 | $32,700 | $26,400 | $27,900 | $32,100 | $33,850 | $55,700 | $56,450 | $48,100 | |
| Direct Cost of Sales | $7,815 | $8,995 | $8,695 | $9,320 | $8,215 | $6,690 | $7,015 | $8,070 | $8,595 | $14,145 | $14,200 | $12,070 | |
| Production Payroll | $4,300 | $4,300 | $4,300 | $4,300 | $4,300 | $4,300 | $4,300 | $4,300 | $4,300 | $4,300 | $4,300 | $4,300 | |
| Other Costs of Sales | $3,110 | $0 | $0 | $0 | $0 | $0 | $0 | $0 | $0 | $0 | $0 | $0 | |
| Total Cost of Sales | $15,225 | $13,295 | $12,995 | $13,620 | $12,515 | $10,990 | $11,315 | $12,370 | $12,895 | $18,445 | $18,500 | $16,370 | |
| Gross Margin | $15,875 | $22,155 | $21,455 | $23,330 | $20,185 | $15,410 | $16,585 | $19,730 | $20,955 | $37,255 | $37,950 | $31,730 | |
| Gross Margin % | 51.05% | 62.50% | 62.28% | 63.14% | 61.73% | 58.37% | 59.44% | 61.46% | 61.91% | 66.89% | 67.23% | 65.97% | |
| Operating Expenses | |||||||||||||
| Sales and Marketing Expenses | |||||||||||||
| Sales and Marketing Payroll | $4,000 | $3,000 | $3,000 | $3,000 | $3,000 | $3,000 | $3,000 | $3,000 | $3,000 | $3,000 | $3,000 | $3,000 | |
| Advertising/Promotion | $8,000 | $8,000 | $0 | $8,000 | $8,000 | $0 | $8,000 | $8,000 | $0 | $8,000 | $8,000 | $0 | |
| Miscellaneous | $200 | $200 | $200 | $200 | $200 | $200 | $200 | $200 | $200 | $200 | $200 | $200 | |
| Events | $0 | $750 | $0 | $0 | $3,000 | $0 | $0 | $0 | $0 | $2,500 | $0 | $0 | |
| Public Relations | $0 | $250 | $0 | $0 | $500 | $0 | $0 | $0 | $0 | $0 | $0 | $0 | |
| Travel | $0 | $500 | $0 | $0 | $2,000 | $0 | $500 | $0 | $0 | $0 | $1,500 | $0 | |
| Total Sales and Marketing Expenses | $12,200 | $12,700 | $3,200 | $11,200 | $16,700 | $3,200 | $11,700 | $11,200 | $3,200 | $13,700 | $12,700 | $3,200 | |
| Sales and Marketing % | 39.23% | 35.83% | 9.29% | 30.31% | 51.07% | 12.12% | 41.94% | 34.89% | 9.45% | 24.60% | 22.50% | 6.65% | |
| General and Administrative Expenses | |||||||||||||
| General and Administrative Payroll | $4,000 | $4,000 | $4,000 | $4,000 | $4,000 | $4,000 | $4,000 | $4,000 | $4,000 | $4,000 | $4,000 | $4,000 | |
| Marketing/Promotion | $0 | $0 | $0 | $0 | $0 | $0 | $0 | $0 | $0 | $0 | $0 | $0 | |
| Depreciation | $0 | $0 | $0 | $0 | $0 | $0 | $0 | $0 | $0 | $0 | $0 | $1,000 | |
| Leased Equipment | $125 | $125 | $125 | $125 | $125 | $125 | $125 | $125 | $125 | $125 | $125 | $125 | |
| Rent | $300 | $300 | $300 | $300 | $300 | $300 | $300 | $300 | $300 | $300 | $300 | $300 | |
| Utilities | $200 | $200 | $200 | $200 | $200 | $200 | $200 | $200 | $200 | $200 | $200 | $200 | |
| Insurance | $0 | $0 | $0 | $0 | $0 | $0 | $0 | $0 | $0 | $0 | $0 | $500 | |
| Payroll Taxes | 15% | $0 | $0 | $0 | $0 | $0 | $0 | $0 | $0 | $0 | $0 | $0 | $0 |
| Other General and Administrative Expenses | $100 | $100 | $100 | $100 | $100 | $100 | $100 | $100 | $100 | $100 | $100 | $100 | |
| Total General and Administrative Expenses | $4,725 | $4,725 | $4,725 | $4,725 | $4,725 | $4,725 | $4,725 | $4,725 | $4,725 | $4,725 | $4,725 | $6,225 | |
| General and Administrative % | 15.19% | 13.33% | 13.72% | 12.79% | 14.45% | 17.90% | 16.94% | 14.72% | 13.96% | 8.48% | 8.37% | 12.94% | |
| Other Expenses: | |||||||||||||
| Other Payroll | $250 | $250 | $250 | $250 | $250 | $250 | $250 | $250 | $250 | $250 | $250 | $250 | |
| Consultants | $0 | $0 | $0 | $0 | $0 | $0 | $0 | $0 | $0 | $0 | $0 | $0 | |
| Other Expenses | $0 | $0 | $0 | $0 | $0 | $0 | $0 | $0 | $0 | $0 | $0 | $0 | |
| Total Other Expenses | $250 | $250 | $250 | $250 | $250 | $250 | $250 | $250 | $250 | $250 | $250 | $250 | |
| Other % | 0.80% | 0.71% | 0.73% | 0.68% | 0.76% | 0.95% | 0.90% | 0.78% | 0.74% | 0.45% | 0.44% | 0.52% | |
| Total Operating Expenses | $17,175 | $17,675 | $8,175 | $16,175 | $21,675 | $8,175 | $16,675 | $16,175 | $8,175 | $18,675 | $17,675 | $9,675 | |
| Profit Before Interest and Taxes | ($1,300) | $4,480 | $13,280 | $7,155 | ($1,490) | $7,235 | ($90) | $3,555 | $12,780 | $18,580 | $20,275 | $22,055 | |
| EBITDA | ($1,300) | $4,480 | $13,280 | $7,155 | ($1,490) | $7,235 | ($90) | $3,555 | $12,780 | $18,580 | $20,275 | $23,055 | |
| Interest Expense | $625 | $615 | $563 | $552 | $510 | $469 | $417 | $406 | $396 | $510 | $542 | $490 | |
| Taxes Incurred | ($578) | $966 | $3,179 | $1,651 | ($500) | $1,692 | ($127) | $787 | $3,096 | $4,517 | $4,933 | $5,391 | |
| Net Profit | ($1,348) | $2,899 | $9,538 | $4,952 | ($1,500) | $5,075 | ($380) | $2,362 | $9,288 | $13,552 | $14,800 | $16,174 | |
| Net Profit/Sales | -4.33% | 8.18% | 27.69% | 13.40% | -4.59% | 19.22% | -1.36% | 7.36% | 27.44% | 24.33% | 26.22% | 33.63% | |
| Pro Forma Cash Flow | |||||||||||||
| Jan | Feb | Mar | Apr | May | Jun | Jul | Aug | Sep | Oct | Nov | Dec | ||
| Cash Received | |||||||||||||
| Cash from Operations | |||||||||||||
| Cash Sales | $7,775 | $8,863 | $8,613 | $9,238 | $8,175 | $6,600 | $6,975 | $8,025 | $8,463 | $13,925 | $14,113 | $12,025 | |
| Cash from Receivables | $13,803 | $14,580 | $23,434 | $26,563 | $25,900 | $27,606 | $24,368 | $19,838 | $21,030 | $24,119 | $25,934 | $41,794 | |
| Subtotal Cash from Operations | $21,578 | $23,443 | $32,046 | $35,800 | $34,075 | $34,206 | $31,343 | $27,863 | $29,493 | $38,044 | $40,046 | $53,819 | |
| Additional Cash Received | |||||||||||||
| Sales Tax, VAT, HST/GST Received | 0.00% | $0 | $0 | $0 | $0 | $0 | $0 | $0 | $0 | $0 | $0 | $0 | $0 |
| New Current Borrowing | $75,000 | $5,000 | $0 | $5,000 | $0 | $0 | $0 | $5,000 | $5,000 | $20,000 | $10,000 | $0 | |
| New Other Liabilities (interest-free) | $0 | $0 | $0 | $0 | $0 | $0 | $0 | $0 | $0 | $0 | $0 | $0 | |
| New Long-term Liabilities | $0 | $0 | $0 | $0 | $0 | $0 | $0 | $0 | $0 | $0 | $0 | $0 | |
| Sales of Other Current Assets | $0 | $0 | $0 | $0 | $0 | $0 | $0 | $0 | $0 | $0 | $0 | $0 | |
| Sales of Long-term Assets | $0 | $0 | $0 | $0 | $0 | $0 | $0 | $0 | $0 | $0 | $0 | $0 | |
| New Investment Received | $0 | $25,000 | $0 | $0 | $0 | $0 | $0 | $0 | $25,000 | $0 | $0 | $0 | |
| Subtotal Cash Received | $96,578 | $53,443 | $32,046 | $40,800 | $34,075 | $34,206 | $31,343 | $32,863 | $59,493 | $58,044 | $50,046 | $53,819 | |
| Expenditures | Jan | Feb | Mar | Apr | May | Jun | Jul | Aug | Sep | Oct | Nov | Dec | |
| Expenditures from Operations | |||||||||||||
| Cash Spending | $12,550 | $11,550 | $11,550 | $11,550 | $11,550 | $11,550 | $11,550 | $11,550 | $11,550 | $11,550 | $11,550 | $11,550 | |
| Bill Payments | $11,777 | $17,725 | $21,877 | $13,329 | $21,089 | $21,102 | $8,544 | $17,128 | $19,053 | $14,291 | $35,948 | $29,725 | |
| Subtotal Spent on Operations | $24,327 | $29,275 | $33,427 | $24,879 | $32,639 | $32,652 | $20,094 | $28,678 | $30,603 | $25,841 | $47,498 | $41,275 | |
| Additional Cash Spent | |||||||||||||
| Sales Tax, VAT, HST/GST Paid Out | $0 | $0 | $0 | $0 | $0 | $0 | $0 | $0 | $0 | $0 | $0 | $0 | |
| Principal Repayment of Current Borrowing | $0 | $6,250 | $6,250 | $6,250 | $5,000 | $5,000 | $6,250 | $6,250 | $6,250 | $6,250 | $6,250 | $6,250 | |
| Other Liabilities Principal Repayment | $0 | $0 | $0 | $0 | $0 | $0 | $0 | $0 | $0 | $0 | $0 | $0 | |
| Long-term Liabilities Principal Repayment | $0 | $0 | $0 | $0 | $0 | $0 | $0 | $0 | $0 | $0 | $0 | $0 | |
| Purchase Other Current Assets | $0 | $0 | $0 | $0 | $0 | $0 | $0 | $0 | $0 | $0 | $0 | $0 | |
| Purchase Long-term Assets | $0 | $25,000 | $0 | $0 | $0 | $0 | $0 | $0 | $25,000 | $0 | $0 | $0 | |
| Dividends | $0 | $0 | $0 | $0 | $0 | $0 | $0 | $0 | $0 | $0 | $0 | $0 | |
| Subtotal Cash Spent | $24,327 | $60,525 | $39,677 | $31,129 | $37,639 | $37,652 | $26,344 | $34,928 | $61,853 | $32,091 | $53,748 | $47,525 | |
| Net Cash Flow | $72,251 | ($7,083) | ($7,631) | $9,671 | ($3,564) | ($3,446) | $4,999 | ($2,065) | ($2,361) | $25,953 | ($3,702) | $6,294 | |
| Cash Balance | $73,689 | $66,606 | $58,975 | $68,647 | $65,083 | $61,637 | $66,636 | $64,570 | $62,210 | $88,163 | $84,461 | $90,755 | |
| Pro Forma Balance Sheet | |||||||||||||
| Jan | Feb | Mar | Apr | May | Jun | Jul | Aug | Sep | Oct | Nov | Dec | ||
| Assets | Starting Balances | ||||||||||||
| Current Assets | |||||||||||||
| Cash | $1,438 | $73,689 | $66,606 | $58,975 | $68,647 | $65,083 | $61,637 | $66,636 | $64,570 | $62,210 | $88,163 | $84,461 | $90,755 |
| Accounts Receivable | $27,605 | $37,128 | $49,135 | $51,539 | $52,689 | $51,314 | $43,508 | $40,065 | $44,303 | $48,660 | $66,316 | $82,720 | $77,001 |
| Inventory | $10,141 | $7,815 | $8,995 | $8,695 | $9,320 | $8,215 | $6,690 | $7,015 | $8,070 | $8,595 | $14,145 | $14,200 | $12,070 |
| Other Current Assets | $2,375 | $2,375 | $2,375 | $2,375 | $2,375 | $2,375 | $2,375 | $2,375 | $2,375 | $2,375 | $2,375 | $2,375 | $2,375 |
| Total Current Assets | $41,559 | $121,006 | $127,111 | $121,584 | $133,030 | $126,987 | $114,210 | $116,091 | $119,318 | $121,840 | $170,999 | $183,756 | $182,201 |
| Long-term Assets | |||||||||||||
| Long-term Assets | $3,210 | $3,210 | $28,210 | $28,210 | $28,210 | $28,210 | $28,210 | $28,210 | $28,210 | $53,210 | $53,210 | $53,210 | $53,210 |
| Accumulated Depreciation | $1,720 | $1,720 | $1,720 | $1,720 | $1,720 | $1,720 | $1,720 | $1,720 | $1,720 | $1,720 | $1,720 | $1,720 | $2,720 |
| Total Long-term Assets | $1,490 | $1,490 | $26,490 | $26,490 | $26,490 | $26,490 | $26,490 | $26,490 | $26,490 | $51,490 | $51,490 | $51,490 | $50,490 |
| Total Assets | $43,049 | $122,496 | $153,601 | $148,074 | $159,520 | $153,477 | $140,700 | $142,581 | $145,808 | $173,330 | $222,489 | $235,246 | $232,691 |
| Liabilities and Capital | Jan | Feb | Mar | Apr | May | Jun | Jul | Aug | Sep | Oct | Nov | Dec | |
| Current Liabilities | |||||||||||||
| Accounts Payable | $11,191 | $16,986 | $21,442 | $12,626 | $20,370 | $20,827 | $7,975 | $16,487 | $18,602 | $13,086 | $34,943 | $29,150 | $16,671 |
| Current Borrowing | $0 | $75,000 | $73,750 | $67,500 | $66,250 | $61,250 | $56,250 | $50,000 | $48,750 | $47,500 | $61,250 | $65,000 | $58,750 |
| Other Current Liabilities | $1,803 | $1,803 | $1,803 | $1,803 | $1,803 | $1,803 | $1,803 | $1,803 | $1,803 | $1,803 | $1,803 | $1,803 | $1,803 |
| Subtotal Current Liabilities | $12,994 | $93,789 | $96,995 | $81,929 | $88,423 | $83,880 | $66,028 | $68,290 | $69,155 | $62,389 | $97,996 | $95,953 | $77,224 |
| Long-term Liabilities | $0 | $0 | $0 | $0 | $0 | $0 | $0 | $0 | $0 | $0 | $0 | $0 | $0 |
| Total Liabilities | $12,994 | $93,789 | $96,995 | $81,929 | $88,423 | $83,880 | $66,028 | $68,290 | $69,155 | $62,389 | $97,996 | $95,953 | $77,224 |
| Paid-in Capital | $4,500 | $4,500 | $29,500 | $29,500 | $29,500 | $29,500 | $29,500 | $29,500 | $29,500 | $54,500 | $54,500 | $54,500 | $54,500 |
| Retained Earnings | $13,100 | $25,555 | $25,555 | $25,555 | $25,555 | $25,555 | $25,555 | $25,555 | $25,555 | $25,555 | $25,555 | $25,555 | $25,555 |
| Earnings | $12,455 | ($1,348) | $1,552 | $11,090 | $16,042 | $14,542 | $19,616 | $19,236 | $21,598 | $30,886 | $44,438 | $59,238 | $75,412 |
| Total Capital | $30,055 | $28,708 | $56,607 | $66,145 | $71,097 | $69,597 | $74,671 | $74,291 | $76,653 | $110,941 | $124,493 | $139,293 | $155,467 |
| Total Liabilities and Capital | $43,049 | $122,496 | $153,601 | $148,074 | $159,520 | $153,477 | $140,700 | $142,581 | $145,808 | $173,330 | $222,489 | $235,246 | $232,691 |
| Net Worth | $30,055 | $28,708 | $56,607 | $66,145 | $71,097 | $69,597 | $74,671 | $74,291 | $76,653 | $110,941 | $124,493 | $139,293 | $155,467 |

