
Office Space Solutions
Executive Summary
Office Space Solutions improves businesses. Specializing in high-growth companies, it sets up, restructures and streamlines paper flow, communication and office systems. This includes assessments of office space organization and office process flow. The result is a complete turnaround including increased efficiency, reduced costs, greater income, and happier people.
Office Space Solutions has two strong competitive advantages. The first is extensive experience in office space management and work flow efficiency. Bev Johnson, the owner, spent the previous 10 years working with three start-up companies that grew rapidly. With each company, it was her responsibility to manage the personnel growth while improving employee productivity. This experience was priceless. Additionally, the value of networking based on Bev’s previous industry relationships will give Office Space Solutions a leg up on the competition.

1.1 Mission
Office Space Solutions’s mission is to provide the highest quality support services for its clients. Bev focus is to attract and maintain customers. When we adhere to this maxim, everything else will fall into place. Her services will exceed the expectations of her customers.
1.2 Keys to Success
The objectives for the first three years of operation include:
- To create a service-based company whose primary goal is to exceed customers’ expectations.
- To increase the number of clients served by 20% per year through superior performance.
- To develop a sustainable start-up business that is profitable.
Company Summary
Office Space Solutions offers management support services to start-up and growing firms and companies. Bev sets up, restructures, and streamlines office space, paper flow, communication and office systems. Her work reduces office operation cost while increasing work efficiency and revenue for her clients.
2.1 Start-up Summary
Office Space Solutions has the following start-up expenses:
- Computer system with a printer, CD-RW, Microsoft Office, and Microsoft Access.
- Copier, fax, and one phone line.
- Website development.
- Various office supplies.

| Start-up | |
| Requirements | |
| Start-up Expenses | |
| Legal | $0 |
| Stationery etc. | $100 |
| Brochures | $200 |
| Expensed Equipment | $3,000 |
| Other | $0 |
| Total Start-up Expenses | $3,300 |
| Start-up Assets | |
| Cash Required | $6,700 |
| Other Current Assets | $2,000 |
| Long-term Assets | $0 |
| Total Assets | $8,700 |
| Total Requirements | $12,000 |
| Start-up Funding | |
| Start-up Expenses to Fund | $3,300 |
| Start-up Assets to Fund | $8,700 |
| Total Funding Required | $12,000 |
| Assets | |
| Non-cash Assets from Start-up | $2,000 |
| Cash Requirements from Start-up | $6,700 |
| Additional Cash Raised | $0 |
| Cash Balance on Starting Date | $6,700 |
| Total Assets | $8,700 |
| Liabilities and Capital | |
| Liabilities | |
| Current Borrowing | $0 |
| Long-term Liabilities | $0 |
| Accounts Payable (Outstanding Bills) | $0 |
| Other Current Liabilities (interest-free) | $0 |
| Total Liabilities | $0 |
| Capital | |
| Planned Investment | |
| Investor 1 | $7,000 |
| Investor 2 | $5,000 |
| Other | $0 |
| Additional Investment Requirement | $0 |
| Total Planned Investment | $12,000 |
| Loss at Start-up (Start-up Expenses) | ($3,300) |
| Total Capital | $8,700 |
| Total Capital and Liabilities | $8,700 |
| Total Funding | $12,000 |
2.2 Company Ownership
Bev Johnson is the sole owner and consultant of Office Space Solutions. Office Space Solutions is a home-based business. All business meetings will occur at the client’s business or at a location close to the client’s business.
Services
- Planning, setting up, or improving office procedures, including simplifying paper flow, minimizing wasted time and maximizing access to needed materials.
- Controlling costs and minimizing expenses with improved office efficiency and improved office methods.
- Managing office relocations including vendor negotiations and problem solving.
Market Analysis Summary
Office Space Solutions will be focusing on a very specific part of the business market:
- Start-up with more than five employees.
- Small businesses that are rapidly expanding operations.
The city has several support service businesses but none as visible as Office Space Solutions and none with the success record Bev Johnson has.
4.1 Target Market Segment Strategy
Office Space Solutions is focusing on new and growing companies that are often located in small offices. The targeted start-up business will have four or more staff in its office in addition to a owner. This is a perfect atmosphere for a support service because the services Office Space Solutions provides are out of the business’s field of expertise but so critical to their success.
Another reason for focusing on a growing businesses is that it is easier to be competitive with the smaller businesses. Presently, this segment of businesses is not being marketed by the Office Space Solutions’s competitors.
For these reasons, Office Space Solutions will concentrate on the new and growing companies to be able to quickly grab market share.
4.2 Service Business Analysis
The competition consists of a few support service firms that offer a wide range of service offerings to city’s large companies. Though these firms replicate the offerings of Office Space Solutions, they are not targeting the vital area of new and growing businesses. Office Space Solutions will focus only on these companies. There is an advantage to hiring a service that is focused on your problems and is knowledgeable regarding your specific needs.
In addition, the target clients are prone to want a long-term relationship with critical services. If they are happy they will generally stay with the same service provider. It is more cost effective then jumping through the hoops each time it needs a space management, or work flow assessment.
4.3 Market Segmentation
The market for office space and work flow organizers can be broken down into two important segments:
- Start-ups with five or more employees. These start-ups rarely have the in-house expertise to solve office space or work flow management problems. As a general role, there is a tremendous amount of wasted effort and space in start-ups. The focus is always on getting a product or service out to customers with very little thought about how the office organization is working against them. The city is growing at a rate of 10% annually and the numbers of start-ups increase each year in all the city’s major industries and service areas. Office Space Solutions believes that this is an underserved segment and with her successes and connections, Office Space Solutions would become an invaluable service to these target clients. As these companies move from the start-up phase to the growth phase, Office Space Solutions will receive this repeat business.
- Small rapidly growing companies. These companies have already reached some margin of success and are planning to expand their operations; yet this doesn’t mean that they are efficient. The success of their product or service may be hiding problems in the operation that will emerge as greater pressure is placed on company performance. Each stage of growth in a company, present challenges that can hurt its performance and success. Office Space Solutions can provide these companies a focused approach that is responsive to unique client demands, assisting them in achieving their future sales goals.

| Market Analysis | |||||||
| Year 1 | Year 2 | Year 3 | Year 4 | Year 5 | |||
| Potential Customers | Growth | CAGR | |||||
| Start-Up | 15% | 535 | 615 | 707 | 813 | 935 | 14.98% |
| Growing Business | 10% | 634 | 697 | 767 | 844 | 928 | 9.99% |
| Other | 0% | 0 | 0 | 0 | 0 | 0 | 0.00% |
| Total | 12.36% | 1,169 | 1,312 | 1,474 | 1,657 | 1,863 | 12.36% |
Strategy and Implementation Summary
Office Space Solutions will sustain its competitive advantages to steadily gain market share. The first advantage is based on extensive knowledge of office space management and work flow efficiency. The second advantage is an already established network of contacts among numerous start-ups and growing companies.
5.1 Competitive Edge
Office Space Solutions’ competitive edge is the ten years Bev Johnson has spent being the go-to person that new businesses contact with questions concerning space management and work flow problems. These referrals have all occurred through word of mouth from the extensive network of office manager contacts Bev has gathered over the years. Her industry access is invaluable for networking. These established relationships create a trust bond that is significant when it comes to generating new referrals.

Bev has been giving many presentations on space and process management for professional women’s groups and the city’s Chamber of Commerce.
Bev also has the unique track record of being pivotal in the success of three start-ups over the past ten years. In each of these cases, she was hired away from her previous employer because of her success in transforming the office environment from a chaotic shamble into a productive oasis.
5.2 Sales Strategy
Office Space Solutions’ sales strategy will be based on systematic person to person contacts with new and growing businesses. Bev has already compiled a list of referrals that will serve as the launching pad.
5.2.1 Sales Forecast
The following table and chart give a run-down on forecasted sales. As a consulting firm there are negligible cost of sales, and Bev’s salary is included in the Personnel table.


| Sales Forecast | |||
| Year 1 | Year 2 | Year 3 | |
| Sales | |||
| Start-Ups | $19,606 | $30,000 | $40,000 |
| Growing Businesses | $38,164 | $50,000 | $60,000 |
| Total Sales | $57,770 | $80,000 | $100,000 |
| Direct Cost of Sales | Year 1 | Year 2 | Year 3 |
| Start-Ups | $0 | $0 | $0 |
| Growing Businesses | $0 | $0 | $0 |
| Subtotal Direct Cost of Sales | $0 | $0 | $0 |
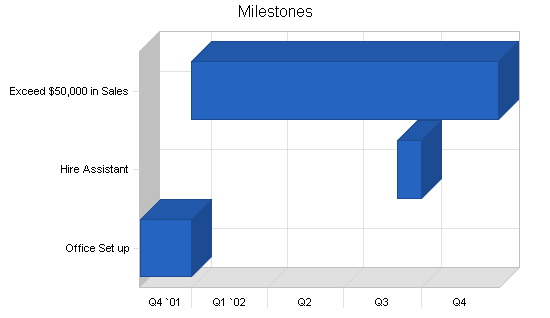
5.3 Milestones
Office Space Solutions will have several milestones early on:
- Office set up.
- Exceed $50,000 in sales the first year.
| Milestones | |||||
| Milestone | Start Date | End Date | Budget | Manager | Department |
| Office Set up | 11/1/2001 | 1/1/2002 | $0 | BJ | Owner |
| Hire Assistant | 9/1/2002 | 9/30/2002 | $0 | BJ | Owner |
| Exceed $50,000 in Sales | 1/1/2002 | 12/30/2002 | $0 | BJ | Owner |
| Totals | $0 | ||||
Management Summary
Bev Johnson, founder and owner, received her Bachelor Degree in business management from Willamette University. During her undergraduate studies, Bev created her own support staff company, including typing students term papers. This was quite lucrative because there were a lot of students at Willamette that were unwilling to do their own typing and they were much more content paying someone else.
After college, Bev worked in a number of office settings developing her skill in cutting waste and inefficiency in the office. She received her first office manager position with Renco, a high-tech start-up that grew from 15 people to over 59 employees in three years. Her next position was with office coordinator for Carter Technology. During her time there, the staff grew from 30 people to 89 employee in three years. Her last position before starting Office Space Solutions was with Steward Consulting. This company grew from 45 employee to over 258 staff members in four years.
Toward the end of her tenure with Steward Consulting she was getting a bit restless. She was looking for a new challenge, something she could do all on her own. One day the idea dawned on her that she could leverage her knowledge of office efficiency into a new business.
| Personnel Plan | |||
| Year 1 | Year 2 | Year 3 | |
| Owner | $32,000 | $40,000 | $47,000 |
| Part-time assistant | $3,000 | $16,000 | $18,000 |
| Other | $0 | $0 | $0 |
| Total People | 0 | 0 | 0 |
| Total Payroll | $35,000 | $56,000 | $65,000 |
Financial Plan
The following sections will outline the important financial assumptions, key financial indicators, break-even analysis, profit and loss, cash flow, and the balance sheet.
7.1 Important Assumptions
The following table highlights some of the important financial assumptions for Office Space Solutions.
| General Assumptions | |||
| Year 1 | Year 2 | Year 3 | |
| Plan Month | 1 | 2 | 3 |
| Current Interest Rate | 10.00% | 10.00% | 10.00% |
| Long-term Interest Rate | 10.00% | 10.00% | 10.00% |
| Tax Rate | 30.00% | 30.00% | 30.00% |
| Other | 0 | 0 | 0 |
7.2 Break-even Analysis
The Break-even Analysis table and chart below indicate the monthly revenue needed to break even.

| Break-even Analysis | |
| Monthly Revenue Break-even | $3,576 |
| Assumptions: | |
| Average Percent Variable Cost | 0% |
| Estimated Monthly Fixed Cost | $3,576 |
7.3 Projected Profit and Loss
The following table will indicate projected profit and loss.


| Pro Forma Profit and Loss | |||
| Year 1 | Year 2 | Year 3 | |
| Sales | $57,770 | $80,000 | $100,000 |
| Direct Cost of Sales | $0 | $0 | $0 |
| Other Production Expenses | $0 | $0 | $0 |
| Total Cost of Sales | $0 | $0 | $0 |
| Gross Margin | $57,770 | $80,000 | $100,000 |
| Gross Margin % | 100.00% | 100.00% | 100.00% |
| Expenses | |||
| Payroll | $35,000 | $56,000 | $65,000 |
| Sales and Marketing and Other Expenses | $2,660 | $3,200 | $4,150 |
| Depreciation | $0 | $0 | $0 |
| Leased Equipment | $0 | $0 | $0 |
| Utilities | $0 | $0 | $0 |
| Insurance | $0 | $0 | $0 |
| Rent | $0 | $0 | $0 |
| Payroll Taxes | $5,250 | $8,400 | $9,750 |
| Other | $0 | $0 | $0 |
| Total Operating Expenses | $42,910 | $67,600 | $78,900 |
| Profit Before Interest and Taxes | $14,860 | $12,400 | $21,100 |
| EBITDA | $14,860 | $12,400 | $21,100 |
| Interest Expense | $0 | $0 | $0 |
| Taxes Incurred | $4,458 | $3,720 | $6,330 |
| Net Profit | $10,402 | $8,680 | $14,770 |
| Net Profit/Sales | 18.01% | 10.85% | 14.77% |
7.4 Projected Cash Flow
The following chart and table indicates projected cash flow.

| Pro Forma Cash Flow | |||
| Year 1 | Year 2 | Year 3 | |
| Cash Received | |||
| Cash from Operations | |||
| Cash Sales | $31,774 | $44,000 | $55,000 |
| Cash from Receivables | $18,069 | $32,950 | $42,256 |
| Subtotal Cash from Operations | $49,843 | $76,950 | $97,256 |
| Additional Cash Received | |||
| Sales Tax, VAT, HST/GST Received | $0 | $0 | $0 |
| New Current Borrowing | $0 | $0 | $0 |
| New Other Liabilities (interest-free) | $0 | $0 | $0 |
| New Long-term Liabilities | $0 | $0 | $0 |
| Sales of Other Current Assets | $0 | $0 | $0 |
| Sales of Long-term Assets | $0 | $0 | $0 |
| New Investment Received | $0 | $0 | $0 |
| Subtotal Cash Received | $49,843 | $76,950 | $97,256 |
| Expenditures | Year 1 | Year 2 | Year 3 |
| Expenditures from Operations | |||
| Cash Spending | $35,000 | $56,000 | $65,000 |
| Bill Payments | $10,257 | $16,172 | $19,826 |
| Subtotal Spent on Operations | $45,257 | $72,172 | $84,826 |
| Additional Cash Spent | |||
| Sales Tax, VAT, HST/GST Paid Out | $0 | $0 | $0 |
| Principal Repayment of Current Borrowing | $0 | $0 | $0 |
| Other Liabilities Principal Repayment | $0 | $0 | $0 |
| Long-term Liabilities Principal Repayment | $0 | $0 | $0 |
| Purchase Other Current Assets | $0 | $0 | $0 |
| Purchase Long-term Assets | $0 | $0 | $0 |
| Dividends | $0 | $0 | $0 |
| Subtotal Cash Spent | $45,257 | $72,172 | $84,826 |
| Net Cash Flow | $4,586 | $4,778 | $12,429 |
| Cash Balance | $11,286 | $16,064 | $28,493 |
7.5 Projected Balance Sheet
The following table indicates the projected balance sheet.
| Pro Forma Balance Sheet | |||
| Year 1 | Year 2 | Year 3 | |
| Assets | |||
| Current Assets | |||
| Cash | $11,286 | $16,064 | $28,493 |
| Accounts Receivable | $7,927 | $10,977 | $13,722 |
| Other Current Assets | $2,000 | $2,000 | $2,000 |
| Total Current Assets | $21,213 | $29,041 | $44,215 |
| Long-term Assets | |||
| Long-term Assets | $0 | $0 | $0 |
| Accumulated Depreciation | $0 | $0 | $0 |
| Total Long-term Assets | $0 | $0 | $0 |
| Total Assets | $21,213 | $29,041 | $44,215 |
| Liabilities and Capital | Year 1 | Year 2 | Year 3 |
| Current Liabilities | |||
| Accounts Payable | $2,111 | $1,259 | $1,663 |
| Current Borrowing | $0 | $0 | $0 |
| Other Current Liabilities | $0 | $0 | $0 |
| Subtotal Current Liabilities | $2,111 | $1,259 | $1,663 |
| Long-term Liabilities | $0 | $0 | $0 |
| Total Liabilities | $2,111 | $1,259 | $1,663 |
| Paid-in Capital | $12,000 | $12,000 | $12,000 |
| Retained Earnings | ($3,300) | $7,102 | $15,782 |
| Earnings | $10,402 | $8,680 | $14,770 |
| Total Capital | $19,102 | $27,782 | $42,552 |
| Total Liabilities and Capital | $21,213 | $29,041 | $44,215 |
| Net Worth | $19,102 | $27,782 | $42,552 |
7.6 Business Ratios
The following table outlines some of the more important ratios from the Management Consulting Services industry. The final column, Industry Profile, details specific ratios based on the industry as it is classified by the NAICS code, 541618.
| Ratio Analysis | ||||
| Year 1 | Year 2 | Year 3 | Industry Profile | |
| Sales Growth | 0.00% | 38.48% | 25.00% | 12.40% |
| Percent of Total Assets | ||||
| Accounts Receivable | 37.37% | 37.80% | 31.03% | 26.10% |
| Other Current Assets | 9.43% | 6.89% | 4.52% | 44.70% |
| Total Current Assets | 100.00% | 100.00% | 100.00% | 74.50% |
| Long-term Assets | 0.00% | 0.00% | 0.00% | 25.50% |
| Total Assets | 100.00% | 100.00% | 100.00% | 100.00% |
| Current Liabilities | 9.95% | 4.34% | 3.76% | 44.30% |
| Long-term Liabilities | 0.00% | 0.00% | 0.00% | 16.00% |
| Total Liabilities | 9.95% | 4.34% | 3.76% | 60.30% |
| Net Worth | 90.05% | 95.66% | 96.24% | 39.70% |
| Percent of Sales | ||||
| Sales | 100.00% | 100.00% | 100.00% | 100.00% |
| Gross Margin | 100.00% | 100.00% | 100.00% | 0.00% |
| Selling, General & Administrative Expenses | 81.99% | 89.15% | 85.23% | 80.80% |
| Advertising Expenses | 2.42% | 1.88% | 2.00% | 1.30% |
| Profit Before Interest and Taxes | 25.72% | 15.50% | 21.10% | 2.20% |
| Main Ratios | ||||
| Current | 10.05 | 23.06 | 26.59 | 1.75 |
| Quick | 10.05 | 23.06 | 26.59 | 1.38 |
| Total Debt to Total Assets | 9.95% | 4.34% | 3.76% | 60.30% |
| Pre-tax Return on Net Worth | 77.79% | 44.63% | 49.59% | 3.80% |
| Pre-tax Return on Assets | 70.05% | 42.70% | 47.72% | 9.70% |
| Additional Ratios | Year 1 | Year 2 | Year 3 | |
| Net Profit Margin | 18.01% | 10.85% | 14.77% | n.a |
| Return on Equity | 54.46% | 31.24% | 34.71% | n.a |
| Activity Ratios | ||||
| Accounts Receivable Turnover | 3.28 | 3.28 | 3.28 | n.a |
| Collection Days | 55 | 96 | 100 | n.a |
| Accounts Payable Turnover | 5.86 | 12.17 | 12.17 | n.a |
| Payment Days | 27 | 40 | 26 | n.a |
| Total Asset Turnover | 2.72 | 2.75 | 2.26 | n.a |
| Debt Ratios | ||||
| Debt to Net Worth | 0.11 | 0.05 | 0.04 | n.a |
| Current Liab. to Liab. | 1.00 | 1.00 | 1.00 | n.a |
| Liquidity Ratios | ||||
| Net Working Capital | $19,102 | $27,782 | $42,552 | n.a |
| Interest Coverage | 0.00 | 0.00 | 0.00 | n.a |
| Additional Ratios | ||||
| Assets to Sales | 0.37 | 0.36 | 0.44 | n.a |
| Current Debt/Total Assets | 10% | 4% | 4% | n.a |
| Acid Test | 6.29 | 14.35 | 18.34 | n.a |
| Sales/Net Worth | 3.02 | 2.88 | 2.35 | n.a |
| Dividend Payout | 0.00 | 0.00 | 0.00 | n.a |
Appendix
| Sales Forecast | |||||||||||||
| Month 1 | Month 2 | Month 3 | Month 4 | Month 5 | Month 6 | Month 7 | Month 8 | Month 9 | Month 10 | Month 11 | Month 12 | ||
| Sales | |||||||||||||
| Start-Ups | 0% | $600 | $1,002 | $1,150 | $1,288 | $1,322 | $1,534 | $1,544 | $1,722 | $1,900 | $2,245 | $2,599 | $2,700 |
| Growing Businesses | 0% | $1,002 | $1,200 | $1,345 | $1,688 | $1,992 | $2,512 | $3,002 | $3,600 | $4,200 | $5,023 | $5,900 | $6,700 |
| Total Sales | $1,602 | $2,202 | $2,495 | $2,976 | $3,314 | $4,046 | $4,546 | $5,322 | $6,100 | $7,268 | $8,499 | $9,400 | |
| Direct Cost of Sales | Month 1 | Month 2 | Month 3 | Month 4 | Month 5 | Month 6 | Month 7 | Month 8 | Month 9 | Month 10 | Month 11 | Month 12 | |
| Start-Ups | $0 | $0 | $0 | $0 | $0 | $0 | $0 | $0 | $0 | $0 | $0 | $0 | |
| Growing Businesses | $0 | $0 | $0 | $0 | $0 | $0 | $0 | $0 | $0 | $0 | $0 | $0 | |
| Subtotal Direct Cost of Sales | $0 | $0 | $0 | $0 | $0 | $0 | $0 | $0 | $0 | $0 | $0 | $0 | |
| Personnel Plan | |||||||||||||
| Month 1 | Month 2 | Month 3 | Month 4 | Month 5 | Month 6 | Month 7 | Month 8 | Month 9 | Month 10 | Month 11 | Month 12 | ||
| Owner | 0% | $2,000 | $2,000 | $2,000 | $2,000 | $3,000 | $3,000 | $3,000 | $3,000 | $3,000 | $3,000 | $3,000 | $3,000 |
| Part-time assistant | 0% | $0 | $0 | $0 | $0 | $0 | $0 | $0 | $0 | $0 | $1,000 | $1,000 | $1,000 |
| Other | 0% | $0 | $0 | $0 | $0 | $0 | $0 | $0 | $0 | $0 | $0 | $0 | $0 |
| Total People | 0 | 0 | 0 | 0 | 0 | 0 | 0 | 0 | 0 | 0 | 0 | 0 | |
| Total Payroll | $2,000 | $2,000 | $2,000 | $2,000 | $3,000 | $3,000 | $3,000 | $3,000 | $3,000 | $4,000 | $4,000 | $4,000 | |
| General Assumptions | |||||||||||||
| Month 1 | Month 2 | Month 3 | Month 4 | Month 5 | Month 6 | Month 7 | Month 8 | Month 9 | Month 10 | Month 11 | Month 12 | ||
| Plan Month | 1 | 2 | 3 | 4 | 5 | 6 | 7 | 8 | 9 | 10 | 11 | 12 | |
| Current Interest Rate | 10.00% | 10.00% | 10.00% | 10.00% | 10.00% | 10.00% | 10.00% | 10.00% | 10.00% | 10.00% | 10.00% | 10.00% | |
| Long-term Interest Rate | 10.00% | 10.00% | 10.00% | 10.00% | 10.00% | 10.00% | 10.00% | 10.00% | 10.00% | 10.00% | 10.00% | 10.00% | |
| Tax Rate | 30.00% | 30.00% | 30.00% | 30.00% | 30.00% | 30.00% | 30.00% | 30.00% | 30.00% | 30.00% | 30.00% | 30.00% | |
| Other | 0 | 0 | 0 | 0 | 0 | 0 | 0 | 0 | 0 | 0 | 0 | 0 | |
| Pro Forma Profit and Loss | |||||||||||||
| Month 1 | Month 2 | Month 3 | Month 4 | Month 5 | Month 6 | Month 7 | Month 8 | Month 9 | Month 10 | Month 11 | Month 12 | ||
| Sales | $1,602 | $2,202 | $2,495 | $2,976 | $3,314 | $4,046 | $4,546 | $5,322 | $6,100 | $7,268 | $8,499 | $9,400 | |
| Direct Cost of Sales | $0 | $0 | $0 | $0 | $0 | $0 | $0 | $0 | $0 | $0 | $0 | $0 | |
| Other Production Expenses | $0 | $0 | $0 | $0 | $0 | $0 | $0 | $0 | $0 | $0 | $0 | $0 | |
| Total Cost of Sales | $0 | $0 | $0 | $0 | $0 | $0 | $0 | $0 | $0 | $0 | $0 | $0 | |
| Gross Margin | $1,602 | $2,202 | $2,495 | $2,976 | $3,314 | $4,046 | $4,546 | $5,322 | $6,100 | $7,268 | $8,499 | $9,400 | |
| Gross Margin % | 100.00% | 100.00% | 100.00% | 100.00% | 100.00% | 100.00% | 100.00% | 100.00% | 100.00% | 100.00% | 100.00% | 100.00% | |
| Expenses | |||||||||||||
| Payroll | $2,000 | $2,000 | $2,000 | $2,000 | $3,000 | $3,000 | $3,000 | $3,000 | $3,000 | $4,000 | $4,000 | $4,000 | |
| Sales and Marketing and Other Expenses | $305 | $305 | $205 | $205 | $205 | $205 | $205 | $205 | $205 | $205 | $205 | $205 | |
| Depreciation | $0 | $0 | $0 | $0 | $0 | $0 | $0 | $0 | $0 | $0 | $0 | $0 | |
| Leased Equipment | $0 | $0 | $0 | $0 | $0 | $0 | $0 | $0 | $0 | $0 | $0 | $0 | |
| Utilities | $0 | $0 | $0 | $0 | $0 | $0 | $0 | $0 | $0 | $0 | $0 | $0 | |
| Insurance | $0 | $0 | $0 | $0 | $0 | $0 | $0 | $0 | $0 | $0 | $0 | $0 | |
| Rent | $0 | $0 | $0 | $0 | $0 | $0 | $0 | $0 | $0 | $0 | $0 | $0 | |
| Payroll Taxes | 15% | $300 | $300 | $300 | $300 | $450 | $450 | $450 | $450 | $450 | $600 | $600 | $600 |
| Other | $0 | $0 | $0 | $0 | $0 | $0 | $0 | $0 | $0 | $0 | $0 | $0 | |
| Total Operating Expenses | $2,605 | $2,605 | $2,505 | $2,505 | $3,655 | $3,655 | $3,655 | $3,655 | $3,655 | $4,805 | $4,805 | $4,805 | |
| Profit Before Interest and Taxes | ($1,003) | ($403) | ($10) | $471 | ($341) | $391 | $891 | $1,667 | $2,445 | $2,463 | $3,694 | $4,595 | |
| EBITDA | ($1,003) | ($403) | ($10) | $471 | ($341) | $391 | $891 | $1,667 | $2,445 | $2,463 | $3,694 | $4,595 | |
| Interest Expense | $0 | $0 | $0 | $0 | $0 | $0 | $0 | $0 | $0 | $0 | $0 | $0 | |
| Taxes Incurred | ($301) | ($121) | ($3) | $141 | ($102) | $117 | $267 | $500 | $734 | $739 | $1,108 | $1,379 | |
| Net Profit | ($702) | ($282) | ($7) | $330 | ($239) | $274 | $624 | $1,167 | $1,712 | $1,724 | $2,586 | $3,217 | |
| Net Profit/Sales | -43.83% | -12.81% | -0.28% | 11.08% | -7.20% | 6.76% | 13.72% | 21.93% | 28.06% | 23.72% | 30.42% | 34.22% | |
| Pro Forma Cash Flow | |||||||||||||
| Month 1 | Month 2 | Month 3 | Month 4 | Month 5 | Month 6 | Month 7 | Month 8 | Month 9 | Month 10 | Month 11 | Month 12 | ||
| Cash Received | |||||||||||||
| Cash from Operations | |||||||||||||
| Cash Sales | $881 | $1,211 | $1,372 | $1,637 | $1,823 | $2,225 | $2,500 | $2,927 | $3,355 | $3,997 | $4,674 | $5,170 | |
| Cash from Receivables | $0 | $24 | $730 | $995 | $1,130 | $1,344 | $1,502 | $1,828 | $2,057 | $2,407 | $2,763 | $3,289 | |
| Subtotal Cash from Operations | $881 | $1,235 | $2,102 | $2,632 | $2,953 | $3,570 | $4,003 | $4,755 | $5,412 | $6,404 | $7,437 | $8,459 | |
| Additional Cash Received | |||||||||||||
| Sales Tax, VAT, HST/GST Received | 0.00% | $0 | $0 | $0 | $0 | $0 | $0 | $0 | $0 | $0 | $0 | $0 | $0 |
| New Current Borrowing | $0 | $0 | $0 | $0 | $0 | $0 | $0 | $0 | $0 | $0 | $0 | $0 | |
| New Other Liabilities (interest-free) | $0 | $0 | $0 | $0 | $0 | $0 | $0 | $0 | $0 | $0 | $0 | $0 | |
| New Long-term Liabilities | $0 | $0 | $0 | $0 | $0 | $0 | $0 | $0 | $0 | $0 | $0 | $0 | |
| Sales of Other Current Assets | $0 | $0 | $0 | $0 | $0 | $0 | $0 | $0 | $0 | $0 | $0 | $0 | |
| Sales of Long-term Assets | $0 | $0 | $0 | $0 | $0 | $0 | $0 | $0 | $0 | $0 | $0 | $0 | |
| New Investment Received | $0 | $0 | $0 | $0 | $0 | $0 | $0 | $0 | $0 | $0 | $0 | $0 | |
| Subtotal Cash Received | $881 | $1,235 | $2,102 | $2,632 | $2,953 | $3,570 | $4,003 | $4,755 | $5,412 | $6,404 | $7,437 | $8,459 | |
| Expenditures | Month 1 | Month 2 | Month 3 | Month 4 | Month 5 | Month 6 | Month 7 | Month 8 | Month 9 | Month 10 | Month 11 | Month 12 | |
| Expenditures from Operations | |||||||||||||
| Cash Spending | $2,000 | $2,000 | $2,000 | $2,000 | $3,000 | $3,000 | $3,000 | $3,000 | $3,000 | $4,000 | $4,000 | $4,000 | |
| Bill Payments | $10 | $310 | $485 | $507 | $643 | $560 | $777 | $930 | $1,163 | $1,394 | $1,556 | $1,922 | |
| Subtotal Spent on Operations | $2,010 | $2,310 | $2,485 | $2,507 | $3,643 | $3,560 | $3,777 | $3,930 | $4,163 | $5,394 | $5,556 | $5,922 | |
| Additional Cash Spent | |||||||||||||
| Sales Tax, VAT, HST/GST Paid Out | $0 | $0 | $0 | $0 | $0 | $0 | $0 | $0 | $0 | $0 | $0 | $0 | |
| Principal Repayment of Current Borrowing | $0 | $0 | $0 | $0 | $0 | $0 | $0 | $0 | $0 | $0 | $0 | $0 | |
| Other Liabilities Principal Repayment | $0 | $0 | $0 | $0 | $0 | $0 | $0 | $0 | $0 | $0 | $0 | $0 | |
| Long-term Liabilities Principal Repayment | $0 | $0 | $0 | $0 | $0 | $0 | $0 | $0 | $0 | $0 | $0 | $0 | |
| Purchase Other Current Assets | $0 | $0 | $0 | $0 | $0 | $0 | $0 | $0 | $0 | $0 | $0 | $0 | |
| Purchase Long-term Assets | $0 | $0 | $0 | $0 | $0 | $0 | $0 | $0 | $0 | $0 | $0 | $0 | |
| Dividends | $0 | $0 | $0 | $0 | $0 | $0 | $0 | $0 | $0 | $0 | $0 | $0 | |
| Subtotal Cash Spent | $2,010 | $2,310 | $2,485 | $2,507 | $3,643 | $3,560 | $3,777 | $3,930 | $4,163 | $5,394 | $5,556 | $5,922 | |
| Net Cash Flow | ($1,129) | ($1,075) | ($383) | $125 | ($691) | $10 | $225 | $825 | $1,249 | $1,010 | $1,881 | $2,537 | |
| Cash Balance | $5,571 | $4,496 | $4,113 | $4,239 | $3,548 | $3,558 | $3,783 | $4,608 | $5,858 | $6,868 | $8,749 | $11,286 | |
| Pro Forma Balance Sheet | |||||||||||||
| Month 1 | Month 2 | Month 3 | Month 4 | Month 5 | Month 6 | Month 7 | Month 8 | Month 9 | Month 10 | Month 11 | Month 12 | ||
| Assets | Starting Balances | ||||||||||||
| Current Assets | |||||||||||||
| Cash | $6,700 | $5,571 | $4,496 | $4,113 | $4,239 | $3,548 | $3,558 | $3,783 | $4,608 | $5,858 | $6,868 | $8,749 | $11,286 |
| Accounts Receivable | $0 | $721 | $1,688 | $2,081 | $2,425 | $2,786 | $3,262 | $3,806 | $4,372 | $5,060 | $5,924 | $6,986 | $7,927 |
| Other Current Assets | $2,000 | $2,000 | $2,000 | $2,000 | $2,000 | $2,000 | $2,000 | $2,000 | $2,000 | $2,000 | $2,000 | $2,000 | $2,000 |
| Total Current Assets | $8,700 | $8,292 | $8,184 | $8,194 | $8,663 | $8,334 | $8,820 | $9,589 | $10,981 | $12,918 | $14,792 | $17,735 | $21,213 |
| Long-term Assets | |||||||||||||
| Long-term Assets | $0 | $0 | $0 | $0 | $0 | $0 | $0 | $0 | $0 | $0 | $0 | $0 | $0 |
| Accumulated Depreciation | $0 | $0 | $0 | $0 | $0 | $0 | $0 | $0 | $0 | $0 | $0 | $0 | $0 |
| Total Long-term Assets | $0 | $0 | $0 | $0 | $0 | $0 | $0 | $0 | $0 | $0 | $0 | $0 | $0 |
| Total Assets | $8,700 | $8,292 | $8,184 | $8,194 | $8,663 | $8,334 | $8,820 | $9,589 | $10,981 | $12,918 | $14,792 | $17,735 | $21,213 |
| Liabilities and Capital | Month 1 | Month 2 | Month 3 | Month 4 | Month 5 | Month 6 | Month 7 | Month 8 | Month 9 | Month 10 | Month 11 | Month 12 | |
| Current Liabilities | |||||||||||||
| Accounts Payable | $0 | $294 | $468 | $485 | $625 | $534 | $747 | $892 | $1,117 | $1,342 | $1,492 | $1,849 | $2,111 |
| Current Borrowing | $0 | $0 | $0 | $0 | $0 | $0 | $0 | $0 | $0 | $0 | $0 | $0 | $0 |
| Other Current Liabilities | $0 | $0 | $0 | $0 | $0 | $0 | $0 | $0 | $0 | $0 | $0 | $0 | $0 |
| Subtotal Current Liabilities | $0 | $294 | $468 | $485 | $625 | $534 | $747 | $892 | $1,117 | $1,342 | $1,492 | $1,849 | $2,111 |
| Long-term Liabilities | $0 | $0 | $0 | $0 | $0 | $0 | $0 | $0 | $0 | $0 | $0 | $0 | $0 |
| Total Liabilities | $0 | $294 | $468 | $485 | $625 | $534 | $747 | $892 | $1,117 | $1,342 | $1,492 | $1,849 | $2,111 |
| Paid-in Capital | $12,000 | $12,000 | $12,000 | $12,000 | $12,000 | $12,000 | $12,000 | $12,000 | $12,000 | $12,000 | $12,000 | $12,000 | $12,000 |
| Retained Earnings | ($3,300) | ($3,300) | ($3,300) | ($3,300) | ($3,300) | ($3,300) | ($3,300) | ($3,300) | ($3,300) | ($3,300) | ($3,300) | ($3,300) | ($3,300) |
| Earnings | $0 | ($702) | ($984) | ($991) | ($662) | ($900) | ($627) | ($3) | $1,164 | $2,876 | $4,600 | $7,186 | $10,402 |
| Total Capital | $8,700 | $7,998 | $7,716 | $7,709 | $8,039 | $7,800 | $8,074 | $8,697 | $9,864 | $11,576 | $13,300 | $15,886 | $19,102 |
| Total Liabilities and Capital | $8,700 | $8,292 | $8,184 | $8,194 | $8,663 | $8,334 | $8,820 | $9,589 | $10,981 | $12,918 | $14,792 | $17,735 | $21,213 |
| Net Worth | $8,700 | $7,998 | $7,716 | $7,709 | $8,039 | $7,800 | $8,074 | $8,697 | $9,864 | $11,576 | $13,300 | $15,886 | $19,102 |


