
Workwell
Executive Summary
Workwell is a premier Occupational Medicine Program of Centroplex Health System (CHS) designed to reduce health care costs, increase productivity, reduce absenteeism, enhance employee morale, attract and retain high-quality employees and create a positive return on investment. Workwell will be Killeen’s pioneer Industrial Occupational Medicine Program and will serve area businesses, helping them to become more productive, while lowering their overall costs.
In their attempt to reduce health care costs, employers “want” occupational medicine clinics that provide them with the following components: accessibility, drug screening services, high quality staff, state-of-the-art care, and a wide scope of services. Through its mission of promoting total health–body, mind, and spirit–while developing and nurturing partnerships with regional businesses, Workwell will fulfill area employer “wants” and “needs.”
Workwell’s existence is based on two simple facts:
- Healthy employees are more productive than chronically ill employees.
- It costs less to prevent injuries than to treat them after they occur.
By helping employees change their behavior patterns and choose more healthy lifestyles, Workwell will lower a company’s health care expenditures, while raising worker productivity. Health care expenditures will decrease due to reduced medical insurance premiums, reduced absenteeism, reduced turnover rates, reduced worker’s compensation claims, reduced tardiness and shorter hospital stays.
A key advantage that Workwell has and should maximize is its relationship with Centroplex Health System (CHS). As the provider of choice for health care services in its service area, CHS already supports the essential structures required to develop a successful Occupational Medicine program, such as Workwell. These structures include an Emergency Department, a free standing walk-in facility (i.e. COMC), a network of primary and specialty physicians and an MCO(currently being developed). All four of these structures should form a loop that serves as a catalyst to feed business into the Workwell program, and in return Workwell should refer back into these four structures, which completes the loop. The proposed model is to provide Occupational Medicine services– Workwell– and primary care services under one setting, that setting being COMC. This mix of services will offer an alternative comprehensive system of Occupational Health and Primary Care services to our client employers. The result will be a synergy that expands the market, establishes new relationships, reduces operating expenses, and generates new revenue.
Workwell’s keys to success and critical factors for the next three years are:
- Development and implementation of a successful marketing strategy/plan to employers.
- Recruitment of experienced medical and administrative talent.
- Enter the Occupational Medicine market and build a “brand” name before the competition.
- Commitment to continuously improve the quality of service.
- Demonstrate a financial return on investment.
- Commitment from Senior Management
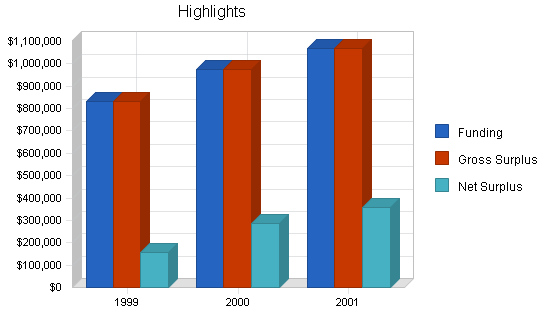
The business plan justifies the development and implementation of an occupational medicine program by CHS. The market research shows that last year total worker compensation injuries were 7,720 of which CHS treated 2,532. In addition, worker compensation injuries are projected to increase to a total of 9,446 in the next four years. The five-year goal of this business plan is to position CHS to treat 5,064 worker compensation injuries and thus attain 53 percent of the market.
The following chart illustrates the over-all highlights of the business plan over the next five years. Total visits to COMC are projected to increase from 11,085 to 15,918 by Year 5. This will in-turn generate increasing total revenues and net surplus.
1.1 Objectives
- The key objective of Workwell will be to help ESTABLISH Centroplex Health System as the “ONE STOP SHOPPING” MEDICAL CENTER FOR HEALTH CARE IN ITS SERVICE AREA.”
- Provide a full continuum of Industrial Occupational Medicine services that provides responsive, quality medical care to all injured employees.
- Provide Occupational Medicine services to 10 major Killeen employers (50 < employees) and 20 small employers (50 > employees) by the end of Year 1.
- Expand the target market to provide Occupational Medicine services to employers in these zip codes: 76540-43, 76548, 76513, and 76559, by the end of Year 2.
- Expand the target market to provide Occupational Medicine services to the Centroplex Health System Service Area (Bell, Lampasas and Coryell county) employers by the end of Year 3.
- Become the Provider of Choice for Occupational Medicine in the service area.
1.1.1 Observation & Recommendations
OBSERVATION
Occupational health programs have been stepchildren in hospitals because they’ve historically not brought in much revenue. But they could become more lucrative if health systems develop the necessary competencies and sell them directly to employers. As the health care dollar shrinks due to the limitations of discounted managed care, providers must be proactive and aggressively pursue new revenue streams. Occupational health services offers the venue and format to establish positive relationships with local employers and their employees that can lead to tapping into entirely new revenue streams.
RECOMMENDATIONS
The underlying factor in these recommendations is TIME IS OF THE ESSENCE FOR DEVELOPING WORKWELL.
Following are the recommendations (options) being made:
Obtain the services of a consultant to start the program
Two main reasons for this recommendation: First, expertise is required in developing an occupational medicine program. Second, why reinvent the wheel when we can learn from proven techniques. All of the programs researched either hired an experienced occupational medicine director or an outside consultant specifically to bring the the program to fruition. Because CHS lacks expertise in this area and currently does not intend to hire a seasoned director to champion this effort, hiring the services of a consulting firm should be considered seriously.
Other reasons are:
This option will allow CHS to start offering area employers as well as its own employees a formalized occupational medicine program within 30 – 45 days. The personnel burden ($$$) required in developing this program can be utilized towards paying experts to implement their proven techniques. By spending the monies to acquire consultants, senior leadership will find a renewed commitment to the success of the program.
Although CHS runs the risk of having a “canned” program, it is understood that the positives outweigh the negatives. Three consulting firms have submitted their bids towards this project. These are Concentra Health Services, Florida Hospital and Occupational Health Research. I have included a copy of this information in your presentation.
Develop the occupational medicine program in-house
Positives:
Save money.
Customized program.Negatives:
Time frame.
Lack of expertise.
Lack of commitment from senior leadership.
Decision to remain status quo:
In this option, the program will continue operating as currently.
Positives:
None.Negatives:
Continue to lose revenue.
Potential to lose market share.
Lose opportunity to network with area employers.
Miss the opportunity to become a “one stop shop” for health care services.
CHS employee injury costs will continue to escalate.
Divestiture of COMC
This option considers placing COMC on the marketplace to be sold.
Positives:
Lots of money.
The $$$ can be invested to expand or develop new programs.
Leadership can spend more time focusing on issues closer to “home.”
Improve CHS bottom line (at least in the short term).Negatives:
Lose new revenue stream.
Lose market share.
Loss of prime location.
Have a competitor establish itself in that setting.
Lose identity within the market.
1.2 Mission
Workwell is a customer focused premier industrial occupational medicine program, that uses a team approach to provide quality occupational health, safety and rehabilitation services that addresses a person’s total health–body, mind and spirit–while developing and nurturing partnerships with regional businesses.

1.3 Keys to Success
Workwell’s keys to success are:
- Development and implementation of a successful marketing strategy/plan to employers.
- Recruitment of experienced medical and administrative talent.
- Entering the Occupational Medicine market and building a “brand” name before the competition.
- Commitment to continuously improve the quality of service.
- Demonstrate a financial return on investment.
- Commitment from Senior Management
Organization Summary
Workwell is a non-profit taxable subsidiary of Centroplex Health System. Workwell is committed to providing customized services to meet the occupational health, safety, and rehabilitation needs of area businesses and industries in its target market. Workwell is based on the belief that healthy employees are more productive and efficient employees. For this reason, it provides wellness strategies/programs to businesses . This combines promotion of total health–body, mind and spirit–designed to facilitate positive lifestyle changes of a company’s work force.
2.1 Organization History
Last year Centroplex Occupational Medicine Center (COMC) had 18,050 and 11,085 total procedures and visits respectively. Worker’s Compensation/Occupational Medicine visits accounted for 4,611 visits and a total of 9,116 procedures. This represents 52 percent of total procedures and 42 percent of total visits at COMC during the prior year.
This generated total charges of $298,050 and total payments of $243,110– 82 percent reimbursement. For Prior Year 2 total charges were $337,326 and total payments of $284,264– 84 percent reimbursement. Additionally, the Centroplex Hospital Emergency Department had Worker’s Compensation visits totaling 1,170 during Prior Year 1. It is imperative to understand that this volume has been achieved without any marketing efforts.
Centroplex Occupational Medicine Center
| – |
Prior Year 1 |
|
Number of Visits |
11,085 |
| Total Charges |
$737,552 |
| Collected Income |
$564,692 |
Workers’ Compensation
| – |
Prior Year 2 |
Prior Year 1 |
|
Number of visits |
1,499 |
1,362 |
|
Total Charges |
$157,916 |
$152,588 |
|
Collected Income |
$106,452 |
$100,575 |
Last year there were an additional 1,170 W/C injuries treated at the Centroplex ER. 213, of these W/C injuries, were Centroplex employee injuries and represented a cost of $437,000 to the hospital. (This $$ includes lost wages, training etc…)
Occupational Health
| – |
Prior Year 2 |
Prior Year 1 |
|
Number of Visits |
3,314 |
3249 |
|
Total Charges |
$179,410 |
$145,462 |
|
Collected Income |
$178,172 |
$142,535 |

| Past Performance | |||
| 1996 | 1997 | 1998 | |
| Funding | $673,259 | $642,265 | $555,974 |
| Gross Surplus | $673,259 | $642,265 | $555,974 |
| Gross Surplus % | 100.00% | 100.00% | 100.00% |
| Operating Expenses | $653,060 | $681,477 | $671,888 |
| Collection Period (days) | 111 | 114 | 130 |
| Balance Sheet | |||
| 1996 | 1997 | 1998 | |
| Current Assets | |||
| Cash | $248,602 | $37,533 | $8,437 |
| Accounts Receivable | $153,467 | $148,255 | $148,255 |
| Other Current Assets | $225,214 | $177,600 | $184,531 |
| Total Current Assets | $627,283 | $363,388 | $341,223 |
| Long-term Assets | |||
| Long-term Assets | $75,083 | $223,892 | $120,579 |
| Accumulated Depreciation | $40,941 | $49,156 | $60,760 |
| Total Long-term Assets | $34,142 | $174,736 | $59,819 |
| Total Assets | $661,425 | $538,124 | $401,042 |
| Current Liabilities | |||
| Accounts Payable | $19,083 | $11,028 | $9,036 |
| Current Borrowing | $565,480 | $576,987 | $634,601 |
| Other Current Liabilities (interest free) | $923 | $0 | $0 |
| Total Current Liabilities | $585,486 | $588,015 | $643,637 |
| Long-term Liabilities | $325,170 | $304,574 | $293,480 |
| Total Liabilities | $910,656 | $892,589 | $937,117 |
| Paid-in Capital | $412,000 | $412,000 | $293,480 |
| Retained Earnings | ($733,744) | ($672,730) | ($611,473) |
| Earnings | $72,513 | ($93,735) | ($218,082) |
| Total Capital | ($249,231) | ($354,465) | ($536,075) |
| Total Capital and Liabilities | $661,425 | $538,124 | $401,042 |
| Other Inputs | |||
| Payment Days | 30 | 30 | 30 |
| Funding on Credit | $504,944 | $481,699 | $416,981 |
| Receivables Turnover | 3.29 | 3.25 | 2.81 |
2.2 Locations and Facilities
The Workwell Program is based at the Centroplex Occupational Medicine Center, located at 2202 S.W.S. Young Dr., next to the Killeen Mall.
We provide services 7 days a week 24 hours a day. Our office hours at the Centroplex Occupational Medicine Center are Monday through Friday 8:00 AM to 6:00 PM and Saturday and Sunday from 10:00 AM to 6:00 PM. The Centroplex Hospital Emergency Department provides our services during the off-hours. Workwell will evaluate patient visit hours and will expand operating hours accordingly.
We will gladly offer our Workwell programs at the employer’s work site as long as the minimum employee participation requirements are met. We will also provide numerous classes at the Centroplex Hospital campus through the monthly wellness programs.
Services
Workwell is convinced that the well-being of client/company is imperative to the health of our community. Workwell understands that accidents, illnesses, and sick days directly affect business efficiency, morale and profit. Maintaining healthy employees translates into a more productive work force. Workwell exists to encourage employees to set personal health improvement goals while reinforcing good principles.
Workwell will work with the company’s senior management to develop a wellness strategy that best suits the needs of each individual employer. The wellness strategy will be a continuous effort that combines both health-promotion and exercise-related activities designed to facilitate positive lifestyle changes in members of a company’s work force. Workwell is a multi-faceted program, designed to address the spectrum of services that employers require to take care of their employees. Workwells’ spectrum of services will include, but not be limited to, the following:
- Work Environment Assessment.
- Screening and Testing Services.
- Tailored Physical Evaluation & Ability Assessment Services.
- Patient Tracking and Information System.
- Regulatory Compliance Services.
- On-site Professional Staffing & Consultation Services.
- Employee Assistance Program.
- Health Promotion & Wellness Services.
- Rehabilitation Services.
Our Workwell programs will help companies achieve the following results:
- Reduce employee health care costs.
- Increased productivity.
- Reduced absenteeism.
- Enhanced morale.
- Attract and retain high-quality employees.
- Create a positive Return On Investment (ROI).
3.1 Service Description
Work Environment Assessment:
This is the first step in the Workwell program. This simple questionnaire assesses an employee’s lifestyle habits and medical history to determine which programs will help reach the company’s health goals. It also assesses the readiness of a person to change. (It can be taken on-line or in person; printed versions available in English or Spanish). Once the employees have taken the survey, the employer receives a report summarizing their strengths and risks, as well as their stage of readiness for change to better health. (The online version responds with the individual report within seconds).
Workers’ Compensation & Case Management:
The Workwell Center provides a premier program of care and case management of workers’ compensation injuries. Our proactive approach program utilizes a multiple level system which begins prior to an individual employee’s first day of work. Workers’ Compensation costs and disability costs are driven by lack of early intervention, lack of communication, and poor oversight. Workers’ Compensation claims can be profoundly reduced by early return to work through coordination with the employer to provide immediate temporary assignments. Workwell offers a state-of-the-art facility for the acute management of work injuries. We promote early mobilization through modified duty and excellent communication to allow the employer maximum involvement:
- Easy access, walk-in care clinic.
- Early communication (called at time of patient arrival).
- Post-treatment physician communication.
- Case Management by a Board Certified provider.
- Physician-to-Physician communication for outside referrals.
Screening and Testing Services:
The Workwell center offers a complete spectrum of screening examinations designed to meet the changing needs of industry. Whether mandated by the Occupational Safety and Health Administration (OSHA) or indicated by corporate policy, Workwell can create and provide an examination program specific to the employer needs. We offer low cost screening programs as a first line approach in looking for health problems in the work force. Comprehensive testing services are also available from Workwell. We offer a range of specific tests designed to identify potential problems and arrive at a diagnosis. A partial listing of the screening and testing services available include:
- Pulmonary Function- performed by NIOSH certified technicians using the most accurate spirometry equipment available.
- Audiometry- reviewed by NIOSH certified audiologist in compliance with OSHA hearing conservation standards.
- Cardiac- including EKG and low-risk cardiac stress testing.
- Vision- including visual acuity, peripheral vision and color blindness testing, as well as glaucoma screenings.
- X-rays- performed by registered technicians using the latest equipment and read by a board-certified radiologist.
- Alcohol and drug- sample collections supervised by trained technicians; DOT and non-DOT testing available; Medical Review Officer available.
- Laboratory Services- complete blood count, blood chemistry profile, urinalysis, and other specialty blood work upon need or request.
Tailored Physical Evaluation & Ability Assessment Services:
Complementing the comprehensive screening and testing programs is an array of specialized physical evaluation and ability assessment services. We offer a variety of different examinations, each specifically designed to meet the particular needs of the employer, employee, and the job. A listing of these include:
- Post – Offer (pre-placement).
- Periodic (including medical surveillance).
- DOT.
- FAA.
- Bus Driver.
- Vaccines/Immunizations.
- Respirator Clearance.
- Fitness-For-Duty (evaluation and examination to determine patient’s ability to return to work safely).
- Return-To-Work.
- Disability Evaluation.
Patient Tracking and Information System:
The comprehensive patient tracking and information system will enable us to either call or fax information to the respective employer regarding the medical status of the employee during the initial injury treatment session. This provides the employer with up-to-the-minute information helpful in making accommodations so their company operation can continue with as little interruption as possible. The employer is informed regarding the employee’s diagnosis, current status, recommended treatment plan and any follow-up appointment(s) required. The employer also receives a phone call or fax after each follow-up visit. All records are collected and stored in one place, making them accessible with just one phone call. Each patient signs an authorization to release pertinent records to the employer and the Bureau of Workers’ Compensation. Future confidentiality issues are avoided by this proactive approach, making records and reports available when needed.
Regulatory Compliance Services:
As part of the comprehensive approach to occupational health and safety, Workwell will offer a set of services to guide businesses through federal, state, and local safety and environmental compliance issues. Through a Professional Network, Workwell will be able to provide legal and technical resources in the following areas:
- Asbestos Management.
- OSHA/EPA Regulatory Compliance.
- Hazardous Waste/Materials Management.
- Back Injury Prevention.
- Chemical Right-To-Know Inventory & Data Processing.
- Facility Safety Audits.
- OSHA Citation Defense/Remediation.
- Indoor Air & Industrial Hygiene Studies.
On-site Professional Staffing & Consultation Services:
This is a service provided for larger companies, specifically those who outsource their medical staff. It entails the medical professionals in conjunction with the mobile services van, providing a comprehensive medical clinic right at the employer’s place of business. The services provided are:
- Conduct health screenings and appraisals (i.e. cholesterol, blood pressure, cancer, heart attack risks, stress) to promote healthier lifestyles and identify medical concerns in the early stages.
- Train employee in basic emergency medical skills (first aid, CPR, etc.)
- Active medical surveillance for employees in hazardous jobs and those at risk of medical conditions that develop over time.
- Assistance with policies and procedures for compliance with federal, state and company regulations.
- Walk-through assessments to help evaluate the effectiveness of safety, ergonomics and industrial hygiene programs.
- Implement and manage programs for injury and illness prevention (job modifications, back care education, safety education programs etc.)
Employee Assistance Program:
The EAP service offers an integrated continuum of services for employees and family members having personal problems such as alcohol/substance abuse, emotional, marital, family, career, legal or financial concerns. EAP services are designed to provide employers, employees and their families with confidential and professional resources to address problems that affect their quality of work and quality of life. Following are some of the services provided:
- Immediate 24-hour access to qualified clinicians.
- Face-to-face counseling in off-site offices.
- Substance Abuse Professional Services.
- “Brown Bag” Psycho-educational seminars.
- Articles for internal company newsletter.
- Financial/Debt management consultation and referral.
Health Promotion & Wellness Services:
An employee is a company’s greatest asset. So how can employees stay healthy? The answer is with health & wellness programs through Workwell. We offer a customized package of programs to help employees recognize and overcome health habits.
- Stress Management Classes and Critical Incident debriefing- provides employees with information about stress and how it affects the body, with practical techniques to turn stress into positive energy on the job and at home.
- Smoking Cessation Classes- strives to reduce the desire for tobacco through a combination of behavioral modification, stress management, and nutritional awareness tips.
- Back Care program-a comprehensive look at the principles of preventing back injury. Instruction emphasizes personal responsibility and provides the foundation for back injury prevention and safety in the work place.
- Cancer Screenings- screening tests for the early detection of colo-rectal, prostate, skin, and breast cancer.
- Heart Attack Prevention Program- a comprehensive assessment of an individual’s risk for heart attack that is further enhanced by counseling, education and follow-up to motivate the individual to take action.
- Health Risk Appraisal- a computerized risk factor analysis which pinpoints an employee’s health risks and ways to reduce or eliminate those risks.
- General Health Program- a general program of education and screenings, including total cholesterol, HDL (good) cholesterol, glucose, blood pressure, body fat composition, and nutritional analysis.
- Customized Fitness & Nutritional programs- physician prescribes exercise programs personalized for each employee group or individual. Exercise programs can focus on cardiovascular fitness, muscular fitness, and/or endurance training. Our staff is also available to provide consultation and management services at your company-located exercise facility or gym. Nutrition education programs are provided through the guidance and supervision of a licensed nutritionist who can custom design a healthier eating program for the work force.
Mobile Services:
Our mobile unit is a 36-foot customized Barth van that houses equipment, supplies, materials and staff. The wide variety of services available through our mobile services program fall into two main categories: medical screening/testing/examination services and safety, health promotion & wellness programs. As with all the services available through Workwell, you can select the individual programs that best meet your needs. In addition, many of the offerings can be bundled into a single money-saving package.
All of our health & wellness services are available through our mobile services program or at the Workwell facility and are conducted by our professional staff.
Rehabilitation Services:
Patients who require follow-up rehabilitation services will be referred to the new Centroflex Rehabilitation Center. This state-of-the-art facility is staffed by a Board Certified Physiatrist who will provide our patients with quality acute outpatient care, inclusive of physical therapy and occupational therapy. Some of the treatment includes aquatic therapy, computerized multi-joint , isotonic, and testing.
3.2 Alternative Providers
Workwell’s distinguishing factors are:
- The pioneer Industrial Occupational Medicine Program.
- Sponsored by Centroplex Health System.
- Established network of Primary and Specialty Providers.
- Tailored Wellness Strategies.
Workwell will be Killeen’s pioneer Industrial Medicine program. It will be the first of its kind, providing Killeen and the surrounding service-area employers with the full spectrum of occupational medicine programs. Additionally, being part of Centroplex Health System will enable Workwell to offer its services in conjunction with state-of-the-art ancillary and specialty services, were the need to arise. As part of Centroplex hospital, our patients/clients will belong to a network of providers allowing for prompt scheduling of referrals.
Workwell’s main objective will be to work with client employers to implement an unmatched wellness strategy that will ultimately improve employee productivity while significantly reducing health care costs. Workwell will develop a vested interest in each work force being that an integral component of this service is following up and monitoring each individual employee.
3.3 Printed Collaterals
The business will begin with a brochure establishing the position and describing the services provided. The sales literature will include services offered at the Centroplex Urgent Care Clinic, the Centroplex Emergency Department, Centroflex, Pavilion, Home Care, and through our network of primary care and specialty physicians.
Direct mail pieces are being developed.
Market Analysis Summary
In 1998, U.S. health care costs were over $1 trillion, far more than any other nation in the world. Work place injuries, illnesses, and fatalities resulted in 125 million days of lost work and cost more than $120 billion in 1994. Of that, approximately 40 percent relates to the cost of lost time/work, 40 percent to medical costs and 20 percent to legal and related costs. The service and trade industry have emerged as a major safety and health problem and today account for 47 percent (3.1 million) of all work place injuries and illnesses. The average annual health care cost per person in the United States far exceeds $3,000 of which employers paid 30 percent. In a recent report of the Bureau of Labor Statistics, U.S. Department of Labor, injuries which accounted for the most days lost from work included Carpal tunnel syndrome, hernia, amputation, fracture, sprain/strain, cuts/laceration and chemical burns.
Recent studies indicate returns on investment in wellness programs for various companies ranging from $1.91:1 to $5.78:1. General Electric’s aircraft engines division, for example, saves $1 million per year through its wellness programs. Traveler’s Corporation reported a $3.40 return for every dollar invested in health promotion, yielding total corporate savings of $146 million in benefits costs.
The health of a business is affected by the health of employees. Consider these facts:
- Absenteeism costs businesses in the U.S. $30 billion per year.
- Unhealthy lifestyles account for 40% of U.S. health care costs.
Statistically it has been shown that for every 100 employees:
- 50 have a risk factor of moderate stress.
- 35 are at least 20% overweight.
- 30 smoke.
- 25 have cardiovascular disease or high cholesterol.
- 10 have high blood pressure.
Employees with 4 – 5 health risk factors have four times the medical expenses. Those with six or more have eight times the medical costs.
U.S. Employment/Economic Profile
Important demographic changes are taking place in America that point to the importance of worker productivity in coming decades.
- 19 million new jobs will be created by the year 2006, but there will only be 17 million workers to fill them.
- Service-producing industries (i.e. hotels, advertising, health care etc.) will account for virtually all the job growth. Only construction will add jobs in the goods-producing sector, offsetting declines in manufacturing and mining.
- The Manufacturing industry’s share of total jobs is expected to decline, as a decrease of 350,000 manufacturing jobs is projected.
- An estimated 80 percent of jobs to be filled in the immediate future will require more than a high-school education. Only 74 percent of Americans, however, finish high school, and only 67 percent graduate with adequate skills.
- The number of skilled workers available to fill new jobs is decreasing, meaning that employers are facing more severe competition for labor. Thus, the health and productivity of each employee becomes crucial to a company’s success.
Within the Killeen ZIP codes we have identified 40 major employers with approximately 20,000 total employees. A total of 18 major employers have been identified in the Belton ZIP codes representing 3,390 employees. And, within the Copperas Cove zip codes, 37 major employers have been representing 3,339 employees. Although Workwell will concentrate its initial efforts in the Killeen market, both Belton and Copperas Cove are areas where Workwell should consider expanding its services to. By the end of 2000 it is anticipated that Workwell will expand its service area to cover all employers in Bell, Lampasas and Coryell Counties.
4.1 Market Segmentation
The market for Workwell is not particularly segmented, as potential customers include all Bell, Lampasas and Coryell county employers that offer their employees some type of medical benefits, are experiencing escalating health care costs, and wish to more effectively manage those costs. Workwell, however, segments its services for individual employers. Workwell works with senior management to design and develop personalized health and wellness programs for its employees.
|
– |
1998 Pop |
2003 Pop |
Pop-Armed Forces |
Pop-Labor Force |
Pop-Ages 18-64 |
Pop-Labor Force-Unemployed |
|
Bell |
136,192 |
150,700 |
16,995 |
49,815 |
85,286 |
5,727 |
|
Coryell |
72,625 |
76,971 |
25,543 |
17,698 |
48,532 |
2,054 |
|
Lampasas |
16,082 |
18,769 |
417 |
9,687 |
9,089 |
743 |
|
Total |
224,899 |
246,440 |
42,955 |
77,200 |
142,907 |
8,524 |
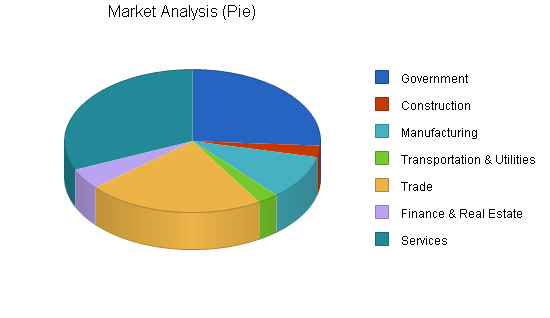
- During 1987 to 1997 this target area gained approximately 23,000 new jobs. Fifty-seven percent of these new jobs (13,000) were gained during the five-year period of 1993 to 1997. The trade, services and government sectors accounted for 12,090, or an astounding ninety-three percent of the new jobs during this period. In 1998, over three-fourths of the area’s employment, or 57,900 jobs, out of an employment total of 77,200, was concentrated in these three sectors.
- Between February 1997 and February 1998, employment in the target area increased by 4,200 jobs, or 4.9 percent, the third highest rate of increase among the state’s 27 metropolitan areas and over half a percent higher than the state average.
- During 1997 the greatest job growth in the target area occurred in the trade and services sectors followed by high growth in the construction, manufacturing and government sectors. In February 1997, the trade sector employed approximately twenty-six percent of the total labor force and accounted for twenty-nine percent, or 1,200 total new jobs. Construction jobs increased by 16.2 percent, or 600 jobs. The manufacturing sector brought an additional 400 new jobs to the area for a 4.2 percent increase.
- The government sector makes up almost on-quarter of the Killeen metro area employment. Fort Hood, large school districts, state prisons, as well as a variety of local, regional, state and federal agencies contribute to government employment. As of February 1995, the active duty population assigned to the base was 45,000, thus making it the largest employer in the state of Texas. Fort Hood has a direct financial impact of $1.8 billion annually to the local economy.
| Market Analysis | |||||||
| 1999 | 2000 | 2001 | 2002 | 2003 | |||
| Potential Customers | Growth | CAGR | |||||
| Government | 2% | 20,875 | 21,293 | 21,719 | 22,153 | 22,596 | 2.00% |
| Construction | 4% | 2,119 | 2,204 | 2,292 | 2,384 | 2,479 | 4.00% |
| Manufacturing | 3% | 8,054 | 8,296 | 8,545 | 8,801 | 9,065 | 3.00% |
| Transportation & Utilities | 1% | 2,140 | 2,161 | 2,183 | 2,205 | 2,227 | 1.00% |
| Trade | 5% | 17,937 | 18,834 | 19,776 | 20,765 | 21,803 | 5.00% |
| Finance & Real Estate | 3% | 3,804 | 3,918 | 4,036 | 4,157 | 4,282 | 3.00% |
| Services | 6% | 25,359 | 26,881 | 28,494 | 30,204 | 32,016 | 6.00% |
| Total | 4.15% | 80,288 | 83,587 | 87,045 | 90,669 | 94,468 | 4.15% |
4.1.1 SWOT Analysis
An analysis of Centroplex Occupational Medicine Center’s strengths, weaknesses, opportunities and threats concluded the following:
Strengths
- Centroplex Health System’s reputation for excellent quality service along with a caring attitude.
- Convenient and easy access location from 190 and Killeen Mall.
- The only occupational medicine center in Killeen.
- Ability to offer 24-hour coverage through affiliation with Centroplex Hospital Emergency Department.
- Ability to customize programs to meet the needs of the client companies.
- Already have the equipment and space required. Only a minimal capital investment is required.
- Ability to deliver services at the work site.
- The Centroplex Health System history of utilizing a holistic approach toward health care delivery.
- The new and improved Centroflex Rehab.
Weaknesses
- High overhead expenses along with a negative cash flow.
- Lack of an automated, controlled and coordinated financial and clinical information management system.
- Lack of any coordination and formalized relationship with Centroplex hospital emergency department.
- No marketing strategy.
- No Leadership Accountability.
- Lack of a consistent pricing schedule and discount policy.
- Poor market penetration.
- Lack of market information.
- Lack of networking/working relationship with referral sources and payers.
- Lack of clear understanding regarding COMC’s role in Centroplex Health System community service efforts.
- Lack of specific expertise/resources.
Opportunities
- Companies have an increasing need for assistance with OSHA compliance issues.
- Companies have an increasing need for assistance with ADA compliance issues.
- Increasing cost of workers’ compensation as well as other health care benefits to employers.
- Increasing need for companies to implement accident prevention (safety) programs.
- Renewed interest among employers for maintaining a healthy, fit workforce.
- Opportunity for Workwell program to manage many of the employee health functions and thus decrease Centroplex Health System workers’ compensation costs.
- Centroplex Health System interest in increasing outpatient activities.
Threats
- Lack of automated information management system.
- Lack of a sales/marketing force.
- Medium sized industrial area.
- Competition from Scott & White.
- War.
4.2 Target Market Segment Strategy
We cannot survive just waiting for the customer to come to us. Instead, we must get better at focusing on the specific market segments whose needs match our offerings. Focusing on targeted segments is the key to our future. We have the components in place to capture and satisfy the identified need.
Therefore, we need to focus our message and our product offerings. We need to develop our message, communicate it, and make it good.
4.2.1 Market Needs
Presently there is no one providing a comprehensive industrial occupational medicine/workers’ compensation program in the service area. This can be considered an untapped segment of services that neither Scott & White nor Centroplex Health System, the two main health care systems in this area, have ventured into.
1998 W/C OTJ Injury – Treatment Location
- Employer Clinic: 1,423(18%) Phy. Office: 1,695(22%) Hosp. ER: 2,785(36%)
- Urgent Care CTR: 1,363(18%) Other: 454(6%)
- 1998 Total OTJ’s: 7,720
MARKET NEED ANALYSIS
|
YEAR |
POP. |
TOTAL LAB. FORCE |
PROJ. OTJ’S (10%) |
W/C @ COMC |
W/C @ CHS E.R.** |
TOTAL |
MKT% W/C @CHS |
|
1998 |
224,899 |
77,200 |
7,720 |
1,362 |
1,170 |
2,532 |
33% |
|
1999 |
229,207 |
80,288 |
8,028 |
2,005 |
1,033 |
3,038 |
37% |
|
2000 |
233,515 |
83,587 |
8,358 |
2,659 |
885 |
3,544 |
43% |
|
2001 |
237,823 |
87,045 |
8,704 |
3,192 |
858 |
4,050 |
47% |
|
2002 |
242,131 |
90,669 |
9,066 |
3,732 |
824 |
4,556 |
50% |
|
2003 |
246,440 |
94,468 |
9,446 |
4,278 |
786 |
5,064 |
53% |
**There is a 15%; 30%; 35%; 40%; and 45% per year reduction in E.R visits and added to COMC visits. This is achieved as the E.R and COMC better coordinate their scope of services. Commitment from senior leadership is crucial in making this happen.
Centroplex Health System as a major employer itself will benefit from the services provided through Workwell. In 1998, the 213 OTJs at Centroplex Health System accounted for over $437,000. By implementing an occupational medicine program and promoting its services to employees, the Centroplex hospital will be able to educate its employees on how to prevent OTJ and thus significantly reduce its own workers’ compensation costs.
4.3 Service Providers Analysis
Buying patterns vary by the size of the employer and according to the internal organization.
Companies with 50 to 100 employees may have health care handled by the owner or a key executive. Often it is the responsibility of the Personnel Administrator as an individual (if that function is internal to the company). Also, Personnel Administration may be outsourced, but benefits may not. Sometimes an independent benefits brokerage firm handles all recommendations.
Larger companies from 200 to 500 employees may have Personnel Departments of several people. They might also employ a brokerage or consultant.
Thus, it is imperative that Workwell have flexible programs and sales and marketing efforts that are targeted to a diverse set of potential buying patterns.
4.3.1 Alternatives and Usage Patterns
Scott and White currently offers an Occupational Medicine program in Temple but it is not considered a strong competitor due to its distance from COMC. Scott and White does pose a threat being that they have clinics in the vicinity of COMC and the Centroplex hospital that could easily duplicate their occupational medicine services currently in Temple. Time is of the essence for developing Workwell.
Strategy and Implementation Summary
By tailoring services and developing customized programs for companies and individual employees, Workwell will develop a reputation for quality and customer service.
Workwell services will be directly marketed to employers via telephone calls and on-site consultations. The strategy is to target all industries within the services area, with a primary focus upon the government and service industries, which are the major components in the market. Once Workwell becomes a recognized program, we will rely more on reputation and word of mouth and less on direct marketing.
5.1 Marketing Strategy
Workwell will begin by targeting the large-to-medium size–500+– businesses within a 15 mile radius of COMC. We have 11 businesses, encompassing 83 percent of the total work force in Killeen, within 15 miles of COMC. This will allow us to receive the greatest return on our marketing efforts/dollars. This does not mean that we will not aggressively target the small and more distant employers. There is significant amount of services to be provided to this segment and we will cater to their needs.
The first task is to convince senior executives of the benefits and needs of occupational health services. This will be accomplished by aggressively pursuing interaction and relationships with business professionals who would profit from using this service. Once a strong image is established in the Killeen market, Workwell will use similar strategies to market its services to corporations in Copperas Cove.
5.1.1 Pricing Strategy
Following is a price list for the most commonly performed procedures at Workwell:
| Physicals |
Pricing |
|
Physical |
$45 |
|
DOT Physical |
$50 |
|
Fit for Duty |
$45 |
| Laboratory |
– |
|
Drug Screen DOT |
$55 |
|
Drug Screen |
$45 |
|
Drug Screen Collection |
$20 |
|
Alcohol BAT |
$25 |
|
Blood Alcohol |
$50 |
|
Blood Lead/ZPP |
$55 |
|
Blood Lead |
$30 |
|
ZPP |
$40 |
|
Chem 24 |
$25 |
|
CBC W/DIFF |
$16 |
| Screenings |
– |
|
Chest X-Ray |
$80 |
|
Back X-Ray |
$95 |
|
Audiometry |
$30 |
|
Spirometry |
$35 |
| Immunization |
– |
|
DT (Tetanus Shot) |
$15 |
|
Hepatitis B Vaccination |
$70 |
|
PPD/TB |
$15 |
|
Flu Shot |
$15 |
Wellness Programs
Pricing varies according to topics and class size. Some programs may be offered free of charge.
Injury Treatment
Pricing varies according to injury severity and required medical services.
5.1.2 Promotion Strategy
Following initial promotional activity through advertisements in newspapers, magazines, television and radio, Workwell will significantly reduce its promotional efforts in the hope that word-of-mouth will attract potential customers. Promotional activity will still be utilized through these media outlets, but only minimally.
We recognize that a comprehensive marketing strategy is a critical component in the success of this program. To achieve this, a full-time marketing coordinator will be charged with the responsibility of selling the program to all employers in the area.
Advertising and Promotional Options
Newspaper Display Advertising
Suggested Budget: $1,000
This will cover production and insertion costs for a 1/2 page, black and white ad to run three consecutive times in the Killeen Herald.
Quarterly Newsletter
Suggested Budget: $1,500
This will cover costs for writing, producing, and printing a two color, 2 to 4 page newsletter four times a year.
Quarterly Wellness Education Seminars
Suggested Budget: $1,000
On a quarterly basis area Employee Benefit Coordinators will be invited to attend the health promotion and wellness seminars to learn more about back care programs, dealing with stress, smoking cessation, etc. These will be held at the Centroplex Hospital. Lunch will be provided.
Direct Mail Campaign
Suggested Budget: $5,000
This will be directed towards recruiting new referral sources – program based on contacting 10 people per month for 12 months at a cost of $25 to $50 per mail piece.
Public Relations
Suggested Budget: $???
A public relations campaign could encompass community newspaper articles, articles in internal hospital publications, and articles in area and state-wide professional journals. The campaign could also include the production of a year-end “annual report” document or letter that could be sent to all referral sources, employers, etc.
Quality Aspect
No direct costs.
A patient satisfaction survey should be utilized to address questions relating to the ability of the program to meet the needs of the patient, referral person, and others, as well as gauge the patient and referral person’s level of expectation, areas for improvement, new program development, etc.
5.1.3 Marketing Programs
Workwell’s most important marketing strategy is establishing a “one-on-one” relationship with the person in charge of employee health and benefits of each employer in our service area. This is intended to serve as a venue by which to communicate to the employers about our current and new services available to them through the Workwell program. Achievement will be measured by the number of employer contracts that are active on a monthly basis. Currently there are 60 current accounts.The goal is to double this number of accounts in a one-year time frame.
Another key marketing program is to revamp the quarterly health & wellness seminars. We will invite the Employee Health and Benefits Coordinators to attend these seminars. This will enable us to offer workshops on such topics as stress management, smoking cessation, back-care program, etc. while at the same time receive feedback from our clients on what they like and dislike about the Workwell program.
Additional marketing tactics are listed below:
- Advertising through the local chamber of commerce.
- Mass mailings to area companies’ human resources executives and safety engineers.
- On-site educational presentations by the marketing coordinator and accompanied by a physician.
The key is to constantly communicate with our patients/clients to inform them who we are and what we offer.
5.2 Fundraising Strategy
The following table and chart give a run-down on forecasted sales. Total revenue is projected to grow 30 percent by 2001.
Note: It is estimated that irregularities in coding and billing cost COMC approximately $150,000 in 1998.


| Funding Forecast | |||
| 1999 | 2000 | 2001 | |
| Funding | |||
| Employment Physicals | $427,021 | $458,344 | $486,063 |
| Drug Screenings | $40,965 | $49,140 | $62,690 |
| X-ray | $104,360 | $159,610 | $168,022 |
| Laboratory | $161,912 | $184,466 | $208,650 |
| Spirometry | $1,093 | $1,330 | $1,995 |
| Audiometry | $4,394 | $4,830 | $5,340 |
| Immunizations | $56,639 | $78,120 | $91,870 |
| BAT (Breath Alcohol Test) | $4,963 | $5,250 | $6,420 |
| Other | $31,022 | $33,284 | $35,728 |
| Total Funding | $832,369 | $974,374 | $1,066,778 |
| Direct Cost of Funding | 1999 | 2000 | 2001 |
| Employment Physicals | $0 | $0 | $0 |
| Drug Screenings | $0 | $0 | $0 |
| X-ray | $0 | $0 | $0 |
| Laboratory | $0 | $0 | $0 |
| Spirometry | $0 | $0 | $0 |
| Audiometry | $0 | $0 | $0 |
| Immunizations | $0 | $0 | $0 |
| BAT (Breath Alcohol Test) | $0 | $0 | $0 |
| Other | $0 | $0 | $0 |
| Subtotal Cost of Funding | $0 | $0 | $0 |
5.3 Milestones
The following table shows the important milestones for Workwell.
| Milestones | |||||
| Milestone | Start Date | End Date | Budget | Manager | Department |
| Complete Business Plan | 5/11/1999 | 5/11/1999 | $0 | JV | Intern |
| “Go” or “No Go” Decision | 5/21/1999 | 5/21/1999 | $0 | KF, JH | Administration |
| Identify & Assign Accountability to Director | 6/1/1999 | 6/1/1999 | $0 | KF,JH,SJ,BC | Exec. Council |
| “In-house” or “Contract” Implementation | 6/8/1999 | 6/8/1999 | $0 | KF,JH,SJ,BC | Exec. Council |
| Research Consulting Firms | 6/15/1999 | 6/15/1999 | $0 | JV | Intern |
| Select Consulting Firm | 6/15/1999 | 6/15/1999 | $0 | KF,JH,SJ,BC | Exec. Council |
| Sign Contract Agreement | 6/16/1999 | 6/16/1999 | $0 | KF | Administration |
| Start Program Implementation | 7/1/1999 | 7/1/1999 | $0 | Director, JV | Department |
| Complete Program Implementation | 8/31/1999 | 8/31/1999 | $0 | Director, JV | Department |
| Ongoing Commitment from Leadership | 8/31/1999 | 8/31/1999 | $0 | MHS Leadership | Administration |
| Other | 1/1/1999 | 1/1/1999 | $0 | ABC | Department |
| Totals | $0 | ||||
Management Summary
The following table summarizes our personnel expenditures for the first three years, with 3 percent compensation increases and 20 percent benefits. These figures are solely for the office/clerical staff.
The medical professionals will be compensated as follows:
- The provider contract is currently being developed but in essence these are the stipulations. The physician will be compensated on a 80:17 productivity basis with 3% going to a “cash pool.” The physician will be compensated 17% and be eligible to receive the additional 3%, if the quarterly chart audit shows a 90% accuracy achieved in the coding process.
- $33,276 wage for physician coverage. The coverage will be contracted to Scott & White or Darnell Medical Residents.
| Personnel Plan | |||
| 1999 | 2000 | 2001 | |
| Marketing Coordinator (1) | $12,498 | $25,745 | $26,517 |
| Receptionist/Administrative/Clerical (1) | $18,156 | $18,700 | $19,261 |
| Nurse Aid (1) | $15,600 | $16,068 | $16,568 |
| Rad/Lab Tech (2) | $48,000 | $49,440 | $50,923 |
| LPNS (2) | $45,864 | $47,239 | $48,656 |
| Total People | 10 | 10 | 10 |
| Total Payroll | $140,118 | $157,192 | $161,925 |
Financial Plan
The following sections outline the financial plan for Workwell.
7.1 Break-even Analysis
The following table and chart summarize our break-even analysis.

| Break-even Analysis | |
| Monthly Revenue Break-even | $45,465 |
| Assumptions: | |
| Average Percent Variable Cost | 0% |
| Estimated Monthly Fixed Cost | $45,465 |
7.2 Important Assumptions
The financial plan depends on important assumptions, most of which are shown in the following table as annual assumptions. From the beginning, it has been recognized that collection days days are critical, but not a factor that is influenced easily. This is an element that needs to be recognized and dealt with accordingly. Interest rates, tax rates, and personnel burden are based on conservative assumptions.
| General Assumptions | |||
| 1999 | 2000 | 2001 | |
| Plan Month | 1 | 2 | 3 |
| Current Interest Rate | 10.00% | 10.00% | 10.00% |
| Long-term Interest Rate | 10.00% | 10.00% | 10.00% |
| Tax Rate | 25.00% | 25.00% | 25.42% |
| Other | 0 | 0 | 0 |
7.3 Key Financial Indicators
The following chart shows the planned benchmarks for Workwell.

7.4 Projected Surplus or Deficit
Our projected surplus and deficit is shown on the following table, with net surpus increasing over the next three years. This is achievable through a reorganization of the current personnel structure, leadership accountability, increase in productivity (from 3.2 to 4.3 visits/hr), accurate coding and billing process, formal marketing effort, and introduction of new products/services.


| Surplus and Deficit | |||
| 1999 | 2000 | 2001 | |
| Funding | $832,369 | $974,374 | $1,066,778 |
| Direct Cost | $0 | $0 | $0 |
| Other | $0 | $0 | $0 |
| Total Direct Cost | $0 | $0 | $0 |
| Gross Surplus | $832,369 | $974,374 | $1,066,778 |
| Gross Surplus % | 100.00% | 100.00% | 100.00% |
| Expenses | |||
| Payroll | $140,118 | $157,192 | $161,925 |
| Sales and Marketing and Other Expenses | $293,748 | $265,075 | $273,550 |
| Depreciation | $11,340 | $10,940 | $10,540 |
| Utilities | $12,348 | $12,700 | $13,050 |
| Rent | $60,000 | $60,000 | $60,000 |
| Payroll Taxes | $28,024 | $31,438 | $32,385 |
| Other | $0 | $0 | $0 |
| Total Operating Expenses | $545,578 | $537,345 | $551,450 |
| Surplus Before Interest and Taxes | $286,791 | $437,029 | $515,328 |
| EBITDA | $298,131 | $447,969 | $525,868 |
| Interest Expense | $80,169 | $57,807 | $34,473 |
| Taxes Incurred | $51,656 | $94,805 | $122,217 |
| Net Surplus | $154,967 | $284,416 | $358,638 |
| Net Surplus/Funding | 18.62% | 29.19% | 33.62% |
7.5 Projected Cash Flow
The following chart and table are the projected cash flow figures for Workwell.

| Pro Forma Cash Flow | |||
| 1999 | 2000 | 2001 | |
| Cash Received | |||
| Cash from Operations | |||
| Cash Funding | $208,092 | $243,594 | $266,695 |
| Cash from Receivables | $661,326 | $711,808 | $787,738 |
| Subtotal Cash from Operations | $869,419 | $955,402 | $1,054,433 |
| Additional Cash Received | |||
| Sales Tax, VAT, HST/GST Received | $0 | $0 | $0 |
| New Current Borrowing | $0 | $0 | $0 |
| New Other Liabilities (interest-free) | $0 | $0 | $0 |
| New Long-term Liabilities | $0 | $0 | $0 |
| Sales of Other Current Assets | $0 | $0 | $0 |
| Sales of Long-term Assets | $0 | $0 | $0 |
| New Investment Received | $0 | $0 | $0 |
| Subtotal Cash Received | $869,419 | $955,402 | $1,054,433 |
| Expenditures | 1999 | 2000 | 2001 |
| Expenditures from Operations | |||
| Cash Spending | $140,118 | $157,192 | $161,925 |
| Bill Payments | $493,932 | $519,984 | $534,537 |
| Subtotal Spent on Operations | $634,050 | $677,176 | $696,462 |
| Additional Cash Spent | |||
| Sales Tax, VAT, HST/GST Paid Out | $0 | $0 | $0 |
| Principal Repayment of Current Borrowing | $204,000 | $204,000 | $204,000 |
| Other Liabilities Principal Repayment | $0 | $0 | $0 |
| Long-term Liabilities Principal Repayment | $29,340 | $29,340 | $29,340 |
| Purchase Other Current Assets | $0 | $0 | $0 |
| Purchase Long-term Assets | $0 | $0 | $0 |
| Dividends | $0 | $0 | $0 |
| Subtotal Cash Spent | $867,390 | $910,516 | $929,802 |
| Net Cash Flow | $2,028 | $44,886 | $124,631 |
| Cash Balance | $10,465 | $55,351 | $179,982 |
7.6 Projected Balance Sheet
The projected balance sheet is included below.
| Pro Forma Balance Sheet | |||
| 1999 | 2000 | 2001 | |
| Assets | |||
| Current Assets | |||
| Cash | $10,465 | $55,351 | $179,982 |
| Accounts Receivable | $111,205 | $130,178 | $142,523 |
| Other Current Assets | $184,531 | $184,531 | $184,531 |
| Total Current Assets | $306,202 | $370,060 | $507,036 |
| Long-term Assets | |||
| Long-term Assets | $120,579 | $120,579 | $120,579 |
| Accumulated Depreciation | $72,100 | $83,040 | $93,580 |
| Total Long-term Assets | $48,479 | $37,539 | $26,999 |
| Total Assets | $354,681 | $407,599 | $534,035 |
| Liabilities and Capital | 1999 | 2000 | 2001 |
| Current Liabilities | |||
| Accounts Payable | $41,048 | $42,890 | $44,028 |
| Current Borrowing | $430,601 | $226,601 | $22,601 |
| Other Current Liabilities | $0 | $0 | $0 |
| Subtotal Current Liabilities | $471,649 | $269,491 | $66,629 |
| Long-term Liabilities | $264,140 | $234,800 | $205,460 |
| Total Liabilities | $735,789 | $504,291 | $272,089 |
| Paid-in Capital | $293,480 | $293,480 | $293,480 |
| Accumulated Surplus/Deficit | ($829,555) | ($674,588) | ($390,172) |
| Surplus/Deficit | $154,967 | $284,416 | $358,638 |
| Total Capital | ($381,108) | ($96,692) | $261,946 |
| Total Liabilities and Capital | $354,681 | $407,599 | $534,035 |
| Net Worth | ($381,108) | ($96,692) | $261,946 |
7.7 Business Ratios
The following table outlines some of the more important ratios from the {Health and Allied Services, nec} industry. The final column, Industry Profile, details specific ratios based on the industry as it is classified by the Standard Industry Classification (SIC) code, 8099.
| Ratio Analysis | ||||
| 1999 | 2000 | 2001 | Industry Profile | |
| Funding Growth | 49.71% | 17.06% | 9.48% | 6.10% |
| Percent of Total Assets | ||||
| Accounts Receivable | 31.35% | 31.94% | 26.69% | 26.30% |
| Other Current Assets | 52.03% | 45.27% | 34.55% | 51.30% |
| Total Current Assets | 86.33% | 90.79% | 94.94% | 78.90% |
| Long-term Assets | 13.67% | 9.21% | 5.06% | 21.10% |
| Total Assets | 100.00% | 100.00% | 100.00% | 100.00% |
| Current Liabilities | 132.98% | 66.12% | 12.48% | 44.70% |
| Long-term Liabilities | 74.47% | 57.61% | 38.47% | 14.60% |
| Total Liabilities | 207.45% | 123.72% | 50.95% | 59.30% |
| Net Worth | -107.45% | -23.72% | 49.05% | 40.70% |
| Percent of Funding | ||||
| Funding | 100.00% | 100.00% | 100.00% | 100.00% |
| Gross Surplus | 100.00% | 100.00% | 100.00% | 0.00% |
| Selling, General & Administrative Expenses | 82.52% | 73.50% | 70.29% | 79.90% |
| Advertising Expenses | 20.02% | 13.56% | 12.76% | 1.30% |
| Surplus Before Interest and Taxes | 34.45% | 44.85% | 48.31% | 3.50% |
| Main Ratios | ||||
| Current | 0.65 | 1.37 | 7.61 | 1.46 |
| Quick | 0.65 | 1.37 | 7.61 | 1.22 |
| Total Debt to Total Assets | 207.45% | 123.72% | 50.95% | 59.30% |
| Pre-tax Return on Net Worth | -54.22% | -392.20% | 183.57% | 4.40% |
| Pre-tax Return on Assets | 58.26% | 93.04% | 90.04% | 10.80% |
| Additional Ratios | 1999 | 2000 | 2001 | |
| Net Surplus Margin | 18.62% | 29.19% | 33.62% | n.a |
| Return on Equity | 0.00% | 0.00% | 136.91% | n.a |
| Activity Ratios | ||||
| Accounts Receivable Turnover | 5.61 | 5.61 | 5.61 | n.a |
| Collection Days | 61 | 60 | 62 | n.a |
| Accounts Payable Turnover | 12.81 | 12.17 | 12.17 | n.a |
| Payment Days | 28 | 29 | 30 | n.a |
| Total Asset Turnover | 2.35 | 2.39 | 2.00 | n.a |
| Debt Ratios | ||||
| Debt to Net Worth | 0.00 | 0.00 | 1.04 | n.a |
| Current Liab. to Liab. | 0.64 | 0.53 | 0.24 | n.a |
| Liquidity Ratios | ||||
| Net Working Capital | ($165,447) | $100,569 | $440,407 | n.a |
| Interest Coverage | 3.58 | 7.56 | 14.95 | n.a |
| Additional Ratios | ||||
| Assets to Funding | 0.43 | 0.42 | 0.50 | n.a |
| Current Debt/Total Assets | 133% | 66% | 12% | n.a |
| Acid Test | 0.41 | 0.89 | 5.47 | n.a |
| Funding/Net Worth | 0.00 | 0.00 | 4.07 | n.a |
| Dividend Payout | 0.00 | 0.00 | 0.00 | n.a |
Appendix
| Funding Forecast | |||||||||||||
| Jan | Feb | Mar | Apr | May | Jun | Jul | Aug | Sep | Oct | Nov | Dec | ||
| Funding | |||||||||||||
| Employment Physicals | 0% | $34,861 | $38,069 | $45,071 | $34,341 | $26,803 | $36,592 | $36,492 | $35,592 | $33,592 | $31,424 | $36,592 | $37,592 |
| Drug Screenings | 0% | $2,318 | $1,540 | $2,202 | $2,496 | $3,301 | $4,197 | $4,315 | $4,591 | $4,489 | $3,843 | $3,897 | $3,776 |
| X-ray | 0% | $6,483 | $7,013 | $8,123 | $11,377 | $8,218 | $8,711 | $8,910 | $7,171 | $9,218 | $8,816 | $10,010 | $10,310 |
| Laboratory | 0% | $8,911 | $11,593 | $13,482 | $12,038 | $13,511 | $15,956 | $14,299 | $13,071 | $14,753 | $13,613 | $14,962 | $15,723 |
| Spirometry | 0% | $0 | $25 | $343 | $35 | $80 | $87 | $92 | $83 | $73 | $88 | $95 | $92 |
| Audiometry | 0% | $344 | $312 | $352 | $354 | $345 | $394 | $338 | $402 | $381 | $372 | $393 | $407 |
| Immunizations | 0% | $3,017 | $4,657 | $4,851 | $2,042 | $6,146 | $4,743 | $5,046 | $4,146 | $4,129 | $5,146 | $6,449 | $6,267 |
| BAT (Breath Alcohol Test) | 0% | $300 | $275 | $400 | $200 | $425 | $435 | $390 | $494 | $487 | $584 | $475 | $498 |
| Other | 0% | $1,968 | $939 | $4,596 | $7,522 | $3,542 | $1,970 | $2,523 | $1,569 | $1,649 | $1,523 | $1,678 | $1,543 |
| Total Funding | $58,202 | $64,423 | $79,420 | $70,405 | $62,371 | $73,085 | $72,405 | $67,119 | $68,771 | $65,409 | $74,551 | $76,208 | |
| Direct Cost of Funding | Jan | Feb | Mar | Apr | May | Jun | Jul | Aug | Sep | Oct | Nov | Dec | |
| Employment Physicals | 0% | $0 | $0 | $0 | $0 | $0 | $0 | $0 | $0 | $0 | $0 | $0 | $0 |
| Drug Screenings | 0% | $0 | $0 | $0 | $0 | $0 | $0 | $0 | $0 | $0 | $0 | $0 | $0 |
| X-ray | 0% | $0 | $0 | $0 | $0 | $0 | $0 | $0 | $0 | $0 | $0 | $0 | $0 |
| Laboratory | 0% | $0 | $0 | $0 | $0 | $0 | $0 | $0 | $0 | $0 | $0 | $0 | $0 |
| Spirometry | 0% | $0 | $0 | $0 | $0 | $0 | $0 | $0 | $0 | $0 | $0 | $0 | $0 |
| Audiometry | 0% | $0 | $0 | $0 | $0 | $0 | $0 | $0 | $0 | $0 | $0 | $0 | $0 |
| Immunizations | 0% | $0 | $0 | $0 | $0 | $0 | $0 | $0 | $0 | $0 | $0 | $0 | $0 |
| BAT (Breath Alcohol Test) | 0% | $0 | $0 | $0 | $0 | $0 | $0 | $0 | $0 | $0 | $0 | $0 | $0 |
| Other | $0 | $0 | $0 | $0 | $0 | $0 | $0 | $0 | $0 | $0 | $0 | $0 | |
| Subtotal Cost of Funding | $0 | $0 | $0 | $0 | $0 | $0 | $0 | $0 | $0 | $0 | $0 | $0 | |
| Personnel Plan | |||||||||||||
| Jan | Feb | Mar | Apr | May | Jun | Jul | Aug | Sep | Oct | Nov | Dec | ||
| Marketing Coordinator (1) | 0% | $0 | $0 | $0 | $0 | $0 | $0 | $2,083 | $2,083 | $2,083 | $2,083 | $2,083 | $2,083 |
| Receptionist/Administrative/Clerical (1) | 0% | $1,513 | $1,513 | $1,513 | $1,513 | $1,513 | $1,513 | $1,513 | $1,513 | $1,513 | $1,513 | $1,513 | $1,513 |
| Nurse Aid (1) | 0% | $1,300 | $1,300 | $1,300 | $1,300 | $1,300 | $1,300 | $1,300 | $1,300 | $1,300 | $1,300 | $1,300 | $1,300 |
| Rad/Lab Tech (2) | 0% | $4,000 | $4,000 | $4,000 | $4,000 | $4,000 | $4,000 | $4,000 | $4,000 | $4,000 | $4,000 | $4,000 | $4,000 |
| LPNS (2) | 0% | $3,822 | $3,822 | $3,822 | $3,822 | $3,822 | $3,822 | $3,822 | $3,822 | $3,822 | $3,822 | $3,822 | $3,822 |
| Total People | 10 | 10 | 10 | 10 | 10 | 10 | 10 | 10 | 10 | 10 | 10 | 10 | |
| Total Payroll | $10,635 | $10,635 | $10,635 | $10,635 | $10,635 | $10,635 | $12,718 | $12,718 | $12,718 | $12,718 | $12,718 | $12,718 | |
| General Assumptions | |||||||||||||
| Jan | Feb | Mar | Apr | May | Jun | Jul | Aug | Sep | Oct | Nov | Dec | ||
| Plan Month | 1 | 2 | 3 | 4 | 5 | 6 | 7 | 8 | 9 | 10 | 11 | 12 | |
| Current Interest Rate | 10.00% | 10.00% | 10.00% | 10.00% | 10.00% | 10.00% | 10.00% | 10.00% | 10.00% | 10.00% | 10.00% | 10.00% | |
| Long-term Interest Rate | 10.00% | 10.00% | 10.00% | 10.00% | 10.00% | 10.00% | 10.00% | 10.00% | 10.00% | 10.00% | 10.00% | 10.00% | |
| Tax Rate | 25.00% | 25.00% | 25.00% | 25.00% | 25.00% | 25.00% | 25.00% | 25.00% | 25.00% | 25.00% | 25.00% | 25.00% | |
| Other | 0 | 0 | 0 | 0 | 0 | 0 | 0 | 0 | 0 | 0 | 0 | 0 | |
| Surplus and Deficit | |||||||||||||
| Jan | Feb | Mar | Apr | May | Jun | Jul | Aug | Sep | Oct | Nov | Dec | ||
| Funding | $58,202 | $64,423 | $79,420 | $70,405 | $62,371 | $73,085 | $72,405 | $67,119 | $68,771 | $65,409 | $74,551 | $76,208 | |
| Direct Cost | $0 | $0 | $0 | $0 | $0 | $0 | $0 | $0 | $0 | $0 | $0 | $0 | |
| Other | $0 | $0 | $0 | $0 | $0 | $0 | $0 | $0 | $0 | $0 | $0 | $0 | |
| Total Direct Cost | $0 | $0 | $0 | $0 | $0 | $0 | $0 | $0 | $0 | $0 | $0 | $0 | |
| Gross Surplus | $58,202 | $64,423 | $79,420 | $70,405 | $62,371 | $73,085 | $72,405 | $67,119 | $68,771 | $65,409 | $74,551 | $76,208 | |
| Gross Surplus % | 100.00% | 100.00% | 100.00% | 100.00% | 100.00% | 100.00% | 100.00% | 100.00% | 100.00% | 100.00% | 100.00% | 100.00% | |
| Expenses | |||||||||||||
| Payroll | $10,635 | $10,635 | $10,635 | $10,635 | $10,635 | $10,635 | $12,718 | $12,718 | $12,718 | $12,718 | $12,718 | $12,718 | |
| Sales and Marketing and Other Expenses | $27,551 | $27,551 | $27,551 | $27,551 | $27,551 | $27,551 | $21,407 | $21,407 | $21,407 | $21,407 | $21,407 | $21,407 | |
| Depreciation | $945 | $945 | $945 | $945 | $945 | $945 | $945 | $945 | $945 | $945 | $945 | $945 | |
| Utilities | $1,029 | $1,029 | $1,029 | $1,029 | $1,029 | $1,029 | $1,029 | $1,029 | $1,029 | $1,029 | $1,029 | $1,029 | |
| Rent | $5,000 | $5,000 | $5,000 | $5,000 | $5,000 | $5,000 | $5,000 | $5,000 | $5,000 | $5,000 | $5,000 | $5,000 | |
| Payroll Taxes | 20% | $2,127 | $2,127 | $2,127 | $2,127 | $2,127 | $2,127 | $2,544 | $2,544 | $2,544 | $2,544 | $2,544 | $2,544 |
| Other | $0 | $0 | $0 | $0 | $0 | $0 | $0 | $0 | $0 | $0 | $0 | $0 | |
| Total Operating Expenses | $47,287 | $47,287 | $47,287 | $47,287 | $47,287 | $47,287 | $43,643 | $43,643 | $43,643 | $43,643 | $43,643 | $43,643 | |
| Surplus Before Interest and Taxes | $10,915 | $17,136 | $32,133 | $23,118 | $15,084 | $25,798 | $28,762 | $23,476 | $25,128 | $21,766 | $30,908 | $32,565 | |
| EBITDA | $11,860 | $18,081 | $33,078 | $24,063 | $16,029 | $26,743 | $29,707 | $24,421 | $26,073 | $22,711 | $31,853 | $33,510 | |
| Interest Expense | $7,572 | $7,410 | $7,248 | $7,086 | $6,924 | $6,762 | $6,600 | $6,438 | $6,276 | $6,114 | $5,952 | $5,790 | |
| Taxes Incurred | $836 | $2,432 | $6,221 | $4,008 | $2,040 | $4,759 | $5,541 | $4,260 | $4,713 | $3,913 | $6,239 | $6,694 | |
| Net Surplus | $2,507 | $7,295 | $18,664 | $12,024 | $6,120 | $14,277 | $16,622 | $12,779 | $14,140 | $11,740 | $18,718 | $20,082 | |
| Net Surplus/Funding | 4.31% | 11.32% | 23.50% | 17.08% | 9.81% | 19.54% | 22.96% | 19.04% | 20.56% | 17.95% | 25.11% | 26.35% | |
| Pro Forma Cash Flow | |||||||||||||
| Jan | Feb | Mar | Apr | May | Jun | Jul | Aug | Sep | Oct | Nov | Dec | ||
| Cash Received | |||||||||||||
| Cash from Operations | |||||||||||||
| Cash Funding | $14,551 | $16,106 | $19,855 | $17,601 | $15,593 | $18,271 | $18,101 | $16,780 | $17,193 | $16,352 | $18,638 | $19,052 | |
| Cash from Receivables | $74,128 | $75,583 | $43,807 | $48,692 | $59,340 | $52,603 | $47,046 | $54,797 | $54,172 | $50,381 | $51,494 | $49,285 | |
| Subtotal Cash from Operations | $88,678 | $91,688 | $63,662 | $66,293 | $74,932 | $70,874 | $65,147 | $71,577 | $71,364 | $66,733 | $70,132 | $68,337 | |
| Additional Cash Received | |||||||||||||
| Sales Tax, VAT, HST/GST Received | 0.00% | $0 | $0 | $0 | $0 | $0 | $0 | $0 | $0 | $0 | $0 | $0 | $0 |
| New Current Borrowing | $0 | $0 | $0 | $0 | $0 | $0 | $0 | $0 | $0 | $0 | $0 | $0 | |
| New Other Liabilities (interest-free) | $0 | $0 | $0 | $0 | $0 | $0 | $0 | $0 | $0 | $0 | $0 | $0 | |
| New Long-term Liabilities | $0 | $0 | $0 | $0 | $0 | $0 | $0 | $0 | $0 | $0 | $0 | $0 | |
| Sales of Other Current Assets | $0 | $0 | $0 | $0 | $0 | $0 | $0 | $0 | $0 | $0 | $0 | $0 | |
| Sales of Long-term Assets | $0 | $0 | $0 | $0 | $0 | $0 | $0 | $0 | $0 | $0 | $0 | $0 | |
| New Investment Received | $0 | $0 | $0 | $0 | $0 | $0 | $0 | $0 | $0 | $0 | $0 | $0 | |
| Subtotal Cash Received | $88,678 | $91,688 | $63,662 | $66,293 | $74,932 | $70,874 | $65,147 | $71,577 | $71,364 | $66,733 | $70,132 | $68,337 | |
| Expenditures | Jan | Feb | Mar | Apr | May | Jun | Jul | Aug | Sep | Oct | Nov | Dec | |
| Expenditures from Operations | |||||||||||||
| Cash Spending | $10,635 | $10,635 | $10,635 | $10,635 | $10,635 | $10,635 | $12,718 | $12,718 | $12,718 | $12,718 | $12,718 | $12,718 | |
| Bill Payments | $10,506 | $44,163 | $45,669 | $49,097 | $46,730 | $44,756 | $47,058 | $42,072 | $40,687 | $40,936 | $40,079 | $42,180 | |
| Subtotal Spent on Operations | $21,141 | $54,798 | $56,304 | $59,732 | $57,365 | $55,391 | $59,776 | $54,790 | $53,405 | $53,654 | $52,797 | $54,898 | |
| Additional Cash Spent | |||||||||||||
| Sales Tax, VAT, HST/GST Paid Out | $0 | $0 | $0 | $0 | $0 | $0 | $0 | $0 | $0 | $0 | $0 | $0 | |
| Principal Repayment of Current Borrowing | $17,000 | $17,000 | $17,000 | $17,000 | $17,000 | $17,000 | $17,000 | $17,000 | $17,000 | $17,000 | $17,000 | $17,000 | |
| Other Liabilities Principal Repayment | $0 | $0 | $0 | $0 | $0 | $0 | $0 | $0 | $0 | $0 | $0 | $0 | |
| Long-term Liabilities Principal Repayment | $2,445 | $2,445 | $2,445 | $2,445 | $2,445 | $2,445 | $2,445 | $2,445 | $2,445 | $2,445 | $2,445 | $2,445 | |
| Purchase Other Current Assets | $0 | $0 | $0 | $0 | $0 | $0 | $0 | $0 | $0 | $0 | $0 | $0 | |
| Purchase Long-term Assets | $0 | $0 | $0 | $0 | $0 | $0 | $0 | $0 | $0 | $0 | $0 | $0 | |
| Dividends | $0 | $0 | $0 | $0 | $0 | $0 | $0 | $0 | $0 | $0 | $0 | $0 | |
| Subtotal Cash Spent | $40,586 | $74,243 | $75,749 | $79,177 | $76,810 | $74,836 | $79,221 | $74,235 | $72,850 | $73,099 | $72,242 | $74,343 | |
| Net Cash Flow | $48,092 | $17,446 | ($12,087) | ($12,884) | ($1,878) | ($3,962) | ($14,073) | ($2,658) | ($1,485) | ($6,367) | ($2,110) | ($6,006) | |
| Cash Balance | $56,529 | $73,974 | $61,887 | $49,003 | $47,126 | $43,164 | $29,091 | $26,432 | $24,947 | $18,580 | $16,471 | $10,465 | |
| Pro Forma Balance Sheet | |||||||||||||
| Jan | Feb | Mar | Apr | May | Jun | Jul | Aug | Sep | Oct | Nov | Dec | ||
| Assets | Starting Balances | ||||||||||||
| Current Assets | |||||||||||||
| Cash | $8,437 | $56,529 | $73,974 | $61,887 | $49,003 | $47,126 | $43,164 | $29,091 | $26,432 | $24,947 | $18,580 | $16,471 | $10,465 |
| Accounts Receivable | $148,255 | $117,779 | $90,514 | $106,272 | $110,383 | $97,822 | $100,033 | $107,290 | $102,833 | $100,240 | $98,916 | $103,335 | $111,205 |
| Other Current Assets | $184,531 | $184,531 | $184,531 | $184,531 | $184,531 | $184,531 | $184,531 | $184,531 | $184,531 | $184,531 | $184,531 | $184,531 | $184,531 |
| Total Current Assets | $341,223 | $358,839 | $349,019 | $352,690 | $343,918 | $329,479 | $327,728 | $320,912 | $313,796 | $309,718 | $302,027 | $304,337 | $306,202 |
| Long-term Assets | |||||||||||||
| Long-term Assets | $120,579 | $120,579 | $120,579 | $120,579 | $120,579 | $120,579 | $120,579 | $120,579 | $120,579 | $120,579 | $120,579 | $120,579 | $120,579 |
| Accumulated Depreciation | $60,760 | $61,705 | $62,650 | $63,595 | $64,540 | $65,485 | $66,430 | $67,375 | $68,320 | $69,265 | $70,210 | $71,155 | $72,100 |
| Total Long-term Assets | $59,819 | $58,874 | $57,929 | $56,984 | $56,039 | $55,094 | $54,149 | $53,204 | $52,259 | $51,314 | $50,369 | $49,424 | $48,479 |
| Total Assets | $401,042 | $417,713 | $406,948 | $409,674 | $399,957 | $384,573 | $381,877 | $374,116 | $366,055 | $361,032 | $352,396 | $353,761 | $354,681 |
| Liabilities and Capital | Jan | Feb | Mar | Apr | May | Jun | Jul | Aug | Sep | Oct | Nov | Dec | |
| Current Liabilities | |||||||||||||
| Accounts Payable | $9,036 | $42,644 | $44,030 | $47,537 | $45,241 | $43,182 | $45,654 | $40,716 | $39,321 | $39,603 | $38,673 | $40,765 | $41,048 |
| Current Borrowing | $634,601 | $617,601 | $600,601 | $583,601 | $566,601 | $549,601 | $532,601 | $515,601 | $498,601 | $481,601 | $464,601 | $447,601 | $430,601 |
| Other Current Liabilities | $0 | $0 | $0 | $0 | $0 | $0 | $0 | $0 | $0 | $0 | $0 | $0 | $0 |
| Subtotal Current Liabilities | $643,637 | $660,245 | $644,631 | $631,138 | $611,842 | $592,783 | $578,255 | $556,317 | $537,922 | $521,204 | $503,274 | $488,366 | $471,649 |
| Long-term Liabilities | $293,480 | $291,035 | $288,590 | $286,145 | $283,700 | $281,255 | $278,810 | $276,365 | $273,920 | $271,475 | $269,030 | $266,585 | $264,140 |
| Total Liabilities | $937,117 | $951,280 | $933,221 | $917,283 | $895,542 | $874,038 | $857,065 | $832,682 | $811,842 | $792,679 | $772,304 | $754,951 | $735,789 |
| Paid-in Capital | $293,480 | $293,480 | $293,480 | $293,480 | $293,480 | $293,480 | $293,480 | $293,480 | $293,480 | $293,480 | $293,480 | $293,480 | $293,480 |
| Accumulated Surplus/Deficit | ($611,473) | ($829,555) | ($829,555) | ($829,555) | ($829,555) | ($829,555) | ($829,555) | ($829,555) | ($829,555) | ($829,555) | ($829,555) | ($829,555) | ($829,555) |
| Surplus/Deficit | ($218,082) | $2,507 | $9,802 | $28,466 | $40,490 | $46,610 | $60,887 | $77,509 | $90,288 | $104,428 | $116,167 | $134,885 | $154,967 |
| Total Capital | ($536,075) | ($533,568) | ($526,273) | ($507,609) | ($495,585) | ($489,465) | ($475,188) | ($458,566) | ($445,787) | ($431,647) | ($419,908) | ($401,190) | ($381,108) |
| Total Liabilities and Capital | $401,042 | $417,713 | $406,948 | $409,674 | $399,957 | $384,573 | $381,877 | $374,116 | $366,055 | $361,032 | $352,396 | $353,761 | $354,681 |
| Net Worth | ($536,075) | ($533,568) | ($526,273) | ($507,609) | ($495,585) | ($489,465) | ($475,188) | ($458,566) | ($445,787) | ($431,647) | ($419,908) | ($401,190) | ($381,108) |


